

HBeeID: a molecular tool that identifies honey bee subspecies from different geographic populations
- PMID: 39192185
- PMCID: PMC11348773
- DOI: 10.1186/s12859-024-05776-9
HBeeID: a molecular tool that identifies honey bee subspecies from different geographic populations
Abstract
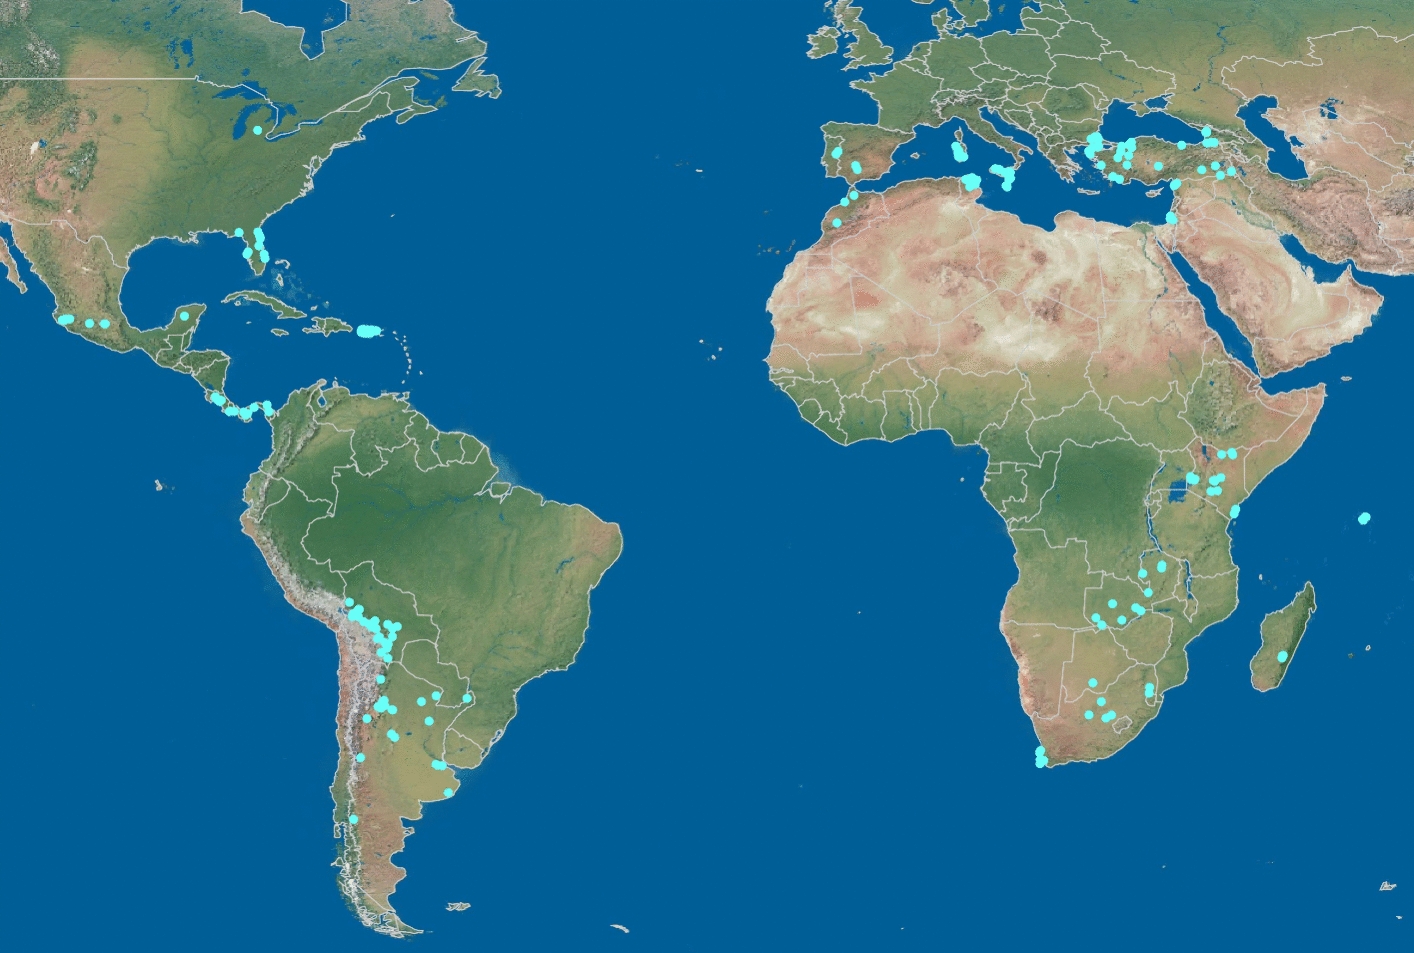
Background: Honey bees are the principal commercial pollinators. Along with other arthropods, they are increasingly under threat from anthropogenic factors such as the incursion of invasive honey bee subspecies, pathogens and parasites. Better tools are needed to identify bee subspecies. Genomic data for economic and ecologically important organisms is increasing, but in its basic form its practical application to address ecological problems is limited.
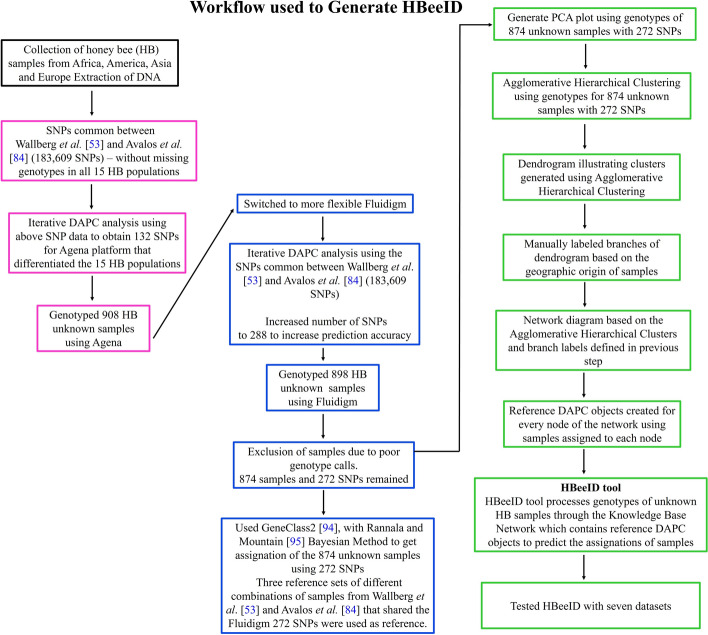
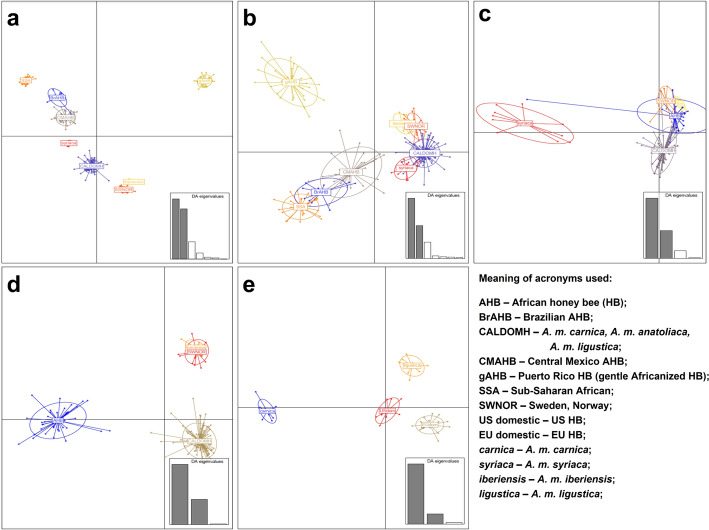
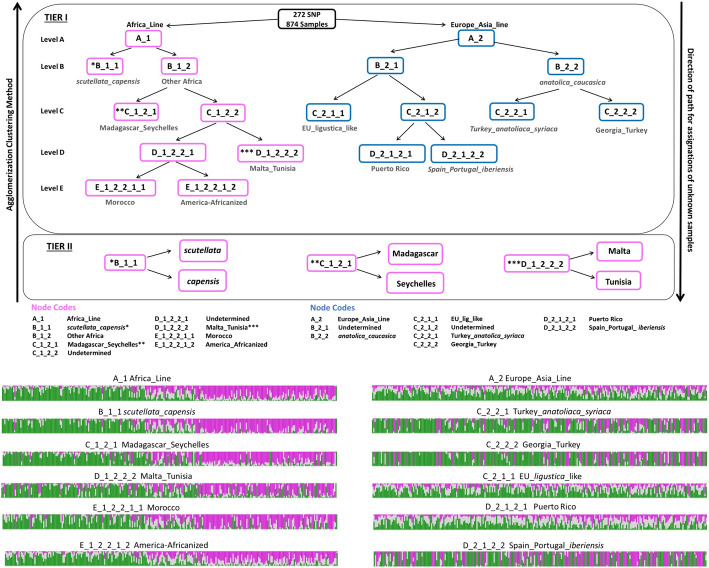
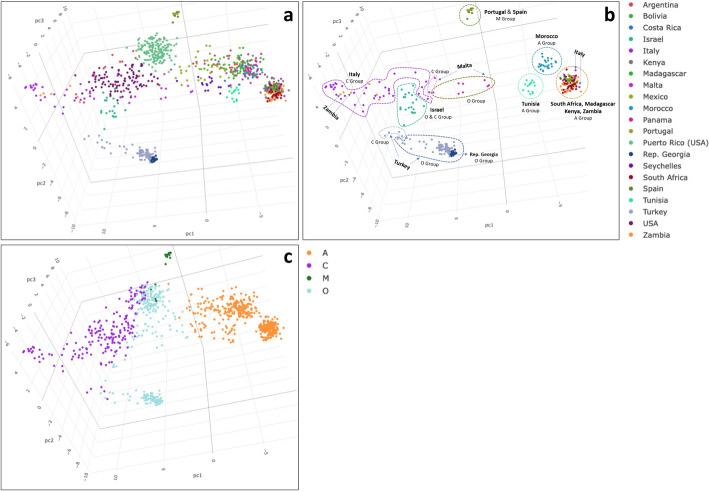
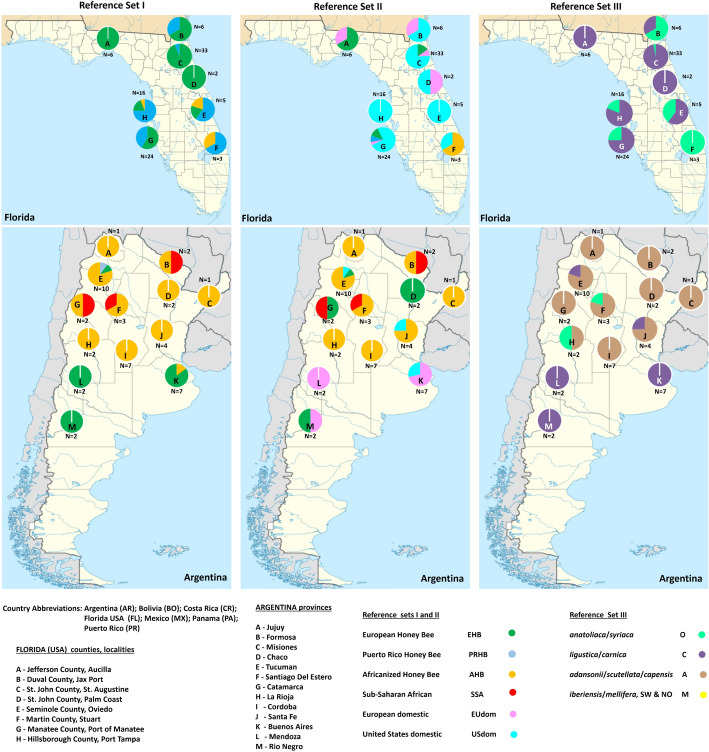
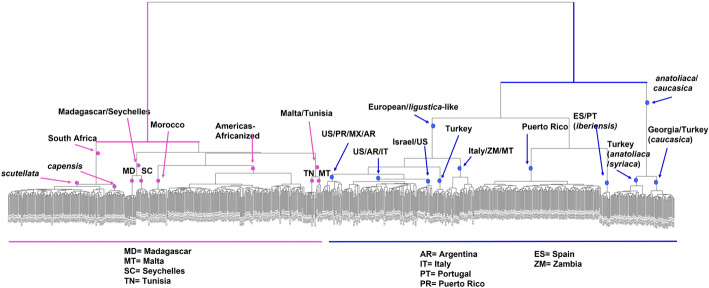
Results: We introduce HBeeID a means to identify honey bees. The tool utilizes a knowledge-based network and diagnostic SNPs identified by discriminant analysis of principle components and hierarchical agglomerative clustering. Tests of HBeeID showed that it identifies African, Americas-Africanized, Asian, and European honey bees with a high degree of certainty even when samples lack the full 272 SNPs of HBeeID. Its prediction capacity decreases with highly admixed samples.
Conclusion: HBeeID is a high-resolution genomic, SNP based tool, that can be used to identify honey bees and screen species that are invasive. Its flexible design allows for future improvements via sample data additions from other localities.
Keywords: Diagnostic; Hierarchical agglomerative clustering; Honey bee; Invasive; Network; SNP.
© 2024. This is a U.S. Government work and not under copyright protection in the US; foreign copyright protection may apply.
Conflict of interest statement
The authors declare that they have no competing interests.
Figures
References
-
- Cardoso P, Erwin TL, Borges PAV, New TR. The seven impediments in invertebrate conservation and how to overcome them. Biol Conserv. 2011;144(11):2647–55. 10.1016/j.biocon.2011.07.024 - DOI
-
- Gallai N, Salles JM, Settele J, Vaissière BE. Economic valuation of the vulnerability of world agriculture confronted with pollinator decline. Ecol Econ. 2009;68(3):810–21. 10.1016/j.ecolecon.2008.06.014 - DOI
-
- IPBES. The assessment report of the Intergovernmental Science-Policy Platform on Biodiversity and Ecosystem Services on pollinators, pollination and food production [Internet]. Zenodo; 2016 Dec [cited 2023 May 11]. Available from: https://zenodo.org/record/3402856
-
- Bauer DM, Wing IS. Economic consequences of pollinator declines: a synthesis. Agric Resour Econ Rev. 2010;39(3):368–83. 10.1017/S1068280500007371 - DOI
MeSH terms
Grants and funding
- PRSTRT # 2020-00081/Puerto Rico Science, Technology and Research Trust, United States of America
- PRSTRT # 2020-00081/Puerto Rico Science, Technology and Research Trust, United States of America
- USDA-APHIS #AP20PPQS & T00C009/United States Dept. of Agriculture - Animal and Plant Health Inspection Service (APHIS), United States of America
- USDA-APHIS #AP20PPQS & T00C009/United States Dept. of Agriculture - Animal and Plant Health Inspection Service (APHIS), United States of America
- NSF-OISE #1545803/National Science Foundation, United States of America
LinkOut - more resources
Full Text Sources
