. 2024 Aug 27;21(1):31.
doi: 10.1186/s12950-024-00405-x.

MicroRNA mediated suppression of airway lactoperoxidase by TGF-β1 and cigarette smoke promotes airway inflammation

Affiliations

MicroRNA mediated suppression of airway lactoperoxidase by TGF-β1 and cigarette smoke promotes airway inflammation

Maria J Santiago et al. J Inflamm (Lond). .

Abstract

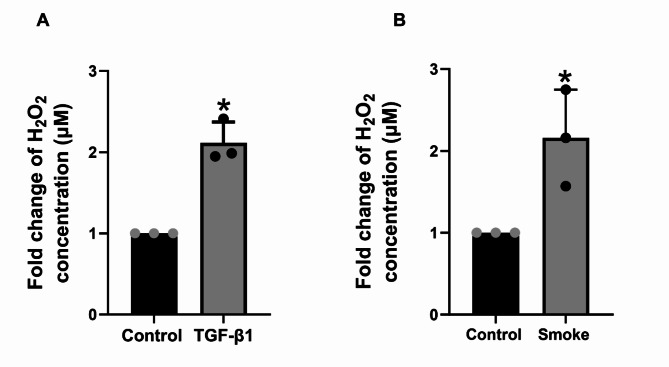
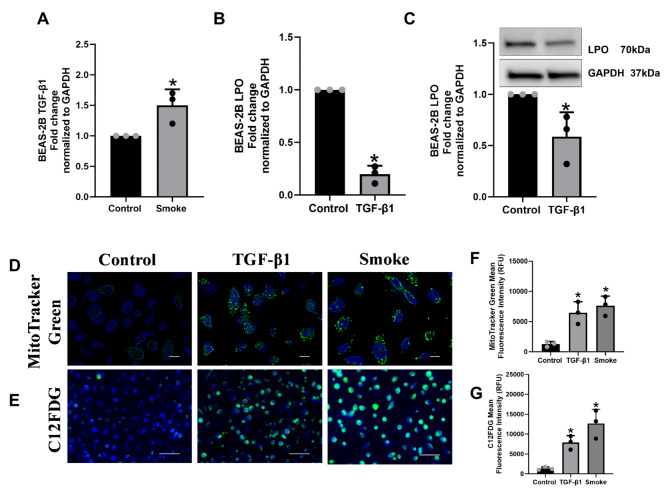
Transforming Growth Factor Beta1 (TGF-β1) signaling is upregulated in Chronic Obstructive Pulmonary disease (COPD), smokers, and people living with HIV. Cigarette smoking and HIV are also independent risk factors for COPD. Chronic inflammation is a hallmark of COPD. However, the underlying mechanisms remain unknown. Previous research has suggested that TGF-β1 alters the airway epithelial microRNAome and transcriptome, potentially contributing to lung inflammation. The Lactoperoxidase (LPO) system is an integral component of innate immunity within the airway. LPO plays a crucial role in host defense by catalyzing the oxidation of thiocyanate to hypothiocyanite in the presence of hydrogen peroxide (H2O2), generating a potent antibacterial and antiviral agent. Additionally, the LPO system potentially aids in maintaining cellular redox balance by reducing the levels of H2O2, thus mitigating oxidative stress within the airway epithelium. LPO dysfunction can impair immune responses and exacerbate inflammatory processes in respiratory diseases.In this study, primary bronchial epithelial cells and bronchial cell lines were treated with TGF-β1 and exposed to cigarette smoke to characterize the effect of these factors on LPO and their downstream effects. RT-qPCR and Western Blot were applied to quantify mRNA and proteins' expression. The levels of H2O2 were detected using the Amplex Red Assay. Magnetofection and transfection were applied to probe the effect of miR-449b-5p. Staining procedures using the MitoTracker Green and C12FDG dyes were used to establish mitochondria mass and senescence. The levels of pro-inflammatory cytokines were measured via Luminex assays.We found that TGF-β1 and cigarette smoke suppressed airway LPO expression, increasing H2O2 levels. This increase in H2O2 had downstream effects on mitochondrial homeostasis, epithelial cellular senescence, and the pro-inflammatory cytokine response. We demonstrate for the first time that airway LPO is regulated by TGF-β1-induced miRNA-mediated post-transcriptional silencing through miR-449b-5p in the lungs. Further, we identify and validate miR-449-5p as the candidate miRNA upregulated by TGF-β1, which is involved in LPO suppression. This paper demonstrates a new mechanism by which TGF-β1 can lead to altered redox status in the airway.

Keywords: COPD; Cigarette smoke; IL-6; Inflammation; LPO; TGF-β1; miR-449b-5p.


Conflict of interest statement

The authors declare no competing interests.

Figures

Fig. 1
Fig. 1
TGF-β1 alters the microRNAome to suppress LPO. Panel A, RT-qPCR of Fold change expression of LPO from NHBE cells treated with 10ng/ml of TGF-β1 and TGF-β1 + 25 μM of ATA vs. Control after 24 hours post-treatment. Panel B, Western Blot and quantification of LPO expression from NHBE cells treated with 10ng/ml of TGF-β1 for 24 hours normalized by GAPDH. Panel C, RT-qPCR of Fold change expression of miR-449b-5p by TGF-β1 treatment normalized by GAPDH after 24 hours. For panel A-C, data are from 3 different experiments using cells from 3 different lungs. Panel D, RT-qPCR of fold change expression of LPO transfected with PolyMag reagent (control) 10ng/ml TGF-β1, mimic and inhibitor of miR-449-5p individually or in combination with TGF-β1 in NHBE cells. Panel E, RT-qPCR of fold change expression of TGF-β1 from COPD lung tissue samples vs. non-smokers. Panel F, RT-qPCR of fold change expression of LPO from non-smokers lung tissue (control) and COPD patients. For panels E and F, data are from lung tissues of 3 COPD and 3 controls. Panel G, RT-qPCR of fold change expression of LPO from mouse samples exposed to cigarette smoke vs. Air (control) for 3 months. Panel H, Western Blot membrane and quantification of LPO expression from mouse samples exposed to cigarette smoke vs. Air (control) for 3 months normalized by GAPDH. For panels E and F, data are from 3 mice, each exposed to CS or air (as control). N.S, non-significant between two different treatments. *Significant (p < 0.05). Full membranes for Fig. B and H are found in Supplementary Material 2
Fig. 2
Fig. 2
TGF-β1 and cigarette smoke-mediated LPO suppression translates to an increase of ASL-H2O2in NHBE. Panel A, Fold change expression of H2O2 production in NHBE cells after 24 hours of 10ng/ml TGF-β1 treatment compared with the same lungs exposed to air (control). Panel B, Fold change expression of H2O2 production in NHBE cells after 48 hours of cigarette smoke exposure compared with the same lungs exposed to air (control). ASL wash was collected and analyzed for the production of H2O2 by Amplex red Assay. Data are from 3 different experiments using cells from 3 different lungs. *Significant (p < 0.05) from control
Fig. 3
Fig. 3
TGF-β1 and CS lead to senescence and defective mitophagy in BEAS-2B. Panel A, RT-qPCR of Fold change expression of TGF-β1 from BEAS-2B cells exposed to cigarette smoke for 48 hours. Panel B, RT-qPCR of fold change expression of LPO from BEAS-2B cells treated with 10ng/ml of TGF-β1 for 48 hours. Panel C, Western Blot membrane and quantification of LPO expression from BEAS-2B cells treated with 10ng/ml of TGF-β1 after 48 hours of treatment normalized by GAPDH. Panel D, BEAS-2B cells treated with 10ng/ml of TGF-β1 or exposed to cigarette smoke. Media was substituted with fresh medium with respective treatments every 48 hours for 6 days. After 6 days, cells were stained with 100μM of MitoTracker Green and counterstaining with DAPI. Images were acquired with Keyence All in one microscope (100X) at the same exposure time. Scale Bar 10 μm. Panel E, another set of identical treatments stained with 33μM C12FDG, 50nM Bafilomycin A1, and counterstaining with DAPI. Images were acquired using Keyence All in one microscope (40X) at the same exposure time. Scale bar 50 μm. Panel F quantifies the mean fluorescence intensity for the MitoTracker Green staining for 10ng/ml of TGF-β1 and cigarette smoke exposure. Panel G quantifies the mean fluorescence intensity for the C12FDG staining for 10ng/ml of TGF-β1 and cigarette smoke exposure. Staining quantification values were obtained by the ImageJ browser from the National Institute of Health. All experiments were performed three times.* Significant (p < 0.05). Full membranes for Fig. C are found in Supplementary Material 2
Fig. 4
Fig. 4
Transfection of miR-449b-5p mimic leads to defective mitophagy and senescence. Panel A, RT-qPCR of Fold change expression of miR-449b-5p from BEAS-2B cells treated with 10ng/ml of TGF- β1 for 48 hours. Panel B, BEAS-2B transfected with 40nM of miR-449b-5p mimic using RNAiMax reagent. After 48 h, cells were stained with 100nM of MitoTracker Green and counterstained with DAPI. Images were acquired with Keyence All in one microscope (100X) at the same exposure time. Scale Bar 10 μm. Panel C, BEAS-2B transfected with 40nM of miR-449b-5p mimic using RNAiMax reagent. After 48 h, cells were stained with 33μM C12FDG, 50nM Bafilomycin A1, and counterstaining with DAPI. Images were acquired using Keyence All in one microscope (40X) at the same exposure time. Scale bar 50 μm. Panel D quantifies the mean fluorescence intensity for the MitoTracker Green staining for the transfection of 40nM miR-449b-5p mimic. Panel E quantifies the mean fluorescence intensity for the C12FDG staining for the transfection of 40nM miR-449b-5p mimic. All experiments were performed three times. *Significant (p < 0.05). Staining quantification values were obtained by the ImageJ browser from the National Institute of Health
Fig. 5
Fig. 5
TGF-β1 increases the pro-inflammatory cytokine secretion in NHBE cells. Panel A, Heatmap of the pro-inflammatory cytokine response from NHBE cells treated with 10ng/ml of TGF-β1 after 6 days of treatment compared with the control vehicle. Media was substituted with fresh medium with respective treatments every 48 hours. After 6 days, supernatants were collected and analyzed using the Luminex assay with the Bio-Plex Pro human cytokine immunoassay kit. Panel B quantifies the fold change expression of the concentration of pro-inflammatory cytokines. Only values higher than 2-fold were taken into consideration for the graph to include only significant values p < 0.05. Experiments represent 3 different lung samples. Cytokines were quantified in pg/ml, and control (vehicle) was used for normalization to 1 to establish the mean fold change
Fig. 6
Fig. 6
Graphical summary of the key discoveries outlined in our paper. Schematic representation of the TGF-β1 and CS-mediated LPO suppression pathway and its downstream effects on inflammation. Red arrows pointed upwards represent the upregulation of the gene, and red arrows pointed down represent the downregulation of genes. The figure was created using the BioRender Website

References

    1. Antoniou T, Yao Z, Raboud J, Gershon AS. Incidence of chronic obstructive pulmonary disease in people with HIV in Ontario, 1996–2015: a retrospective population-based cohort study. CMAJ open. 2020;8(1):E83–9. 10.9778/cmajo.20190028 - DOI - PMC - PubMed
    1. Larsen DL, Gandhi H, Pollack M, Feigler N, Patel S, Wise RA. The quality of care and economic burden of COPD in the United States: considerations for managing patients and improving outcomes. Am Health Drug Benefits. 2022;15(2):57–64.
    1. Singhvi D, Bon J, Morris A. Obstructive lung disease in HIV—phenotypes and pathogenesis. Curr HIV/AIDS Rep. 2019;16(4):359–69. 10.1007/s11904-019-00456-3 - DOI - PubMed
    1. André S, Conde B, Fragoso E, Boléo-Tomé JP, Areias V, Cardoso J. COPD and cardiovascular disease. Pulmonology. 2019;25(3):168–76. 10.1016/j.pulmoe.2018.09.006 - DOI - PubMed
    1. Gayle A, Dickinson S, Poole C, Pang M, Fauconnot O, Quint JK. Incidence of type II diabetes in chronic obstructive pulmonary disease: a nested case-control study. npj Prim Care Respiratory Med. 2019;29(1):28.10.1038/s41533-019-0138-6 - DOI - PMC - PubMed

LinkOut - more resources