. 2024 Aug;13(16):e70121.
doi: 10.1002/cam4.70121.

Similar usage of T-cell receptor β-chain between tumor and adjacent normal tissue in hepatocellular carcinoma

Affiliations

Similar usage of T-cell receptor β-chain between tumor and adjacent normal tissue in hepatocellular carcinoma

Jie-Zuan Yang et al. Cancer Med. 2024 Aug.

Abstract

Background: In this study, we comprehensively profiled the T-cell receptor (TCR) repertoire of the tumor and adjacent normal tissue in patients with HBV-associated hepatocellular carcinoma (HCC) and determined the baseline characteristics and clinical significance of TCR.

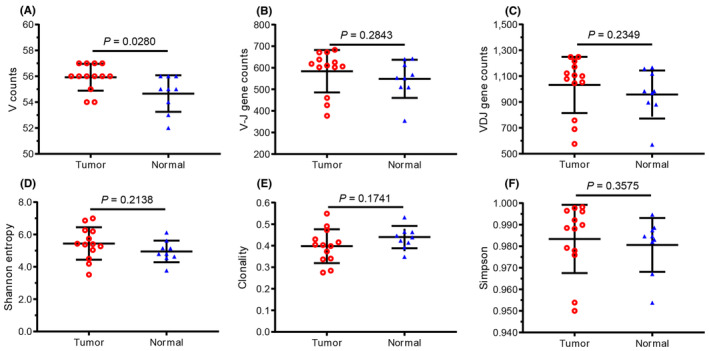
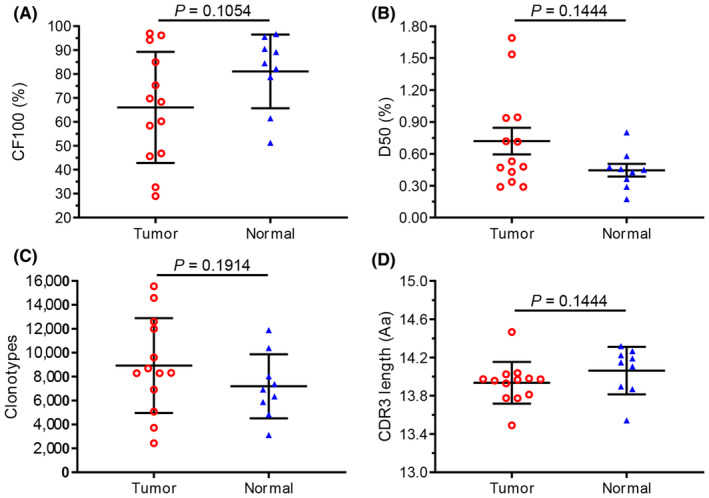
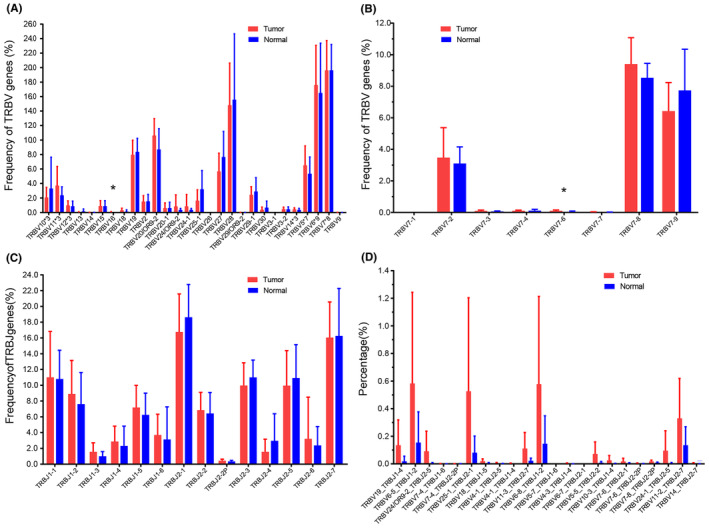
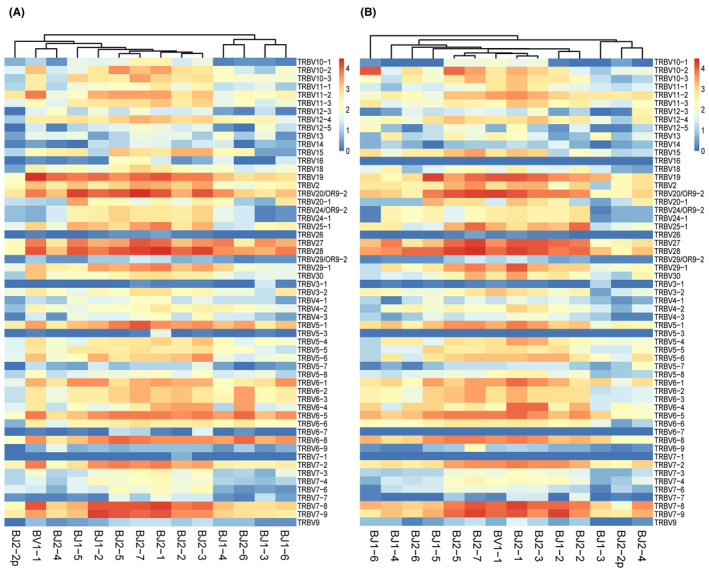
Methods: High-throughput sequencing was used to determine the profile of complementarity-determining region 3 (CDR3) of the TCR-β chain variable (TRBV) in the tumor and normal tissue samples of 14 HCC patients. At the same time, TRBV diversity and differences in expression between tumor and normal tissues were investigated. The cumulative frequency of top 100 CDR3 (CF100), clonality, and Shannon entropy as indices to evaluate diversity, RESULTS: The diversity of TRBV CDR3 showed no significant difference between tumor and normal tissues. Of the 58 V gene segments in TRBV, TRBV16 and TRBV7-6 had a significantly higher frequency in the tumor group than in the normal group (p < 0.05). The frequency of 14 J gene segments showed no significant difference between tumor and normal tissues. In contrast, the frequency of 22 TRBVx/BJx combinations was significantly higher in the tumor than in the normal tissue. In addition, the length and type of TRBV CDR3 were similar in tumor and normal tissues, and a Gaussian distribution was observed in both groups.

Conclusion: This study provided a large amount of information about the TCR lineage in HBV-associated HCC, laying the foundation for further research. In addition, the fact that the immune repertoire (TRBV CDR3) hardly differs between tumor and adjacent normal tissue provides a new clue for exploring the mechanism of the liver as an organ with immune privileges.

Keywords: T‐cell receptor β‐chain; complementarity determining region 3; hepatocellular carcinoma; immune privilege; immune repertoire.


Conflict of interest statement

No potential conflicts of interest were disclosed.

Figures

FIGURE 1
FIGURE 1
Comparison of the number of V, V–J, and VDJ genes, and their diversity indices between tumor and adjacent normal tissue. (A) V gene, (B) V–J gene combination, (C) VDJ gene combination, (D) Shannon Entropy (SE), (E) Clonality, and (F) Simpson, of tumor and adjacent normal tissue (normal) for each patient. Each dot represents an index of each patient, and the bars show the mean ± standard deviation (SD). The tumor and adjacent normal tissue (normal) were harvested from 14 patients with HCC, the paired liver tumor tissue (tumor), and normal tissue from 8 patients, only the tumor from 5 patients, and only the normal tissue from 1 patient. A total of 13 (8 + 5) tumor tissues and 9 (8 + 1) normal tissues were used for the study.
FIGURE 2
FIGURE 2
Comparison of cumulative frequency, number of clonotypes, and CDR3 length between tumor and adjacent normal tissue in HCC patients. (A) Cumulative frequency of top 100 CDR3s (CF100) in tumor and adjacent normal tissue (normal). Data points represent CF100s in the total repertoire of each patient, and bars show the mean (±SD) of CF100s. (B) Clonal amplification of each patient's TRBV clonotype was described by D50. (C) Comparison of the number of CDR3 clonotypes between tumor and normals. (D) Comparison of the average CDR3 length between tumor and normals. Data points represent the average CDR3 length of each individual, and bars show the mean (±SD) of CDR3 length. D50, the ratio between the number of unique CDR3 accounting for 50% of the total reads and the total number of unique CDR3 reads. CDR3, complementary determinant region 3; HCC, hepatocellular carcinoma; TRBV, TCR beta chain variable.
FIGURE 3
FIGURE 3
Comparison of the utilization of the paired genes TRBV, BJ, and BV/BJ in tumor and adjacent normal tissue. (A) The usage frequencies of 28 TRBV gene subfamilies in tumor and adjacent normal tissues (normal). The number after “*” represents the number of subfamilies in that TRBV family, for example, TRBV7*8 means that the TRBV7 family includes 8 subfamilies. (B) The 8 subfamilies of TRBV7 in detail. (C) The usage frequencies of 14 BJ genes in two tissues. (D) The usage frequencies of 22 TRBV/BJ genes that are particularly abundant in tumor tissues compared with normal tissues. Data show the mean (±SD) abundance for each subject. Data were compared using the Mann–Whitney test, *p < 0.05. Of all TRBV families, only TRBV16 and BV7‐6 show significantly different expression between the two tissues (p = 0.0443, 0.0228). For TRBJ families, there is no significant difference between the two tissues. TRBV, TCR beta chain variable.
FIGURE 4
FIGURE 4
Expression frequency of TRBV/BJ combination in tumor and adjacent normal tissues. (A) Heatmap of BV/BJ gene combinations in HCC and (B) adjacent normal tissues (normal) from IMGT/Stat clonotype analysis shows that there are some different BV/BJ gene combinations between tumor and normal tissues. Thus, the 14 TRBJ families in tumor and normal tissues are obviously divided into two clusters, with each cluster consisting of different TRBJ families. The heatmap bar shows the frequency of use of BV/BJ gene combinations in each sample. TRBV, TCR beta chain variable.
FIGURE 5
FIGURE 5
Correlation between TCR diversity and biomarkers of systemic inflammation. Correlation between TCR diversity (Shannon entropy) and LDH in (A) tumor, in (B) adjacent normal tissue (normal); correlation between TCR diversity and NLR in (C) tumor, in (D) normal. Statistical analysis was performed using the Spearman rank test. LDH, lactate dehydrogenase; NLR, neutrophil/lymphocyte ratio; TCR, T‐cell receptor.

Similar articles

Cited by

References

    1. Lin KR, Deng FW, Jin YB, et al. T cell receptor repertoire profiling predicts the prognosis of HBV‐associated hepatocellular carcinoma. Cancer Med. 2018;7:3755‐3762. - PMC - PubMed
    1. Loong HH, Shimizu T, Prawira A, et al. Recommendations for the use of next‐generation sequencing in patients with metastatic cancer in the Asia‐Pacific region: a report from the APODDC working group. ESMO Open. 2023;8:101586. - PMC - PubMed
    1. Pinter M, Scheiner B, Pinato DJ. Immune checkpoint inhibitors in hepatocellular carcinoma: emerging challenges in clinical practice. Lancet Gastroenterol Hepatol. 2023;8:760‐770. - PubMed
    1. Grohmann M, Wiede F, Dodd GT, et al. Obesity drives STAT‐1‐dependent NASH and STAT‐3‐dependent HCC. Cell. 2018;175:1289‐1306. - PMC - PubMed
    1. Cao W, Lu J, Li S, Song F, Xu J. Transcriptomic analysis of graft liver provides insight into the immune response of rat liver transplantation. Front Immunol. 2022;13:947437. - PMC - PubMed

MeSH terms

Substances