. 2024 Dec;46(2):2394635.
doi: 10.1080/0886022X.2024.2394635. Epub 2024 Aug 27.

MiR-454-3p regulates high glucose-induced mesothelial-mesenchymal transition and glycolysis in peritoneal mesothelial cells by targeting STAT3

Affiliations

MiR-454-3p regulates high glucose-induced mesothelial-mesenchymal transition and glycolysis in peritoneal mesothelial cells by targeting STAT3

Nan Li et al. Ren Fail. 2024 Dec.

Abstract

Background: The quality of life of patients receiving long-term peritoneal dialysis (PD) is significantly impacted by the onset of peritoneal fibrosis (PF), and one of the pathological changes is mesothelial-mesenchymal transition (MMT). In this study, we investigated the potential roles of miR-454-3p and signal transducer and activator of transcription 3 (STAT3) in the progression of peritoneal MMT and the underlying mechanisms.

Methods: Peritoneums were collected to detect morphology via hematoxylin-eosin staining and differentially expressed miRNAs were detected via RT-qPCR. PD effluent-derived cell populations in the peritoneal cavity were isolated from the effluents of 20 PD patients to determine miR-454-3p, STAT3, and MMT markers via Western blotting and RT-qPCR. The relationship between miR-454-3p and STAT3 was examined via a dual-luciferase reporter assay. Western blotting and RT-qPCR were utilized to evaluate the expression of STAT3, MMT markers, and glycolytic enzymes. Immunofluorescence staining revealed the localization and expression of MMT markers and STAT3.

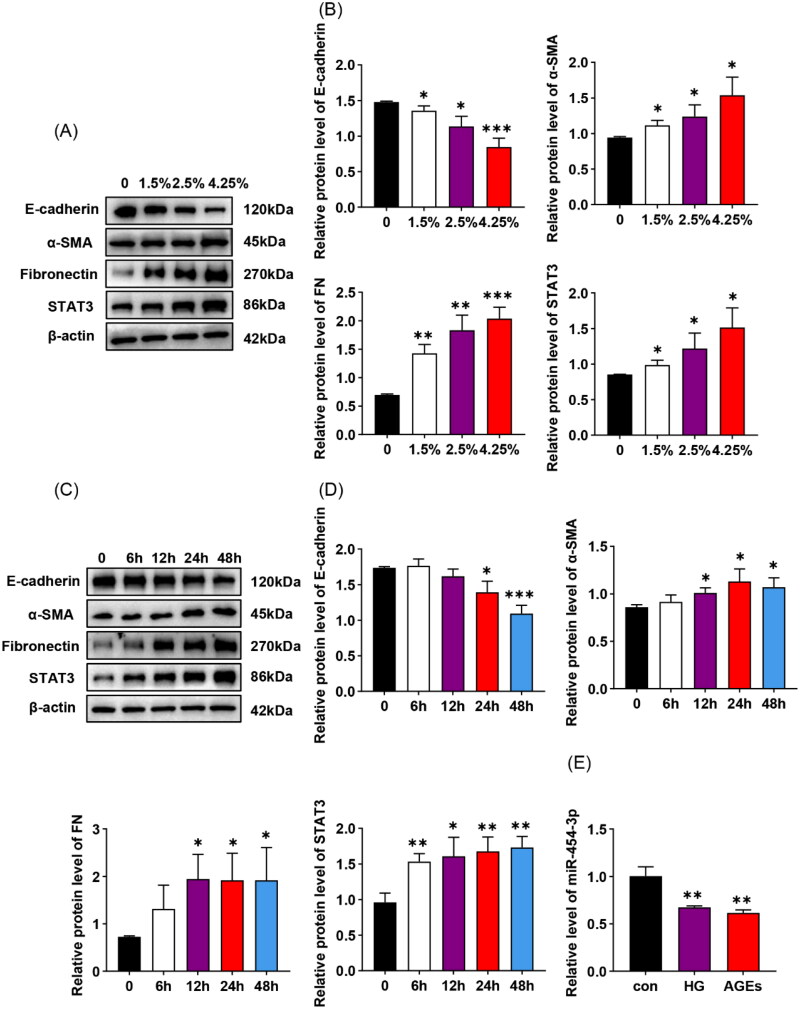
Results: MiR-454-3p was downregulated in the peritoneums and PD effluent-derived cell populations of long-term PD patients. High glucose (HG) treatment promoted HMrSV5 cell MMT and glycolysis. MiR-454-3p overexpression alleviated HG-induced MMT and suppressed the expression of STAT3 and glycolytic enzymes. In contrast, the miR-454-3p inhibitor exacerbated HG-induced MMT and promoted the expression of glycolytic enzymes and STAT3. Moreover, STAT3 was the target of miR-454-3p.

Conclusions: This study demonstrated the protective role of miR-454-3p in HG-induced MMT and glycolysis in HMrSv5 cells, suggesting that miR-454-3p may prevent MMT by suppressing glycolytic enzymes via the STAT3/PFKFB3 pathway in the HG environment.

Keywords: Glycolysis; STAT3; mesothelial-mesenchymal transition (MMT); miR-454-3p; peritoneal fibrosis.


Conflict of interest statement

The authors report there are no competing interests to declare.

Figures

Figure 1.
Figure 1.
MiR-454-3p was significantly downregulated in the peritoneal tissues and PD effluent-derived cell populations in the peritoneal cavity from patients with long-term PD. (A) HE staining of the peritoneal membrane in patients. Quantification of the thickness of the compact zone of the peritoneum. Magnification ×100. (B) Relative expression of 14 miRNAs in the human peritoneal membrane determined via RT-qPCR. n = 3 in the control group. n = 6 in the PD group. (C, D) MiR-454-3p and mRNA expression levels of E-cadherin, α-SMA, FN, and STAT3 in the experimental groups were determined by RT-qPCR. n = 6 independent experiments. (E) Cell populations in effluents from the PD patients were assessed by Western blotting analysis. n = 4 independent experiments. (F) E-cadherin, α-SMA, FN, and STAT3 protein band densities were normalized to those of β‐actin, as shown in the bar graphs. The data are presented as the means ± SDs. *p < 0.05, **p < 0.01, and ***p < 0.001. Con, control; PD, peritoneal dialysis.
Figure 2.
Figure 2.
MiR-454-3p was downregulated in HG-induced MMT, whereas STAT3 was upregulated. (A, B) The HMrSV5 cells were treated with 84 mM (1.5%), 136 mM (2.5%), or 236 mM (4.25%) glucose for 48 h. Then, the cells were harvested. The protein expression levels of E-cadherin, α-SMA, FN, and STAT3 were determined by Western blotting analysis. (C, D) The HMrSV5 cells were stimulated with 236 mM (4.25%) glucose for different durations (0, 6, 12, 24, and 48 h) before the cells were harvested. The protein expression levels of E-cadherin, α-SMA, FN, and STAT3 were detected via Western blotting. (E) The HMrSV5 cells were treated with 236 mM (4.25%) glucose or 50 μg/mL AGEs for 48 h. The miR-454-3p expression level was evaluated by RT-qPCR. The data are presented as the means ± SDs. n = 3 independent experiments. *p < 0.05, **p < 0.01, and ***p < 0.001versus the 0 h or control group. Con, control; HG, high glucose; AGEs, advanced glycation end-products.
Figure 3.
Figure 3.
MiR-454-3p Targeted the 3’-UTR of STAT3. (A) The HMrSV5 cells were transfected with the miR-454-3p mimic or NC mimic for 48 h. The cells were subsequently collected, and the miR-454-3p expression levels were detected by RT-qPCR. (B) The protein and mRNA expression levels of STAT3 were evaluated by Western blotting and RT-qPCR, respectively. (C) TargetScan.org was used to predict the potential miR-454-3p seed region at the 3’-UTR of STAT3. Luciferase reporter plasmids were co-transfected with the miR-454-3p mimic or NC mimic into HEK-293T cells. After 48 h, the normalized levels of luciferase activity were measured via a luminometer. The data are presented as the means ± SDs. n = 3 independent experiments. *p < 0.05, **p < 0.01, and ***p < 0.001 versus the NC mimic group. NC mimic, negative control mimic; NC, negative control plasmid; WT, wild type; mut, the mutant of the potential binding site in the 3’-UTR of STAT3.
Figure 4.
Figure 4.
Overexpression of miR-454-3p attenuated HG-induced MMT and suppressed STAT3 expression in the HMrSV5 cells. (A) The HMrSV5 cells were transfected with the miR-454-3p mimic or NC mimic. The cells were subsequently incubated in 236 mM glucose for 48 h before being harvested. The miR-454-3p expression level was evaluated by RT-qPCR. RT-qPCR (B), immunofluorescence staining (C), and Western blotting (D, E) results revealed that the miR-454-3p mimic downregulated the expression of α-SMA, FN, and STAT3 and upregulated the expression of E-cadherin compared with those in the HG group. Magnification ×200. The data are presented as the means ± SDs. n = 3 independent experiments. *p < 0.05, **p < 0.01, and ***p < 0.001 compared between groups. Con, control; HG, high glucose; NC mimic, negative control mimic.
Figure 5.
Figure 5.
The miR-454-3p inhibitor aggravated HG-induced MMT and enhanced STAT3 expression levels in the HMrSV5 cells. (A) The HMrSV5 cells were transfected with the miR-454-3p inhibitor or NC inhibitor for 48 h. The cells were subsequently harvested to determine the miR-454-3p expression levels via RT-qPCR. (B) The HMrSV5 cells were transfected with the miR-454-3p inhibitor or NC inhibitor. After incubation in 236 mM glucose for 48 h, the cells were harvested. The miR-454-3p expression levels were evaluated via RT-qPCR. The results of Western blotting (C, D), RT-qPCR (E), and immunofluorescence staining (F) revealed that compared with the HG group, the miR-454-3p inhibitor upregulated the expression of α-SMA, FN, and STAT3 and downregulated the expression of E-cadherin. Magnification ×200. The data are presented as the means ± SDs. n = 3 independent experiments. *p < 0.05, **p < 0.01, and ***p < 0.001 compared between groups. Con, control; HG, high glucose; NC inhibitor, negative control inhibitor.
Figure 6.
Figure 6.
The overexpression of STAT3 reversed the protective effect of the miR-454-3p mimic on MMT in the HG-treated HMrSV5 cells. The STAT3 overexpression plasmids were co-transfected with the miR-454-3p mimic into 236 mM HG-treated HMrSV5 cells. (A, B) Western blotting analysis indicated that the upregulation of STAT3 suppressed the inhibition of MMT by the miR-454-3p mimic, as demonstrated by the loss of E-cadherin and increased α-SMA expression levels in the HMrSV5 cells. The data are presented as the means ± SDs. n = 3 independent experiments. *p < 0.05, **p < 0.01, and ***p < 0.001 compared between groups. Con, control; HG, high glucose; NC STAT3, negative control STAT3; OE STAT3, overexpression STAT3 plasmids.
Figure 7.
Figure 7.
MiR-454-3p Regulated the expression levels of glycolytic enzymes. (A-C) The HMrSV5 cells were transfected with the miR-454-3p mimic or NC mimic. Then, the cells were incubated in 236 mM glucose for 48 h before they were harvested. The Western blotting and RT-qPCR results revealed that compared with the HG group, the miR-454-3p mimic downregulated the expression levels of PFKFB3, PKM2, and LDHA. (D-F) The HMrSV5 cells were transfected with the miR-454-3p inhibitor or NC inhibitor. After incubation in 236 mM glucose for 48 h, the cells were harvested. The Western blotting and RT-qPCR results revealed that compared with the HG group, the miR-454-3p inhibitor upregulated the expression of PFKFB3, PKM2, and LDHA. (G) In the HMrSV5 cells, the anti-PFKFB3 antibody was used as the bait protein. The interaction between the target protein PFKFB3 and its binding partner STAT3 was detected by Co-IP. The data are presented as the means ± SDs. n = 3 independent experiments. *p < 0.05, **p < 0.01, and ***p < 0.001 compared between groups. Con, control; HG, high glucose; NC mimic, negative control mimic; NC inhibitor, negative control inhibitor.

References

    1. Wu J, Xing C, Zhang L, et al. Autophagy promotes fibrosis and apoptosis in the peritoneum during long-term peritoneal dialysis. J Cell Mol Med. 2018;22(2):1190–1201. doi: 10.1111/jcmm.13393. - DOI - PMC - PubMed
    1. Kumar VA, Sidell MA, Jones JP, et al. Survival of propensity matched incident peritoneal and hemodialysis ­patients in a United States health care system. Kidney Int. 2014;86(5):1016–1022. doi: 10.1038/ki.2014.224. - DOI - PubMed
    1. Cho Y, Bello AK, Levin A, et al. Peritoneal dialysis use and practice patterns: an international survey study. Am J Kidney Dis. 2021;77(3):315–325. doi: 10.1053/j.ajkd.2020.05.032. - DOI - PubMed
    1. Devuyst O, Margetts PJ, Topley N.. The pathophysiology of the peritoneal membrane. J Am Soc Nephrol. 2010;21(7):1077–1085. doi: 10.1681/ASN.2009070694. - DOI - PubMed
    1. Colmont CS, Raby AC, Dioszeghy V, et al. Human peritoneal mesothelial cells respond to bacterial ligands through a specific subset of toll-like receptors. Nephrol Dial Transplant. 2011;26(12):4079–4090. doi: 10.1093/ndt/gfr217. - DOI - PMC - PubMed

MeSH terms

LinkOut - more resources