. 2024 Jul 18;27(8):110537.
doi: 10.1016/j.isci.2024.110537. eCollection 2024 Aug 16.

Time- and cell-specific activation of BMP signaling restrains chondrocyte hypertrophy

Affiliations

Time- and cell-specific activation of BMP signaling restrains chondrocyte hypertrophy

Stephen J Gadomski et al. iScience. .

Abstract

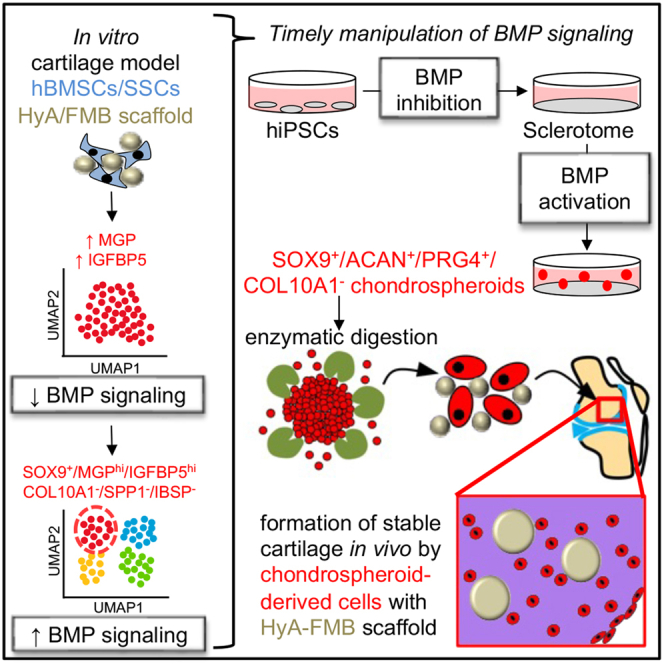
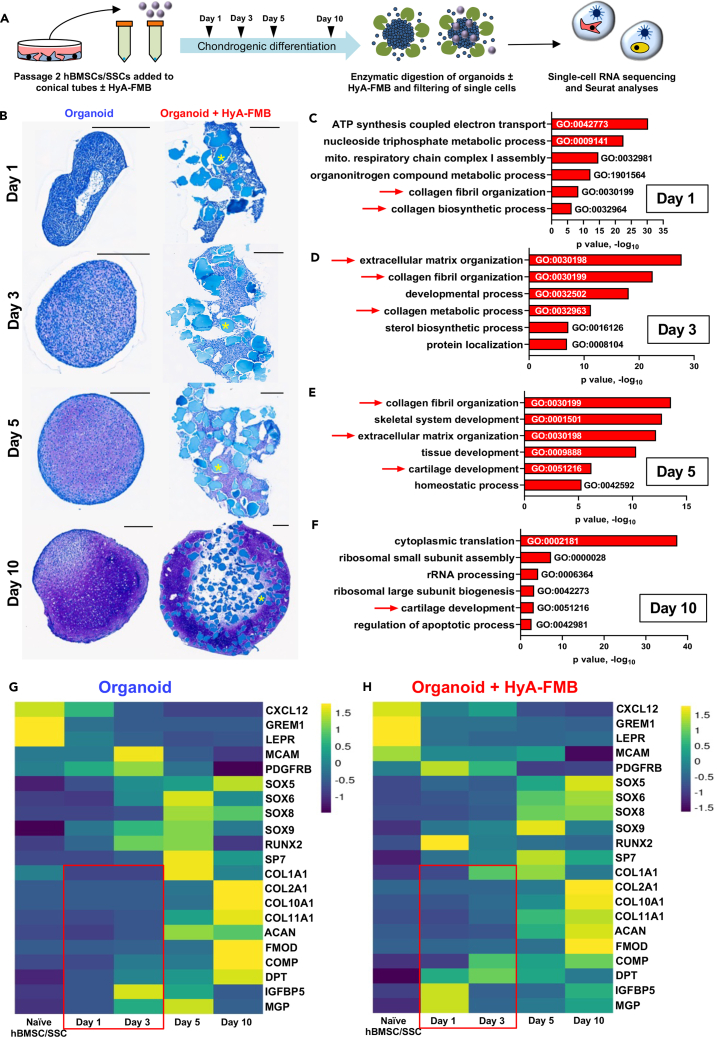
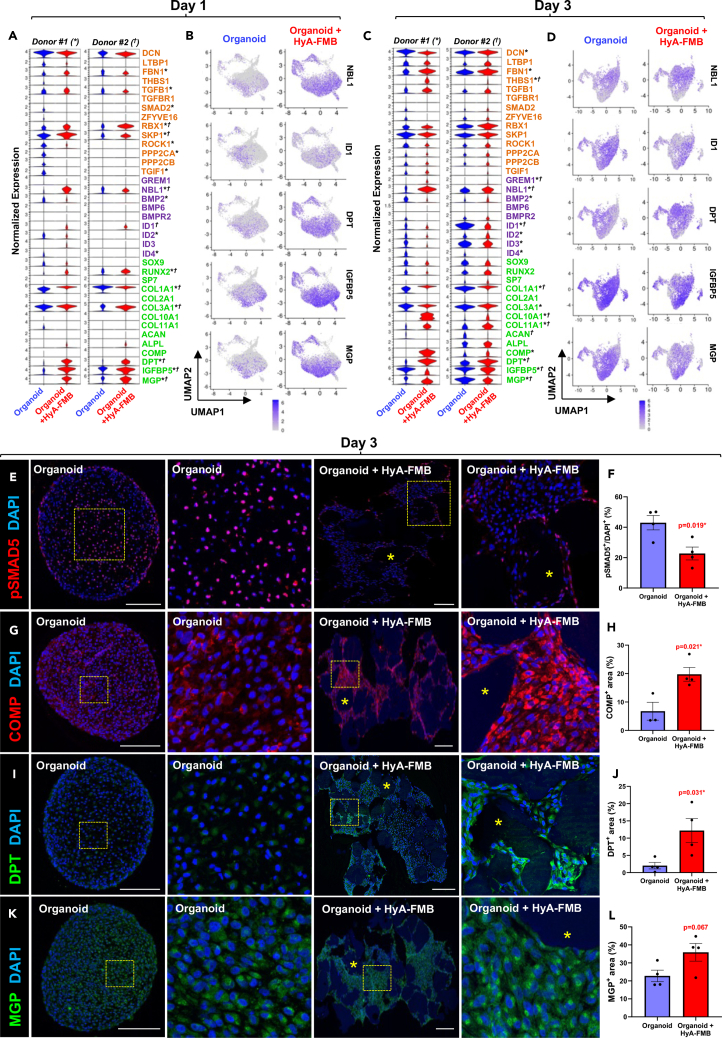
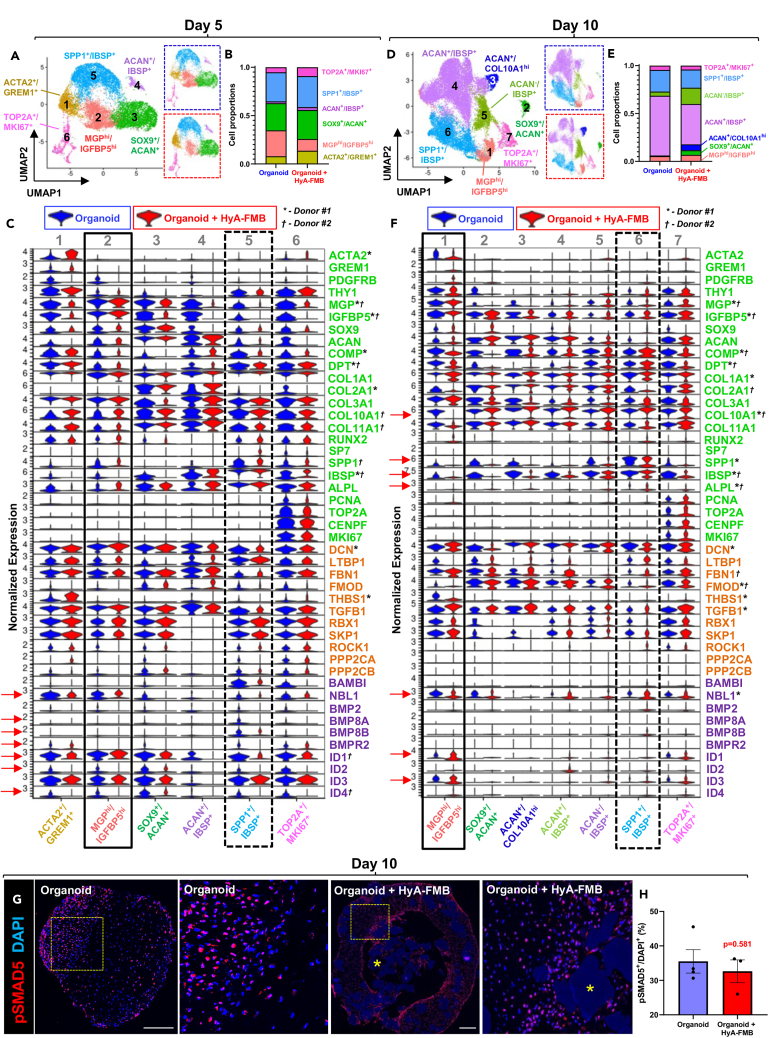
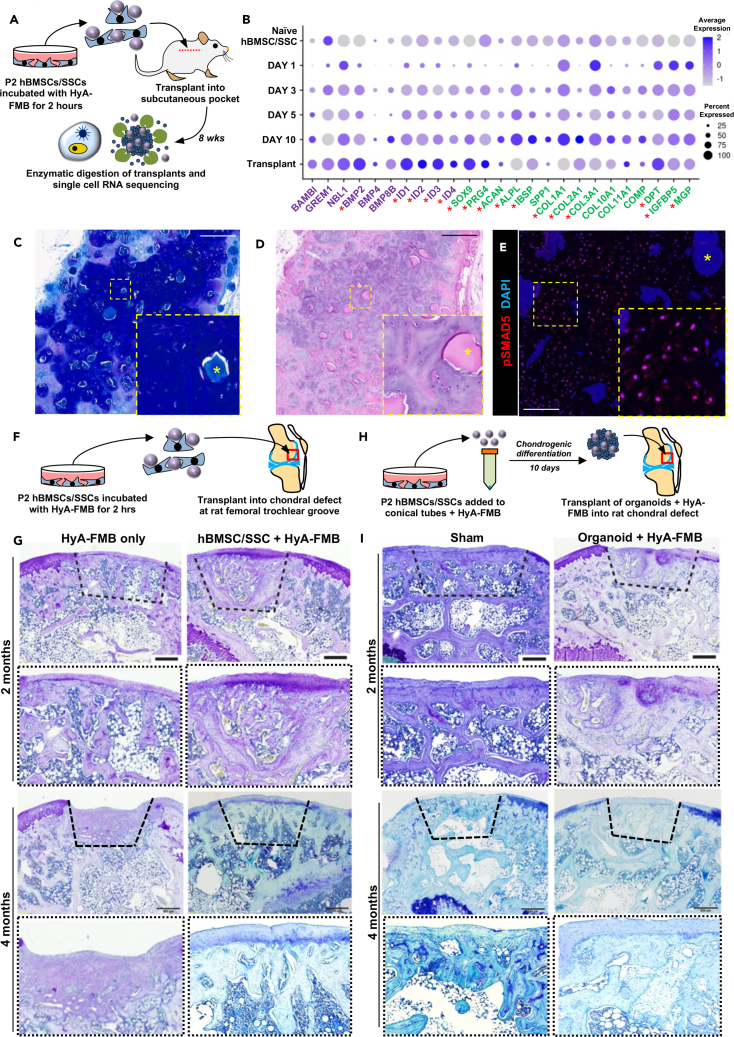
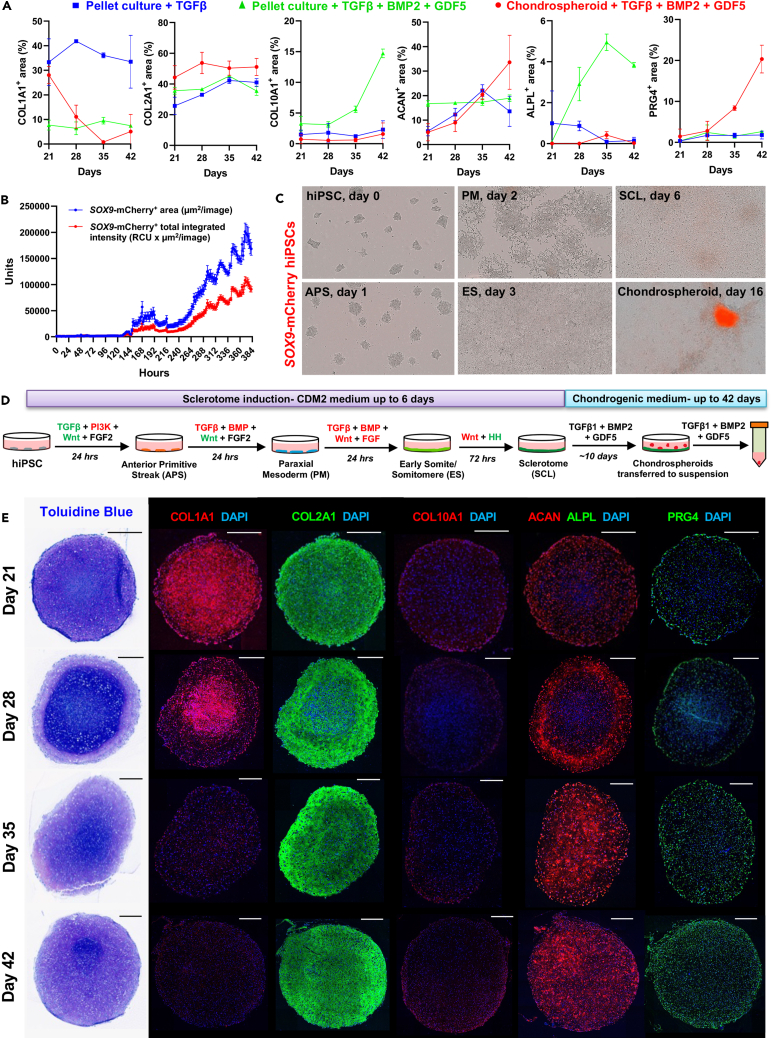
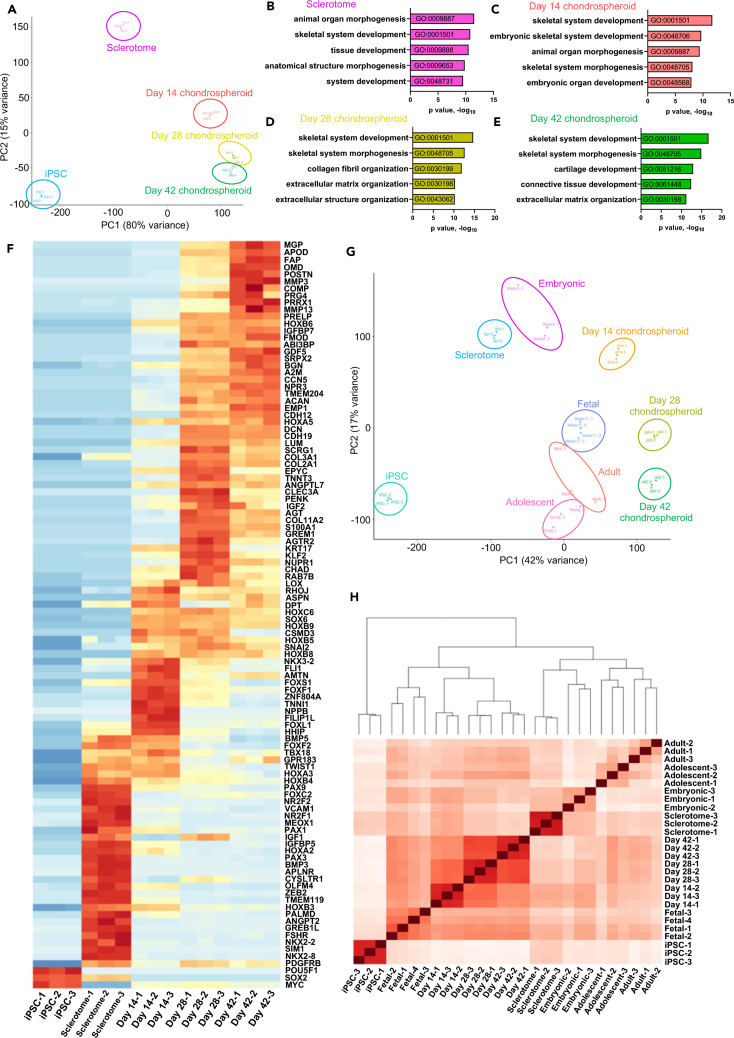
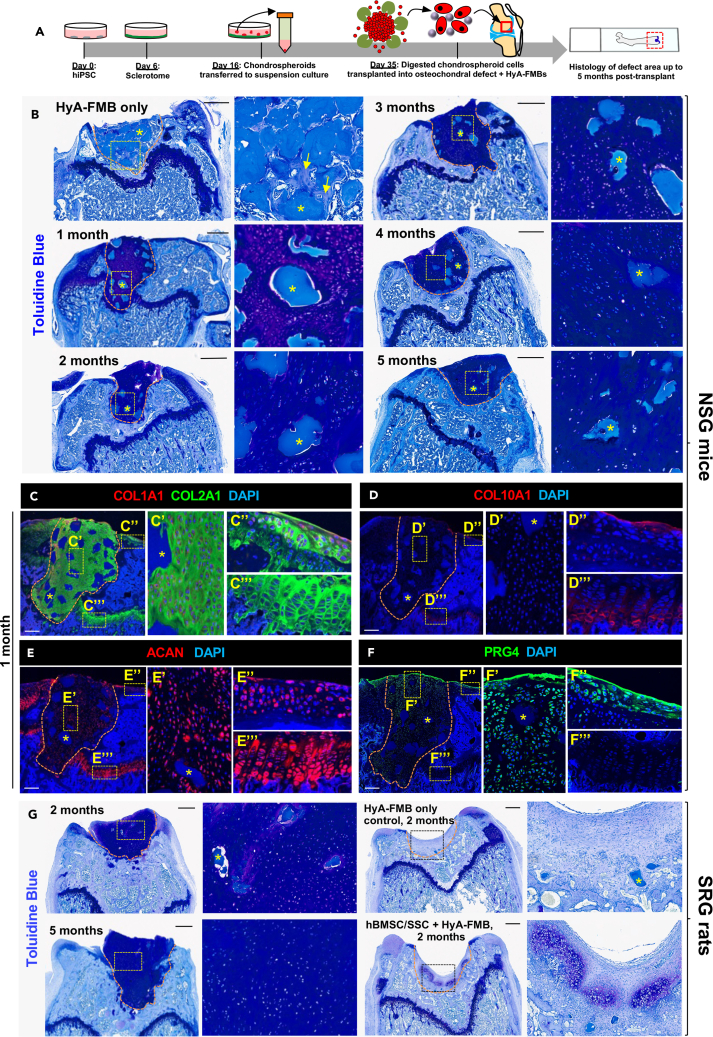
Stem cell therapies for degenerative cartilage disease are limited by an incomplete understanding of hyaline cartilage formation and maintenance. Human bone marrow stromal cells/skeletal stem cells (hBMSCs/SSCs) produce stable hyaline cartilage when attached to hyaluronic acid-coated fibrin microbeads (HyA-FMBs), yet the mechanism remains unclear. In vitro, hBMSC/SSC/HyA-FMB organoids exhibited reduced BMP signaling early in chondrogenic differentiation, followed by restoration of BMP signaling in chondrogenic IGFBP5 + /MGP + cells. Subsequently, human-induced pluripotent stem cell (hiPSC)-derived sclerotome cells were established (BMP inhibition) and then treated with transforming growth factor β (TGF-β) -/+ BMP2 and growth differentiation factor 5 (GDF5) (BMP signaling activation). TGF-β alone elicited a weak chondrogenic response, but TGF-β/BMP2/GDF5 led to delamination of SOX9 + aggregates (chondrospheroids) with high expression of COL2A1, ACAN, and PRG4 and minimal expression of COL10A1 and ALP in vitro. While transplanted hBMSCs/SSCs/HyA-FMBs did not heal articular cartilage defects in immunocompromised rodents, chondrospheroid-derived cells/HyA-FMBs formed non-hypertrophic cartilage that persisted until at least 5 months in vivo.

Keywords: Physiology; cell biology; molecular biology; stem cells research.


Conflict of interest statement

P.G.R., S.A.K., R.G., A.H.-L., and J.F. have a patent on the hyaluronic-acid-coated fibrin microbeads (US Patent #1094021).

Figures

None
Graphical abstract
Figure 1
Figure 1
HyA-FMBs promote early expression of non-collagenous proteins (A) hBMSCs/SSCs were attached to HyA-FMBs and differentiated in chondrogenic medium, forming HyA-FMB organoids, which were digested at days 1, 3, 5, and 10 for scRNA-seq analyses in (C)–(H). (B) Toluidine blue staining of control and HyA-FMB organoids at days 1, 3, 5, and 10 of chondrogenic differentiation. Scale bars, 300 μm. Asterisks (∗) indicate HyA-FMBs. (C–F) Gene ontology analysis showing enriched pathways in HyA-FMB organoids compared with controls at days 1 (C), 3 (D), 5 (E), and 10 (F) of chondrogenic differentiation. Analyses performed using gProfiler’s driver GO pathway analysis from global differential gene expression (logfc>0.25, p < 0.05) between control and HyA-FMB organoids. Arrows indicate pathways of interest. (G and H) Gene expression from days 0, 1, 3, 5, and 10 of chondrogenic differentiation. These data represent integrated data within control (G) and HyA-FMB (H) datasets for an overview of gene expression over time in each condition. Boxes indicate key trends in genes of interest (see also Figure S1).
Figure 2
Figure 2
HyA-FMBs suppress BMP signaling early in chondrogenic differentiation (A–D) Global expression analyses from scRNA-seq of control (blue) and HyA-FMB (red) organoids at day 1 (A and B) and day 3 (C and D) of chondrogenic differentiation. Control and HyA-FMB datasets at each time point were normalized and integrated using Seurat. Cluster analyses at each time point are provided in Figures S2A–S2F. (A, C) Violin plots depict expression of genes associated with TGFβ signaling (orange), BMP signaling (purple), and chondro-osteogenesis (green). Statistical significance (logfc>0.25, p < 0.05) is shown with an asterisk (∗) for donor #1 and dagger (†) for donor #2. (B and D) Feature plots show genes of interest. (E, G, I, and K) Immunofluorescence analyses in day 3 control and HyA-FMB organoids. High-magnification insets shown to the right of their corresponding images. Nuclei counterstained with DAPI. Scale bars, 200 μm. Asterisks (∗) indicate HyA-FMBs. (F, H, J, and L) Area quantification of protein expression in day 3 control and HyA-FMB organoids. Each dot represents a biological replicate. Data are mean ± SEM; ∗p < 0.05, unpaired two-tailed t test (see also Figures S1 and S2).
Figure 3
Figure 3
HyA-FMBs restore BMP signaling in MGP/IGFBP5-enriched chondrogenic cells (A–F) Cluster analyses from scRNA-seq of control (blue) and HyA-FMB (red) organoids at day 5 (A–C) and day 10 (D–F) of chondrogenic differentiation. Control and HyA-FMB datasets at each time point were normalized and integrated using Seurat. Marker genes for each cluster are listed in the corresponding color. Data are shown from donor #1. (A, D) UMAP representation of integrated control and HyA-FMB datasets with annotated clusters. Split UMAPs are shown on the right for control organoids (blue dashed outline) and HyA-FMB organoids (red dashed outline). (B and E) Bar chart depicting proportion of cell clusters in control and HyA-FMB datasets. (C and F) Violin plots depicting gene expression split by experimental condition (blue violin plots are control organoids, red violin plots are HyA-FMB organoids) from integrated datasets at day 5 (C) and day 10 (F) of chondrogenic differentiation. Genes associated with TGF-β signaling (orange), BMP signaling (purple), and chondro-osteogenesis (green) are shown. Arrows depict notable gene expression differences (logfc>0.25, p < 0.05) between MGPhi/IGFBP5hi cluster (solid black box) and SPP1+/IBSP+ cluster (dashed black box). Global significance (logfc>0.25, p < 0.05) between control and HyA-FMB organoids is shown with an asterisk (∗) for donor #1 and dagger (†) for donor #2. (G) Immunofluorescence of phospho-Smad5 (pSMAD5) in day 10 organoids. High-magnification insets shown to the right of their corresponding images. Nuclei counterstained with DAPI. Scale bars, 300 μm. Asterisks (∗) indicate HyA-FMBs. (H) Quantification of pSMAD5+ nuclei in day 10 organoids. Each dot represents a biological replicate. Data are mean ± SEM (see also Figure S2).
Figure 4
Figure 4
BMP signaling is increased in stable, hyaline-like cartilage upon ectopic transplantation (A) hBMSCs/SSCs were incubated with HyA-FMBs for 2 h and transplanted ectopically into NSG mice, followed by digestion of transplanted tissue 8 weeks post-transplant and scRNA-seq analysis shown in (B). (B) Dot plot demonstrating global gene expression of integrated in vitro HyA-FMB datasets (from days 0, 1, 3, 5, and 10 of chondrogenic differentiation) and in vivo transplant of hBMSCs/SSCs attached to HyA-FMBs analyzed 8 weeks post-transplant. Genes associated with BMP signaling (purple) and chondro-osteogenesis (green) are shown. Asterisks indicate differentially expressed genes (logfc>0.35) in transplanted hBMSCs/SSCs attached to HyA-FMBs, compared with all in vitro HyA-FMB datasets. (C and D) Toluidine blue (C) and H&E (D) staining of ectopic transplant of hBMSCs/SSCs attached to HyA-FMBs at 8 weeks post-transplant with high-magnification insets. Scale bars, 500 μm. Asterisks (∗) indicate HyA-FMBs. (E) Immunofluorescence analysis of pSMAD5 (red) at 8 weeks post-transplant with high-magnification insets. Nuclei counterstained with DAPI (blue). Scale bar, 100 μm. Asterisks (∗) indicate HyA-FMBs. (F) hBMSCs/SSCs were incubated with HyA-FMBs for 2 h and transplanted into a 2-mm defect at the femoral trochlear groove in SRG rats, followed by histology analyses in (G). (G) Toluidine blue staining of defect areas (dashed lines) from chondral transplants at 2 and 4 months post-transplant in SRG rats. Scale bars, 500 μm. High-magnification images shown below each image. (H) hBMSCs/SSCs were cultured with HyA-FMBs in chondrogenic medium for 10 days and transplanted into a 2-mm defect at the femoral trochlear groove in SRG rats, followed by histology analyses in (I). (I) Toluidine blue staining of defect areas (dashed lines) from organoid chondral transplants at 2 and 4 months post-transplant in SRG rats. Scale bars, 500 μm. High-magnification images shown below each image (see also Figure S3; Table S1).
Figure 5
Figure 5
BMP activation in SOX9+-purified early chondrogenic cells promotes stable chondrogenesis in vitro (A) Quantification of protein expression in tissues derived from three chondrogenic differentiation strategies: iPSC-derived sclerotome cells were pelleted in chondrogenic medium supplemented with TGF-β (blue) or TGF-β, BMP2, and GDF5 (green) or formed chondrospheroids that were cultured in chondrogenic medium supplemented with TGF-β, BMP2, and GDF5 (red). n = 2–4 replicates. Data are mean ± SD. Confocal images associated with these area quantifications are shown in Figures 5E, S4E, and S5A. (B) SOX9-mCherry culture area (blue) and fluorescence intensity (red) of SOX9-mCherry hiPSCs across 16 days of differentiation on monolayer cultures from the protocol depicted in Figure 5D, measured by Incucyte analysis software. Sum of three independent experiments. (C) Representative brightfield and mCherry fluorescence images depicting cell morphology across differentiation, and appearance of SOX9-mCherrybright chondrospheroid by 16 days of adherent culture. Abbreviation names are shown in Figure 5D. (D) Schematic of sclerotome and chondrogenic differentiation strategy from hiPSCs: pathway activators (green), inhibitors (red), and recombinant growth factors (black) were added across 6 days of adherent culture, followed by chondrogenic induction to produce chondrospheroids. (E) Toluidine blue staining and immunofluorescence analyses of chondrospheroids across time. Nuclei counterstained with DAPI. Scale bars, 300 μm (see also Figures S4 and S5).
Figure 6
Figure 6
Chondrospheroid transcriptomes reveal a fetal-like chondrogenic identity (A) PCA of hiPSC, sclerotome, and chondrospheroid datasets. Each dot represents a technical replicate. (B–E) Gene ontology analysis representing top five pathways from sclerotome (B), day 14 (C), day 28 (D), and day 42 (E) chondrospheroids. (F) Heatmap depicting differential gene expression: top 100 differentially expressed genes from each dataset were assessed against GO pathways listed in (B)–(E), reducing the list to 103 relevant genes. (G) PCA of hiPSC, sclerotome, and chondrospheroid datasets, which were batch-corrected and normalized using ComBat-seq to previously published datasets, which included 5- to 6-week-old embryonic, 17-week-old fetal, adolescent, and adult primary human chondrocytes. (H) Hierarchical clustering analysis of sclerotome, chondrospheroid, and primary human chondrocyte populations (see also Figure S6; Table S2. Excel file containing additional data too large to fit in a PDF, related to Figure 6G, H, Table S3. Excel file containing additional data too large to fit in a PDF, related to Figure 6G, H, Table S4. Excel file containing additional data too large to fit in a PDF, related to Figure 6G, H).
Figure 7
Figure 7
Chondral transplantation of chondrospheroid cells attached to HyA-FMBs yields stable chondrogenesis (A) hiPSC-derived sclerotome was differentiated to chondrospheroids, which were digested at day 35, incubated with HyA-FMBs for 2 h, and transplanted into a femoral trochlear groove defect in NSG mice (B–F) and SRG rats (G). (B) Toluidine blue staining of defect areas from transplanted day 35 chondrospheroids attached to HyA-FMBs at 1–5 months post-transplant in NSG mice. High-magnification insets shown to the right of their corresponding images. Arrows depicting the formation of bone in control transplants at 1 month. Scale bars, 500 μm. (C–F) Immunofluorescence analyses of femoral defects from NSG mice 1 month post-transplant. High-magnification insets depicting transplanted cells, surface articular cartilage, and growth plate cartilage shown to the right of their corresponding images. Nuclei counterstained with DAPI. Scale bars, 200 μm. (G) Toluidine blue staining of defect areas from transplanted day 35 chondrospheroids attached to HyA-FMBs at 2 and 5 months post-transplant in SRG rats (left). Right images depict control transplants, including HyA-FMBs only and hBMSCs/SSCs attached to HyA-FMBs at 2 months. High-magnification insets shown to the right of their corresponding images. Scale bars, 500 μm. (B–G) Asterisks (∗) indicate HyA-FMBs. Orange dashed lines indicate area of transplanted tissue (see also Figures S7 and S8).

References

    1. Boer C.G., Hatzikotoulas K., Southam L., Stefánsdóttir L., Zhang Y., Coutinho de Almeida R., Wu T.T., Zheng J., Hartley A., Teder-Laving M., et al. Deciphering osteoarthritis genetics across 826,690 individuals from 9 populations. Cell. 2021;184:4784–4818.e17. doi: 10.1016/j.cell.2021.07.038. - DOI - PMC - PubMed
    1. Bayliss L.E., Culliford D., Monk A.P., Glyn-Jones S., Prieto-Alhambra D., Judge A., Cooper C., Carr A.J., Arden N.K., Beard D.J., Price A.J. The effect of patient age at intervention on risk of implant revision after total replacement of the hip or knee: a population-based cohort study. Lancet. 2017;389:1424–1430. doi: 10.1016/S0140-6736(17)30059-4. - DOI - PMC - PubMed
    1. Carey J.L. Fibrocartilage following microfracture is not as robust as native articular cartilage. J. Bone Joint Surg. 2012;94:10–11. doi: 10.2106/JBJS.L.00319. - DOI - PubMed
    1. Ha C.W., Park Y.B., Kim S.H., Lee H.J. Intra-articular Mesenchymal Stem Cells in Osteoarthritis of the Knee: A Systematic Review of Clinical Outcomes and Evidence of Cartilage Repair. Arthroscopy. 2019;35:277–288.e2. doi: 10.1016/j.arthro.2018.07.028. - DOI - PubMed
    1. NICE Autologous chondrocyte implantation for repairing symptomatic articular cartilage defects of the knee. 2017. https://www.nice.org.uk/guidance/ta477/chapter/1-Recommendations