Review
. 2024 Aug 27;14(37):26995-27041.
doi: 10.1039/d4ra03714f. eCollection 2024 Aug 22.

Advancements in MAX phase materials: structure, properties, and novel applications

Affiliations
Review

Advancements in MAX phase materials: structure, properties, and novel applications

Md Shahinoor Alam et al. RSC Adv. .

Abstract

The MAX phase represents a diverse class of nanolaminate materials with intriguing properties that have received incredible global research attention because they bridge the divide separating metals and ceramics. Despite the numerous potential applications of MAX phases, their complex structure leads to a scarcity of readily accessible pure MAX phases. As a result, in-depth research on synthesis methods, characteristics, and structure is frequently needed for appropriate application. This review provides a comprehensive understanding of the recent advancements and growth in MAX phases, focusing on their complex crystal structures, unique mechanical, thermal, electrical, crack healing, corrosion-resistant properties, as well as their synthesis methods and applications. The structure of MAX phases including single metal MAX, i-MAX and o-MAX was discussed. Moreover, recent advancements in understanding MAX phase behaviour under extreme conditions and their potential novel applications across various fields, including high-temperature coatings, energy storage, and electrical and thermal conductors, biomedical, nanocomposites, etc. were discussed. Moreover, the synthesis techniques, ranging from bottom-up to top-down methods are scrutinized for their efficacy in tailoring MAX phase properties. Furthermore, the review explores the challenges and opportunities associated with optimizing MAX phase materials for specific applications, such as enhancing their oxidation resistance, tuning their mechanical properties, and exploring their functionality in emerging technologies. Overall, this review aims to provide researchers and engineers with a comprehensive understanding of MAX phase materials and inspire further exploration into their versatile applications in materials science and engineering.


Conflict of interest statement

There are no conflicts to declare.

Figures

Fig. 1
Fig. 1. (a) The periodic table displays M-elements highlighted in blue, A-elements in orange, and X-elements in grey. In ternary MAX phases, the shading is intensified, whereas in those present in both ternary and post-ternary phases, the shading is lighter. Elements contributing to solid solutions or chemical order at M-, A-, or X-sites are represented by purple circles or dark blue triangles, respectively. (b) Conventional MAX phases possessing a general Mn+1AXn configuration crystallize within the P63/mmc symmetry group. (c) Intergrown MAX phases, exhibiting alternating Mn+1Xn layer thicknesses, crystallize in the Rm space group. (d) Phases featuring dual A-layers can crystallize in one of three space groups: P63/mmc, Rm, or Pm1. (Reproduced from ref. with permission from Elsevier, copyright 2023).
Fig. 2
Fig. 2. (a) Unit cell and (b) crystal structure of MAX-phases. (Reproduced from ref. with permission from American Physical Society, copyright 2004).
Fig. 3
Fig. 3. (a) o-MAX phase microstructure STEM analyses of (MoTi)n+1AlCn (n = 2 or 3) MAX phases, with HAADF-STEM images and EDS maps. HRSTEM of Mo2ScAlC2 and Mo2Ti2AlC3 o-MAX. Reprinted with permission and microstructures of traditional and i-MAX phases are depicted, featuring schematic illustrations and HAADF-STEM images. Images (b–d) show (V2/3Zr1/3)2AlC i-MAX phase viewed along [010], [110], and [100] zone axes. Reprinted with permission.
Fig. 4
Fig. 4. (a) Schematic depiction of the conventional monoclinic C2/c unit cell for (Mo2/3RE1/3)2AlC, with specific interatomic bonds highlighted by red arrows. (b) High-resolution STEM images of (Mo2/3Dy1/3)2AlC single crystals along [010] and [110] zone axes, accompanied by corresponding schematics for the C2/c monoclinic structure. Inset exhibits the line-profile of Z contrast along the red dashed line, and the area with a stacking fault is indicated by red arrows. (Reproduced from ref. and with permission from American Physical Society, copyright 2019).
Fig. 5
Fig. 5. Overview of MAX-phase properties.
Fig. 6
Fig. 6. MAX phases electrical and thermal characteristics: (a) Ti2AlC's electronic conductivity and resistivity as a function of temperature. (b) Thermal conductivity, heat capacity, and diffusivity variations in Ti2AlC across temperatures. Mechanical properties of MAX phases: graphs illustrating deformation characteristics under flexural and compressive stress of Ti2AlC from ambient conditions to increased temperatures are shown. (c and d). Mechanical behaviours of MAX phases (e and f). (Reproduced from ref. with permission from Elsevier, copyright 2013). (Reproduced from ref. with permission from American Ceramic Society, copyright 2012).
Fig. 7
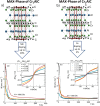
Fig. 7. Behavior of MAX phases under irradiation: (a) micro strain and phase component shifts in Ti3AlC2 upon C4+ ion irradiation at room temperature across various fluences. (b) Proton irradiation induced defects cause lattice strain in MAX phase materials. (c) Phase transformation sequences and recovery in Ti3AlC2 post-irradiation at high temperature. (d) Ti3AlC2 has low defect recovery rate, causing the irradiated surface to exfoliate at low irradiation temperature. (Reproduced from ref. with permission from Elsevier, copyright 2020). (Reproduced from ref. with permission from Elsevier, copyright 2019).
Fig. 8
Fig. 8. MAX phases' oxidation behavior: (a and c) increase in weight per unit surface area over time due to oxidation for fine-grained (FG) and coarse-grained (CG) Ti2AlC MAX phases at elevated temperatures. (b and d) Fitting of corresponding oxidation kinetics. (Reproduced from ref. with permission from Elsevier, copyright 2020). (e and f) SEM cross-section views of the oxide layer on Ti3AlC2 MAX phase oxidized for 24 h (e) and 500 h (f) at 800 °C. (Reproduced from ref. with permission from John Wiley and Sons, copyright 2019).
Fig. 9
Fig. 9. Images depict the fracture and crack healing process in Ti2AlC from the 1st to the 8th cycle. (a) Shows the first crack and its healed state. (b) Illustrates the second crack and its healed state. (c) Displays the crack path after seven healing cycles and subsequent fracture, with red arrows pointing to the remnants of the crack. (d) Presents an SEM image of the healed-damage zone captured using electron backscatter diffraction. (Reproduced from ref. with permission from Springer Nature, copyright 2016).
Fig. 10
Fig. 10. Magnetization data for the Mn (a) and Fe (b) substituted samples, (Cr1−xMnx)2AlC and (Cr1−xFex)2AlC, with nominal compositions. (Reproduced from ref. with permission from The Royal Society of Chemistry, copyright 2017).
Fig. 11
Fig. 11. Materials exposed for 1000 hours at 500 °C to oxygen-deficient, static LBE: (a) solid solution in the MAX phase (Nb0.85, Zr0.15)4AlC3, (b) stainless steel 316L SA. Materials subjected for 1000 hours at 500 °C to fast-slowing, oxygen-deficient LBE: (c) (Nb0.85, Zr0.15)4AlC3 (d) 316L SA stainless steel; 4AlC3 MAX phase solid solution. (Reprinted from ref. with permission from Elsevier, copyright 2021).
Fig. 12
Fig. 12. An illustration of the methods used to synthesize MAX phases presented in a flowchart format.
Fig. 13
Fig. 13. The overview of multi-applications of MAX-phases.
Fig. 14
Fig. 14. Examples of MAX phases applications: (a–c) SEM images showcasing Al2O3–Ti2AlC composite before and after 1 hour oxidation at 1000 °C in air. (a) Crack initiation prior to oxidation, (b) post-oxidation with visible cracks, and (c) a polished surface revealing filled cracks. (Reproduced from ref. with permission from John Wiley and Sons, copyright 2018). (d) Schematic illustrating microstructural evolution during Ti2AlC oxidation. (e) Creating a membrane by combining Ti2AlN MAX phase with cellulose acetate for the removal of dye, protein, and lead ions. (Reproduced from ref. with permission from Elsevier, copyright 2022).
Fig. 15
Fig. 15. Oxidation mechanisms of Cr2AlC MAX phase coatings at 900–1100 °C. (Reproduced from ref. with permission from Elsevier, copyright 2020).
Fig. 16
Fig. 16. The cross-sectional images and schematics representation of the Ag doped Cr2AlC nanocomposite coatings. (Reproduced from ref. with permission from Elsevier, copyright 2024).
Fig. 17
Fig. 17. Schematic representation illustrating the synthesis process of low-cost Ti3AlC2–Ti2AlC dual MAX phase, highlighting the use of economical raw materials and innovative compositions for achieving high-electrical conductivity. (Reproduced from ref. with permission from Elsevier, copyright 2023). (Reproduced from ref. with permission from Elsevier, copyright 2019).
Fig. 18
Fig. 18. Schematic representation of the fuel production process using MAX-phase materials. (Reproduced from ref. with permission from Elsevier, copyright 2020).
Fig. 19
Fig. 19. (a) Images of samples before and after corrosion in solar salt at various intervals: as-sintered, and after 24, 168, 336, and 672 h. (b) Micrograph of corroded sample after 24 h with corresponding EDS elemental maps of the rectangular zone. (c) Hemispherical reflectance spectra of MAX samples in the 0.3–16 μm range, and (d) detail of the solar spectrum range. Reprinted with permission. (Reproduced from ref. with permission from John Wiley and Sons, copyright 2017).
Fig. 20
Fig. 20. The prevailing method for producing MXene currently. (Reproduced from ref. with permission from MDPI AG, copyright 2022).
Fig. 21
Fig. 21. Types of MAX phases used in catalytic degradation reactions and processes based on C–H and C–O activation. (Reproduced from ref. with permission from The Royal society of Chemistry, copyright 2021).
Fig. 22
Fig. 22. Bio-medical applications for bone regeneration by MAX-phase composites. (Reproduced from ref. with permission from Elsevier, copyright 2023).
Fig. 23
Fig. 23. Various energy storing application using MAX phases derivatives (MXene).
Fig. 24
Fig. 24. Schematic of MAX-phase integration with Glassy Carbon Electrode (GCE) for enhanced performance as a sensor. (Reproduced from ref. with permission from Elsevier, copyright 2022).
Fig. 25
Fig. 25. Formation of advanced nanocomposites from MAX-phase materials.
Fig. 26
Fig. 26. Application of MAX-phase materials as functional materials.

References

    1. Venkateshalu S. Grace A. N. MXenes—A new class of 2D layered materials: Synthesis, properties, applications as supercapacitor electrode and beyond. Appl. Mater. Today. 2020;18:100509.
    1. Zhao C. Zhang Y. Nie K. Yi L. Li B. Yuan Y. Liu Z. Recent advances in design and engineering of MXene-based heterostructures for sustainable energy conversion. Appl. Mater. Today. 2023;32:101841.
    1. Aleksanyan A. G. Dolukhanyan S. K. Mayilyan D. G. Muradyan G. N. Ter-Galstyan O. P. Mnatsakanyan N. L. Formation of Ti2AlNx MAX phase by “Hydride Cycle” and SHS methods. Ceram. Int. 2023;49:24229–24234.
    1. Alam S. Chowdhury M. A. Shahid A. Alam R. Rahim A. Synthesis of emerging two-dimensional (2D) materials–Advances, challenges and prospects. FlatChem. 2021;30:100305.
    1. Barsoum M. W. The MN+1AXN phases: A new class of solids: Thermodynamically stable nanolaminates. Prog. Solid State Chem. 2000;28:201–281.

LinkOut - more resources