. 2024 Jul:235:31344-31382.

Multi-Source Conformal Inference Under Distribution Shift

Affiliations

Multi-Source Conformal Inference Under Distribution Shift

Yi Liu et al. Proc Mach Learn Res. 2024 Jul.

Abstract

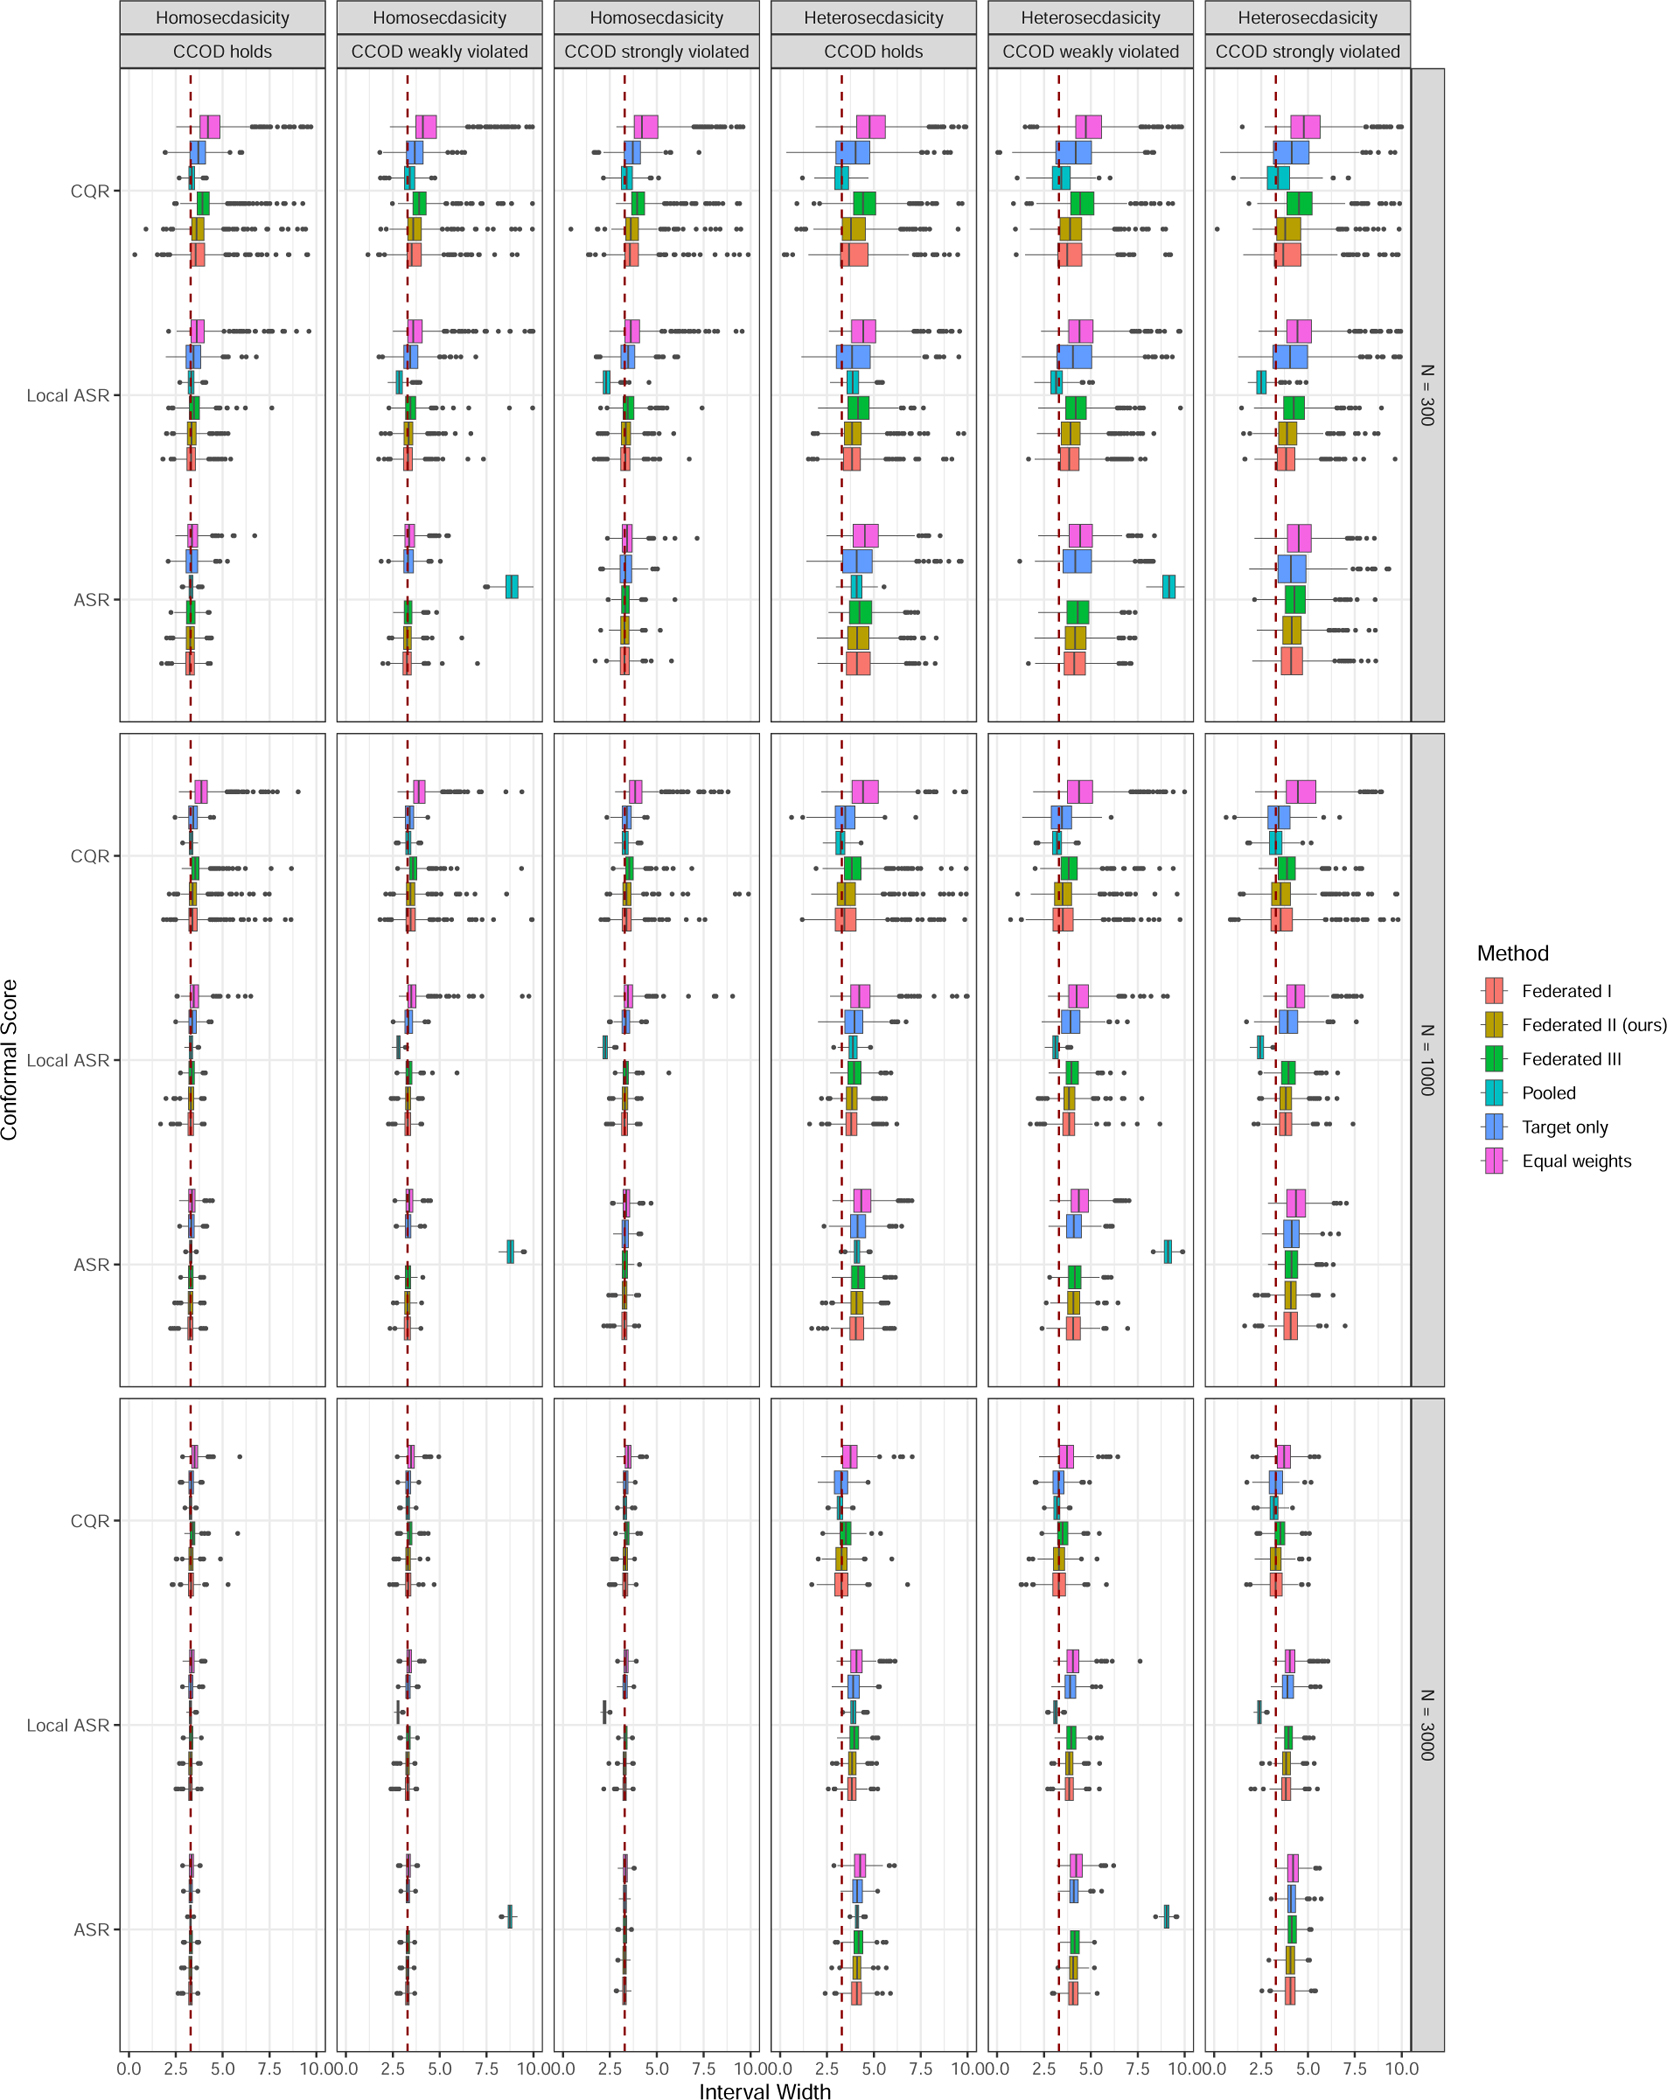
Recent years have experienced increasing utilization of complex machine learning models across multiple sources of data to inform more generalizable decision-making. However, distribution shifts across data sources and privacy concerns related to sharing individual-level data, coupled with a lack of uncertainty quantification from machine learning predictions, make it challenging to achieve valid inferences in multi-source environments. In this paper, we consider the problem of obtaining distribution-free prediction intervals for a target population, leveraging multiple potentially biased data sources. We derive the efficient influence functions for the quantiles of unobserved outcomes in the target and source populations, and show that one can incorporate machine learning prediction algorithms in the estimation of nuisance functions while still achieving parametric rates of convergence to nominal coverage probabilities. Moreover, when conditional outcome invariance is violated, we propose a data-adaptive strategy to upweight informative data sources for efficiency gain and downweight non-informative data sources for bias reduction. We highlight the robustness and efficiency of our proposals for a variety of conformal scores and data-generating mechanisms via extensive synthetic experiments. Hospital length of stay prediction intervals for pediatric patients undergoing a high-risk cardiac surgical procedure between 2016-2022 in the U.S. illustrate the utility of our methodology.


Figures

Figure 4:
Figure 4:
Boxplots of prediction interval widths
Figure 5:
Figure 5:
Boxplots of coverage probability, under homogeneous covariate distributions
Figure 6:
Figure 6:
Boxplots of prediction interval width, under homogeneous covariate distributions
Figure 7:
Figure 7:
Boxplots of coverage probability, under weakly heterogeneous covariate distributions
Figure 8:
Figure 8:
Boxplots of prediction interval width, under weakly heterogeneous covariate distributions
Figure 9:
Figure 9:
Boxplots of coverage probability, under strongly heterogeneous covariate distributions
Figure 10:
Figure 10:
Boxplots of prediction interval width, under strongly heterogeneous covariate distributions
Figure 11:
Figure 11:
Local coverages, under CCOD is strongly violated and strongly heterogeneous covariate distributions and nk=3000
Figure 12:
Figure 12:
Weights vs. χk2 values, using nk=3000 data under heteroscedasticity. The green points are by Federated I, the orange points are by Federated II (ours), the blue points are by Federated III, and the red dashed lines are for a reference line weights = 0.2.
Figure 13:
Figure 13:
Comparison of coverage probabilities and average interval width when modifying the propensity score of observing the outcome between (0.4,0.6) (panel (a)) and (0.1,0.9) (panel (b)).
Figure 1:
Figure 1:
Illustration of the proposed robust algorithm for multi-source conformal prediction. Each θ^ represented by a different color is the estimated (1-α)-quantile of the conformal score using data from the site with the same color. m^0 (in red) is the estimated CDF of the conformal score using only the target site data. The other m^k(k1) are the estimated CDFs of the conformal scores from source sites, and ω^k,0(k1) is the density ratio of site k versus the target site. The federated r^fed,0 is a weighted average of the site-specific quantiles, with weights given by w^. The prediction interval C^α(X) is the set of outcomes y such that the corresponding conformal scores S(x,y) in the target are below the threshold r^fed,0.
Figure 2:
Figure 2:
A: Marginal coverage, B: Prediction interval width, C: Conditional coverage, and D: Weights for our proposed federated method compared to the pooled sample and target only methods, where sample size nk=3000, k=0,,4 under strongly heterogeneous covariate distributions and strong violation of CCOD.
Figure 3:
Figure 3:
Each panel represents the prediction intervals for hospital LOS for a randomly selected individual following a Norwood procedure across α={0.1,0.2,0.3,0.4,0.5} and conformal score {ASR,localASR,CQR} for A: a patient in South, B: a patient in Midwest, C: a patient in West, D: a patient in Northeast.

References

    1. Barber RF, Candes EJ, Ramdas A, and Tibshirani RJ Conformal prediction beyond exchangeability. The Annals of Statistics, 51(2):816–845, 2023.
    1. Bickel P, Klaassen C, Ritov Y, and Wellner J Efficient and adaptive estimation for semiparametric models. Johns Hopkins University Press Baltimore, 1993.
    1. Cai TT, Namkoong H, Yadlowsky S, et al. Diagnosing model performance under distribution shift. arXiv preprint arXiv:2303.02011, 2023.
    1. Duan R, Boland MR, Liu Z, Liu Y, Chang HH, Xu H, Chu H, Schmid CH, Forrest CB, Holmes JH, et al. Learning from electronic health records across multiple sites: A communication-efficient and privacy-preserving distributed algorithm. Journal of the American Medical Informatics Association, 27(3):376–385, 2020a. - PMC - PubMed
    1. Duan R, Ning Y, Wang S, Lindsay BG, Carroll RJ, and Chen Y A fast score test for generalized mixture models. Biometrics, 76(3):811–820, 2020b. - PMC - PubMed

LinkOut - more resources