. 2024 Sep 4;14(9):1699-1716.
doi: 10.1158/2159-8290.CD-22-0649.

MYC Induces Oncogenic Stress through RNA Decay and Ribonucleotide Catabolism in Breast Cancer

Affiliations

MYC Induces Oncogenic Stress through RNA Decay and Ribonucleotide Catabolism in Breast Cancer

Jitendra K Meena et al. Cancer Discov. .

Abstract

Upregulation of MYC is a hallmark of cancer, wherein MYC drives oncogenic gene expression and elevates total RNA synthesis across cancer cell transcriptomes. Although this transcriptional anabolism fuels cancer growth and survival, the consequences and metabolic stresses induced by excess cellular RNA are poorly understood. Herein, we discover that RNA degradation and downstream ribonucleotide catabolism is a novel mechanism of MYC-induced cancer cell death. Combining genetics and metabolomics, we find that MYC increases RNA decay through the cytoplasmic exosome, resulting in the accumulation of cytotoxic RNA catabolites and reactive oxygen species. Notably, tumor-derived exosome mutations abrogate MYC-induced cell death, suggesting excess RNA decay may be toxic to human cancers. In agreement, purine salvage acts as a compensatory pathway that mitigates MYC-induced ribonucleotide catabolism, and inhibitors of purine salvage impair MYC+ tumor progression. Together, these data suggest that MYC-induced RNA decay is an oncogenic stress that can be exploited therapeutically. Significance: MYC is the most common oncogenic driver of poor-prognosis cancers but has been recalcitrant to therapeutic inhibition. We discovered a new vulnerability in MYC+ cancer where MYC induces cell death through excess RNA decay. Therapeutics that exacerbate downstream ribonucleotide catabolism provide a therapeutically tractable approach to TNBC (Triple-negative Breast Cancer) and other MYC-driven cancers.


Conflict of interest statement

J.K. Meena reports grants from Susan G. Komen during the conduct of the study; personal fees from Affirmativ Diagnostics DBA ADx Health outside the submitted work. E.A. Bowling reports grants from NIH/NCI during the conduct of the study. K. Eagle reports personal fees from Flare Therapeutics and personal fees from Dana Farber Cancer Institute outside the submitted work. A.D. Yang reports grants from CPRIT and NIH/NCI during the conduct of the study. S.J. Kurley reports grants from CDMRP and The Helis Foundation during the conduct of the study; personal fees from Optum Genomics (UnitedHealth Group) and personal fees from Castle Biosciences outside the submitted work. C.M. Olson reports personal fees from Marlinspike Therapeutics outside the submitted work. K.L. Meerbrey reports personal fees from Marlinspike Therapeutics outside the submitted work. A. Sreekumar reports grants from Agilent Foundation, non-financial support from Sri Sathya Sai Institute for Higher Learning, India, and personal fees from Karkinos Health Care Pvt. Ltd., India, outside the submitted work. D. Rejman reports grants from The Ministry of Education, Youth and Sports during the conduct of the study. C.Y. Lin reports other support from Kronos Bio outside the submitted work. M.C. Pillon reports grants from Cancer Prevention & Research Institute of Texas, National Institute of Environmental Health Sciences, and National Institute of General Medical Sciences during the conduct of the study. T.F. Westbrook reports grants, personal fees, and other support from Marlinspike Therapeutics outside the submitted work. No disclosures were reported by the other authors.

Figures
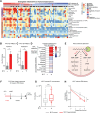
Figure 1.
Figure 1.
Oncogenic MYC stimulates widespread RNA decay and accumulation of RNA catabolites. A, MYC-hyperactivated breast tumors exhibit elevated accumulation of RNA degradation–related nucleotide catabolites. Primary human breast cancers (n = 61) and matched normal adjacent tissue were previously profiled via untargeted metabolomics and microarray (32). Herein, tumors were stratified by MYC hyperactivation gene signatures (denoted with two independently derived MYC hyperactivation gene signatures shown on top bars). Shown is a heatmap of nucleotide metabolites. Metabolites that are exclusively derived from RNA/DNA breakdown (“catabolism”) are shown in top rows; metabolites that can result from synthetic or catabolic pathways are shown in bottom rows. Heatmap data displayed as fold-change of metabolite abundance compared to the average of matched adjacent normal tissue. MYC-signature scores were derived from tumor gene expression data using MYC core signature and MYC hallmark_V2 (41, 42). B–D, Oncogenic MYC induces accumulation of RNA catabolites. HMECs engineered with MYC-ER were induced for MYC hyperactivation (±60 nmol/L 4-OHT for 4 hours) and analyzed by targeted metabolomics. Two representative catabolites that arise from degradation of RNA or DNA [Xanthine, (B)] or from degradation selectively from RNA [Xanthosine, (C)] are shown (data are mean ± SEM, n = 3). D, Heatmap of metabolites in MYC-ER HMECs show log2 fold change in RNA catabolites in MYC-hyperactivated conditions relative to MYC-normal (data are mean of three biological replicates). E, Model of ribonucleotide catabolism resulting from RNA decay. F, Schematic for measuring RNA decay. Cells were incubated ±60 nmol/L 4-OHT to induce MYC-ER, incubated with EU for 1 hour, and then washed out to remove EU. Samples were collected at time 0 to measure EU incorporation (RNA synthesis) and at 2 or 3 hours post-chase to measure RNA decay. G, Boxplot of EU intensity in MYC-ER HMECs shows increased EU incorporation in MYC-hyperactivated state after 1 hour of EU labeling (n > 100 cells per group). H, MYC induces RNA decay. Measurements of EU intensity in MYC-ER HMECs at indicated timepoints after removal of EU (chase). Linear regression indicates faster decay of EU-labeled RNA in MYC-hyperactivated conditions (n > 100 cells per group). Significance was analyzed by two-tailed, unpaired Student t test for B, C, and G; slopes for H were compared using GraphPad Prism’s simple linear regression. *, P < 0.05; **, P < 0.01; ***, P < 0.001.
Figure 2.
Figure 2.
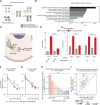
The cytoplasmic RNA exosome mediates MYC-induced RNA decay and cell death. A, Schematic of loss-of-function shRNA screen in MYC-ER HMECs to identify genes required for MYC-induced cell death. B, Gene ontology of enriched cellular components and complexes among the candidate genes (223 genes) required for MYC-induced cell death identified from the shRNA screen. Gene ontology performed using PANTHER (86). FDR shown for pathways with >2-fold enrichment. C, Model illustrating cytoplasmic exosome-driven RNA decay. DIS3L is the catalytic component of cytoplasmic exosome, which degrades single-strand RNA in 3′-5′ direction, producing ribonucleotides that are further processed in catabolic pathways. D, MYC-induced cell death requires DIS3L. MYC-ER HMECs were engineered with and without DIS3L depletion. Cell viability was analyzed by PI staining 24 hours after MYC hyperactivation with 60 nmol/L 4-OHT (data are mean ± SEM, n = 3). E, Exogenous expression of wild-type DIS3L expression restores MYC-induced cell death by treatment with 60 nmol/L 4-OHT for 24 hours in cells with endogenous DIS3L depletion. MYC-ER HMEC cells were engineered with control- or shRNA-resistant-DIS3L cDNA and treated as in D; (data are mean ± SEM, n = 3). F–G, MYC induces elevated RNA decay that requires DIS3L. MYC-ER HMECs with control or DIS3L shRNA [(F), (G) respectively] were labeled with EU for 1 hour ±60 nmol/L 4-OHT to induce MYC-ER. EU was washed out for the indicated “chase” time, and cellular EU intensity was measured via microscopy. Linear regression shows that MYC induces RNA decay (F) and this effect is suppressed by DIS3L depletion (G; n > 100 cells per group). H, MYC-induced expression of abundant RNAs is restrained by the DIS3L ribonuclease. Oncogenic MYC was induced in MYC-ER HMECs with 60 nmol/L 4-OHT for 24 hours with control or DIS3L shRNA, and gene expression measured by RNAseq (ribo-depleted RNA). Genes with FPKM > 1 were divided into 10 deciles based on mean RNA expression across all samples (highest decile in red on left). For each decile, plot shows mean changes in gene expression induced by MYC in DIS3L-depleted state vs. control state. MYC-induces a greater change after DIS3L-depletion in the genes in the top decile (high abundance RNAs) compared to the bottom decile (low abundance RNAs; 1 = HIGHEST, 10 = LOWEST). I, MYC-induced expression of top 500 abundant RNAs is restrained by the DIS3L ribonuclease. RNAseq data from (H) for the 500 most abundant RNAs is shown, with the effect of MYC in control shRNA cells plotted on the x-axis, and the effect of MYC in DIS3L-shRNA cells plotted on the y-axis. Significance was analyzed by binomial test for B; by two-tailed, unpaired Student t test for D,E, and H; and slopes for F and G were compared using GraphPad Prism’s simple linear regression. *P, < 0.05; **, P < 0.01; ***, P < 0.001.
Figure 3.
Figure 3.
Tumor-derived mutations in DIS3L mitigate MYC-induced cell death. A, Deleterious tumor mutations in DIS3L occur in RNA interacting domains including the exonuclease domain. ET scores, which predict the impact of amino acids on protein function, were mapped onto the structure of the functional DIS3L homologue, S. cerevisiae Dis3 (PDB ID 4IFD), with high ET scores clustering in RNA interacting motifs and the catalytic center. Color map of ET coverage displays the estimated importance of each amino acid residue in the DIS3L protein, ranging from red (most important) to purple (least important). Demarcated are RNA (black) and tumor-derived mutations occurring in the catalytic core, with positions annotated for S. cerevisiae Dis3 (black) and human DIS3L (red). B–C, Tumor-derived mutations are predicted to interfere with functions required for DIS3L activity, including catalytic metal and RNA-binding sites. Amino acid sequence alignments of H. sapiens DIS3L (Hs) and S. cerevisiae Dis3 (Sc) highlight the conservation of catalytic core residues of DIS3L- D486 and G786. Corresponding ribbon diagrams show the predicted impact of equivalent S. cerevisiae Dis3 mutations D551N (D486N in H. sapiens; B) and G833S (G786S in H. sapiens; C). B, Dis3 D551 is one of four conserved aspartate residues that, along with D543, D549, and D552, form electrostatic interactions with the incoming RNA near the scissile phosphate (PO4). D551 also coordinates the predicted second divalent metal ion (Mg2+ (predicted)) at the catalytic center necessary for Dis3 two-metal-ion catalysis (67). C, Dis3 G833 lies at a structural position along a narrow stretch of the RNA channel known as the neck region. Structural modeling of Dis3 G833S results in steric clashes with neighboring H831 and a nearby 2'-hydroxyl of the threaded RNA, likely resulting in indirect and direct RNA binding defects, respectively. Pairwise overlap of van der Waals radii (steric clashes) are displayed as red disks. Hydrogen bonds between Dis3 and RNA are shown as black dotted lines. D, Tumor-derived R412C mutation in DIS3L compromises MYC-induced cell death. MYC-ER HMECs were engineered with control- or DIS3L-shRNA and a doxycycline-inducible wild-type or mutant DIS3L cDNA that is resistant to DIS3L shRNA. Bar graph represent MYC-induced cell death upon treatment with 60 nmol/L 4-OHT for 24 hours in control- and DIS3L-depleted state with or without cDNA expression. Wild-type DIS3L cDNA, but not the R412C mutant DIS3L, restored MYC-induced cell death in the presence of DIS3L-shRNA (data are mean ± SEM, n = 3). E, Tumor-derived mutations in DIS3L compromise MYC-induced cell death where cells were incubated ±60 nmol/L 4-OHT to induce MYC-ER. Heatmap of MYC-induced cell death upon overexpression of wild-type or indicated mutant DIS3L cDNA (±DIS3L shRNA). In contrast to wild-type cDNA, DIS3L mutants R412C, G786, and D486N did not restore MYC-induced cell death. Data are normalized to cell death in MYC-induced state with control shRNA. Significance was analyzed by two-tailed, unpaired Student t test for D and E. *, P < 0.05; **, P, <0.01; ***; P, < 0.001.
Figure 4.
Figure 4.
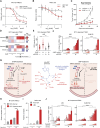
Oncogenic MYC induces cell death through DIS3L-mediated ribonucleotide catabolism and increases dependency on ribonucleotide salvage and HPRT1. A and B, DIS3L is required for oncogenic MYC to induce RNA catabolites. MYC-ER was induced for 4 hours treatment with 60 nmol/L 4-OHT in HMECs expressing control- or DIS3L-shRNA, and cells were evaluated via targeted metabolomics for catabolites specific for RNA degradation [shown in top row of (B), catabolites specific for RNA or DNA degradation (A) and rows 2-5 of (B)] or metabolites unrelated to RNA degradation [data are mean ± SEM, n = 3 for (A) and log2 fold change in catabolites in MYC-hyperactivated conditions relative to MYC-normal in respective genotypes for (B)]. C, Schematic shows the XDH-dependent steps in terminal purine ribonucleotide catabolism that produce ROS. D and E, DIS3L is required for oncogenic MYC to induce ROS. MYC-ER was induced with 60 nmol/L 4-OHT for 16 hours in HMECs expressing control- or DIS3L-shRNA, and cells were evaluated for ROS via CellROX. Representative images of MYC-induced cellular ROS (shown by black pseudocolor, top right picture), which is suppressed by DIS3L depletion (bottom right). Scale bar is 40 µm. Associated quantification in (E; n > 100 cells per group). F, XDH is required for oncogenic MYC to induce ROS. MYC-ER was induced for 16 hours with 60 nmol/L 4-OHT in HMECs expressing control- or XDH-shRNA, and cells were evaluated for ROS via CellROX (n > 100 cells per group). G, XDH is required for MYC-induced cell death. MYC-ER was induced for 24 hours with 60 nmol/L 4-OHT in HMECs expressing control- or XDH-shRNA, and cells were evaluated for cell death (measured via PI incorporation). H, Schematic showing the salvage of hypoxanthine and guanine by HPRT1. I, Oncogenic MYC is synthetic lethal with HPRT1 inhibition. MYC-ER was induced with 4 nmol/L 4-OHT in HMECs with and without HPRT1 depletion. Cell death was measured via PI incorporation (data are mean ± SEM, n = 3). J–K, MYC-dependent breast cancer cell lines are dependent on HPRT1. MYC dependent (J) or MYC independent (K) breast cancer cells were engineered with or without HPRT1 depletion and measured for anchorage-independent proliferation (data are mean ± SEM, n = 3–8). L, HPRT1 depletion impairs progression of established MYC-driven TNBC xenografts. MDA-MB-231 LM2 xenografts cells were transduced with lentivirus encoding three independent doxycycline-inducible HPRT1-shRNAs (or control shRNAs). After tumor formation, animals were randomized ±DOX for 2 weeks. shRNA abundance was quantified using next-generation sequencing. Dot plots show the abundance of HPRT1 shRNA in tumor xenografts (−DOX, n = 4; +DOX, n = 10). M and N,HPRT1 RNA expression is higher in MYC-high breast tumors vs. MYC-low breast tumors in TCGA cohort (M) and METABRIC cohort (N). MYC-high or low tumors were defined as the top or bottom tertile of MYC RNA expression. Significance was analyzed by two-tailed, unpaired Student t test for A, B, EG, and IN. ROUT (Q = 1%) outlier analysis was done for the L right most (relating to HPRT1 shRNA3). *, P < 0.05; **, P < 0.01; ***, P < 0.001.
Figure 5.
Figure 5.
Therapeutic inhibition of HPRT1-mediated ribonucleotide salvage kills MYC-driven breast cancer cells through exacerbating RCS. A, MYC hyperactivation enhances sensitivity to 6-MP. MYC-inducible HMECs were exposed to increasing doses of 6-MP for 24 hours ±MYC hyperactivation with 12 nmol/L 4-OHT (data are mean ± SEM, n = 3). B, MYC-hyperactive TNBC cells exhibit increased sensitivity to 6-MP. MYC-hyperactive TNBC cells (LM2) or MYC-normal TNBC cells (HCC1937) were exposed to increasing doses of 6-MP for 24 hours and measured for cell viability. C, 6-MP impairs MYC-hyperactive tumor progression. After transplantation, LM2 xenografts were randomized ±12.5 mg/kg 6-MP and measured for tumor volume (n = 12 mice per group). D, 6-MP induces purine catabolites but not pyrimidine catabolites in MYC-dependent TNBC cells. LM2 or SUM159 cells were treated with 100 μmol/L 6-MP for 12 hours and measured for xanthine and uracil by targeted metabolomics. Heatmap shows log2 fold change in metabolites relative to the control treatment state (n = 3). E, 6-MP induces ROS in TNBC cells in a DIS3L-dependent manner. LM2 cells engineered with control- or DIS3L-shRNA were treated with 50 μmol/L 6-MP for 24 hours and measured for ROS by CellROX assay (n > 100 cells per group). F, Loss of DIS3L confers resistance to 6-MP in MYC-hyperactive TNBC cells. LM2 (left) or SUM159 (right) cells were engineered with a doxycycline-inducible control- or DIS3L-shRNA that also expresses RFP. Each population was mixed (separately) with non-RFP LM2 or SUM159, treated with increasing doses of 6-MP, and fitness of shRNA-expressing cells was measured over time as RFP-positive population (data are mean ± SEM, n = 3). G, left, Schematic of proposed 6-MP modes of action. 6-MP may kill cancer cells through two distinct mechanisms: (i) As an HPRT1 antagonist (left side), 6-MP may prevent nucleotide salvage and enhance MYC-selective cancer cell killing; (ii) 6-MP is converted into thio-dGTP (right side), which serves as a DNA incorporating poison and may kill cells in a manner independent of MYC. G, middle, Structure of aza-ANP DA-XV-55. DA-XV-55 is an HPRT1 antagonist that cannot be incorporated into DNA. The modified nucleotide moiety (marked in blue) is the active species, i.e. inhibitor of HPRT1 in vitro (74) while the masking prodrug moieties (marked in red) enable cell permeability. G, right, Parent aza-ANP DA-XV-50 may kill cancer cells selectively through inhibiting HPRT1 function. DA-XV-50 inhibits HPRT1 and may impair nucleotide salvage (left side), but it cannot be metabolized into a DNA incorporating poison (in contrast to 6-MP).H, MYC-hyperactivation enhances DA-XV-55-induced cell death. MYC-ER HMECs were treated with vehicle or 10 μmol/L DA-XV-55 in absence/presence of MYC-hyperactivation with 12 nmol/L 4-OHT and measured for caspase 3/7 activity (data are mean ± SEM, n = 3).I,MYC-hyperactive TNBC cells exhibit increased sensitivity to DA-XV-55. MYC-hyperactive TNBC cells (LM2) or MYC-normal TNBC cells (HCC1937) were exposed to 10 μmol/L DA-XV-55 and measured for cell viability (data are mean ± s.e.m., n = 3).J, Loss of DIS3L confers resistance to DA-XV-55 in MYC-hyperactive TNBC cells. LM2 (left) or SUM159 (right) cells were engineered with a doxycycline-inducible control- or DIS3L-shRNA that also expresses RFP. Each population was mixed (separately) with non-RFP LM2 or SUM159, treated with increasing doses of DA-XV-55, and fitness of shRNA-expressing cells was measured over time as RFP-positive population (data are mean ± SEM, n = 3). Significance was analyzed by two-tailed, unpaired Student t test for AE, H, and I. Fold shift in the dose–response curve was tested using nonlinear regression for F and J, *, P < 0.05; **, P < 0.01; ***, P < 0.001.

References

    1. Hanahan D, Weinberg RA. Hallmarks of cancer: the next generation. Cell 2011;144:646–74. - PubMed
    1. Hanahan D, Weinberg RA. The hallmarks of cancer. Cell 2000;100:57–70. - PubMed
    1. Lien EC, Lyssiotis CA, Cantley LC. Metabolic reprogramming by the PI3K-Akt-mTOR pathway in cancer. Recent Results Cancer Res 2016;207:39–72. - PubMed
    1. Düvel K, Yecies JL, Menon S, Raman P, Lipovsky AI, Souza AL, et al. Activation of a metabolic gene regulatory network downstream of mTOR complex 1. Mol Cell 2010;39:171–83. - PMC - PubMed
    1. Sullivan LB, Gui DY, Van Der Heiden MG. Altered metabolite levels in cancer: implications for tumour biology and cancer therapy. Nat Rev Cancer 2016;16:680–93. - PubMed