. 2024 Aug 8;13(8):598.
doi: 10.3390/biology13080598.

Hypoxia-Induced Adaptations of Embryonic Fibroblasts: Implications for Developmental Processes

Affiliations

Hypoxia-Induced Adaptations of Embryonic Fibroblasts: Implications for Developmental Processes

Zeyu Li et al. Biology (Basel). .

Abstract

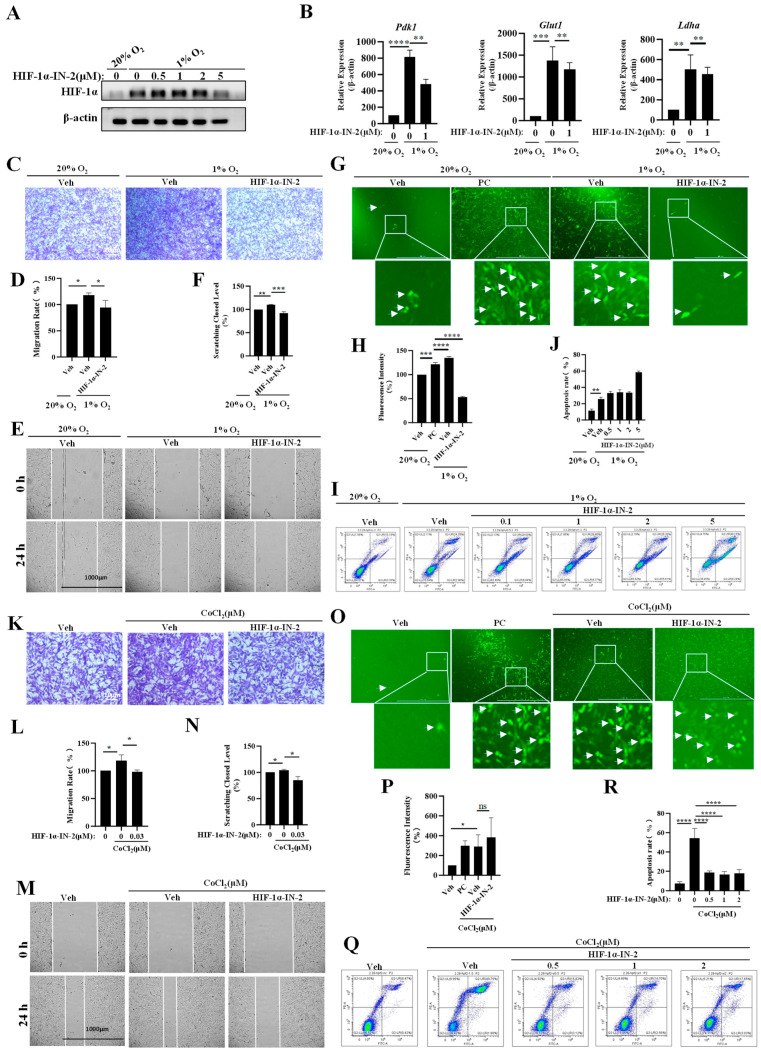
Animal embryonic development occurs under hypoxia, which can promote various developmental processes. Embryonic fibroblasts, which can differentiate into bone and cartilage and secrete various members of the collagen protein family, play essential roles in the formation of embryonic connective tissues and basement membranes. However, the adaptations of embryonic fibroblasts under hypoxia remain poorly understood. In this study, we investigated the effects of hypoxia on mouse embryonic fibroblasts (MEFs). We found that hypoxia can induce migration, promote metabolic reprogramming, induce the production of ROS and apoptosis, and trigger the activation of multiple signaling pathways of MEFs. Additionally, we identified several hypoxia-inducible genes, including Proser2, Bean1, Dpf1, Rnf128, and Fam71f1, which are regulated by HIF1α. Furthermore, we demonstrated that CoCl2 partially mimics the effects of low oxygen on MEFs. However, we found that the mechanisms underlying the production of ROS and apoptosis differ between hypoxia and CoCl2 treatment. These findings provide insights into the complex interplay between hypoxia, fibroblasts, and embryonic developmental processes.

Keywords: CoCl2; HIF1a; MEFs; embryonic development; hypoxia.


Conflict of interest statement

The authors declare that they have no competing interests.

Figures

Figure 1
Figure 1
Establishment of hypoxia model with 1% oxygen and CoCl2 in MEFs. (A) MEFs were treated with 500 μM CoCl2 for the indicated time, and the mRNA levels of the indicated genes were analyzed by qPCR (n = 3 replicates). (B) MEFs were treated with 1% O2 for the indicated time, and the mRNA levels of the indicated genes were analyzed by qPCR (n = 3 replicates). (C,D) Images and quantification of migration of MEFs treated with 1% O2 for 24 h. Values are expressed as relative to the normoxia control group. Data are presented as the mean ± SEM. n = 3 independent experiments. Scale bars: 1000 μm. (E,F) Migration of MEFs treated with the indicated concentrations of CoCl2. Values are expressed as relative to the normoxia control group. Data are presented as the mean ± SEM. n = 3 independent experiments. Quantification of wound closure from three independent experiments is shown. Scale bars: 1000 μm. (G,H) MEFs were subjected to 1% O2 for 2 days and then subjected to a cell invasion assay. Quantification of cells in the invaded area from three independent experiments is shown. Scale bars: 10 μm. (I,J) MEFs were treated with the indicated concentrations of CoCl2 for 2 days and then subjected to a cell invasion assay. Quantification of cells in the invaded area from three independent experiments is shown. Scale bars: 10 μm. (K,L) Images and apoptosis rate of MEFs under hypoxia. Values are expressed as relative to the negative control group. Data are presented as the mean ± SEM. n = 3 independent experiments. (M,N) Images and apoptosis rate of MEFs in the presence of CoCl2. Values are expressed as relative to the negative control group. Data are presented as the mean ± SEM. n = 3 independent experiments. (O,P) MEFs were subjected to hypoxia for 24 h and then subjected to a ROS production assay. Quantification of green fluorescence intensity from three independent experiments is shown. Scale bars: 1000 μm. (Q,R) MEFs were treated with the indicated concentrations of CoCl2 for 24 h and then subjected to a ROS production assay. Quantification of green fluorescence intensity from three independent experiments is shown. PC: positive control. Scale bars: 1000 μm. The white arrows in (O,Q) represent cells that are producing ROS cells. * p < 0.05, ** p < 0.01, *** p < 0.0001, **** p < 0.0001.
Figure 2
Figure 2
The functional annotation of the differentially expressed genes in MEFs’ response to hypoxia. (A,B) Volcano map (A) and heatmap (B) of the differentially expressed genes under hypoxia. (CF) The GO annotation (upregulation in (C) and downregulation in (D)) and KEGG pathway enrichment (upregulation in (E) and downregulation in (F)) analysis of the differentially expressed genes. Nor: normoxia group. Hyp: hypoxia was induced in 1% O2.
Figure 3
Figure 3
A HIF1α inhibitor inhibits multiple processes in MEFs. (A) MEFs were treated with 1% O2 in the presence or absence of HIF-1α-IN2 for the indicated time, and the protein levels of the indicated proteins were analyzed by Western blotting (n = 3 replicates) (Figure S3: uncropped gels). (B) MEFs were treated with 1% O2 in the presence or absence of HIF-1α-IN2 for the indicated time, and the mRNA levels of indicated genes were analyzed by qPCR (n = 3 replicates). (C,D) MEFs were treated with 1% O2 in the presence or absence of HIF-1α-IN2 for the indicated time and then subjected to cell invasion assay. Quantification of cells in the invaded area from three independent experiments is shown. Scale bars: 10 μm. (E,F) Images and quantification of migration of MEFs under 1% O2 in the presence or absence of HIF-1α-IN2 for 24 h. Values are expressed as relative to the negative control group. n = 3 independent experiments. Scale bars: 1000 μm. (G,H) MEFs were subjected to 1% O2 for 24 h in the presence or absence of HIF-1α-IN2 and then subjected to a ROS production assay. Quantification of green fluorescence intensity from three independent experiments is shown. PC: positive control. Scale bars: 1000 μm. (I,J) Images and apoptosis rates of MEFs under 1% O2 in the presence or absence of HIF-1α-IN2. Values are expressed as relative to the negative control group. Data are presented as the mean ± SEM. n = 3 independent experiments. (K,L). MEFs were treated with 50 μM CoCl2 in the presence or absence of HIF-1α-IN2 for the indicated time, and then subjected to cell invasion assay. Quantification of cells in the invaded area from three independent experiments is shown. Scale bars: 25 μm. (M,N) Images and quantification of migration of MEFs under 50 μM CoCl2 stimulation in the presence or absence of HIF-1α-IN2 for 24 h. Values are expressed as relative to the negative control group. Data are presented as the mean ± SEM. n = 3 independent experiments. Scale bars: 1000 μm. (O,P) MEFs were subjected to 500 μM CoCl2 stimulation for 24 h in the presence or absence of HIF-1α-IN2 and subjected to a ROS production assay. Quantification of green fluorescence intensity from three independent experiments is shown. PC: positive control. Scale bars: 1000 μm. (Q,R) Images and apoptosis rate of MEFs under 500 μM CoCl2 stimulation in the presence or absence of HIF-1α-IN2. Values are expressed as relative to the negative control group. Data are presented as the mean ± SEM. n = 3 independent experiments. The white arrows in (G,O) represent cells that are producing ROS cells. * p < 0.05, ** p < 0.01, *** p < 0.0001, **** p < 0.0001.
Figure 4
Figure 4
New genes response to hypoxia. (A) MEFs were treated with 1% O2 for the indicated time, and the mRNA levels of indicated genes were analyzed by qPCR. (n = 3 replicates). (B) MEFs were treated with 1% O2 in the presence or absence of HIF-1α-IN2 for the indicated time, and the mRNA levels of the indicated genes were analyzed by qPCR (n = 3 replicates). (C) MEFs were treated with 500 μM CoCl2 in the presence or absence of HIF-1α-IN2 for the indicated time, and the mRNA levels of the indicated genes were analyzed by qPCR (n = 3 replicates). * p < 0.05, ** p < 0.01, *** p < 0.0001, **** p < 0.0001.
Figure 5
Figure 5
The functional annotation of the differentially expressed genes in MEFs in response to CoCl2. (A,B) Volcano map (A) and heatmap (B) of the differentially expressed genes after CoCl2 treatment. (CF) The GO annotation (upregulation in (C) and downregulation in (D)) and KEGG pathway enrichment (upregulation in (E) and downregulation in (F)) analysis of the differentially expressed genes. Nor: normoxia group.
Figure 6
Figure 6
The functional annotation of the differentially expressed genes in MEFs in response to hypoxia and CoCl2. (A,B) Volcano plot (A) and heatmap (B) of the differentially expressed genes between hypoxia and CoCl2 treatment. The volcano plot displays the log 2-fold change versus the -log10 p-value for each gene. The heatmap shows the expression levels of differentially expressed genes across different samples. (CF) GO annotation (upregulation in (C) and downregulation in (D)) and KEGG pathway enrichment (upregulation in (E) and downregulation in (F)) analysis of differentially expressed genes. Hyp: hypoxia group.

References

    1. Wan J.J., Yi J., Wang F.Y., Zhang C., Dai A.G. Expression and regulation of HIF-1a in hypoxic pulmonary hypertension: Focus on pathological mechanism and Pharmacological Treatment. Int. J. Med. Sci. 2024;21:45–60. doi: 10.7150/ijms.88216. - DOI - PMC - PubMed
    1. Jiang T.T., Ji C.L., Yu L.J., Song M.K., Li Y., Liao Q., Wei T., Olatunji O.J., Zuo J., Han J. Resveratrol-induced SIRT1 activation inhibits glycolysis-fueled angiogenesis under rheumatoid arthritis conditions independent of HIF-1alpha. Inflamm. Res. 2023;72:1021–1035. doi: 10.1007/s00011-023-01728-w. - DOI - PubMed
    1. Yin J., Ren Y., Yang K., Wang W., Wang T., Xiao W., Yang H. The role of hypoxia-inducible factor 1-alpha in inflammatory bowel disease. Cell Biol. Int. 2022;46:46–51. doi: 10.1002/cbin.11712. - DOI - PubMed
    1. Jing X., Yang F., Shao C., Wei K., Xie M., Shen H., Shu Y. Role of hypoxia in cancer therapy by regulating the tumor microenvironment. Mol. Cancer. 2019;18:157. doi: 10.1186/s12943-019-1089-9. - DOI - PMC - PubMed
    1. Okazaki K., Maltepe E. Oxygen, epigenetics and stem cell fate. Regen. Med. 2006;1:71–83. doi: 10.2217/17460751.1.1.71. - DOI - PubMed

LinkOut - more resources