

Mapping the Distribution of Curculio davidi Fairmaire 1878 under Climate Change via Geographical Data and the MaxEnt Model (CMIP6)
- PMID: 39194788
- PMCID: PMC11354663
- DOI: 10.3390/insects15080583
Mapping the Distribution of Curculio davidi Fairmaire 1878 under Climate Change via Geographical Data and the MaxEnt Model (CMIP6)
Abstract
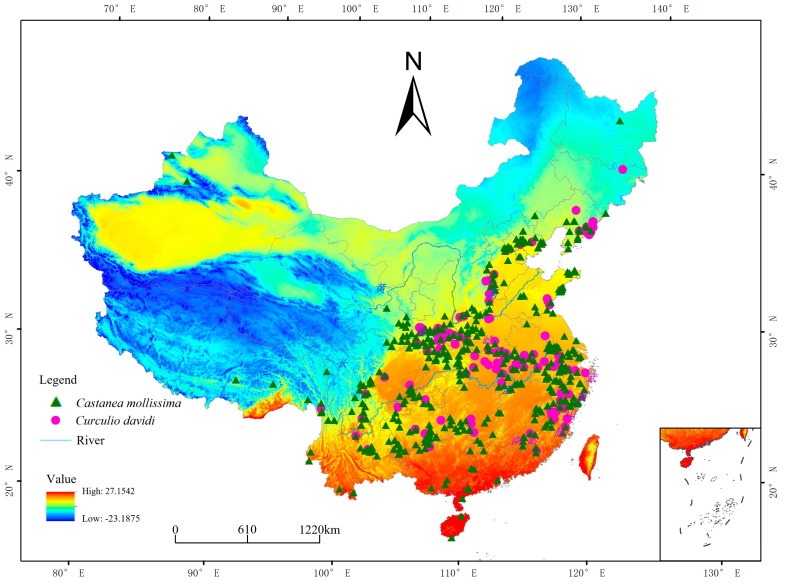
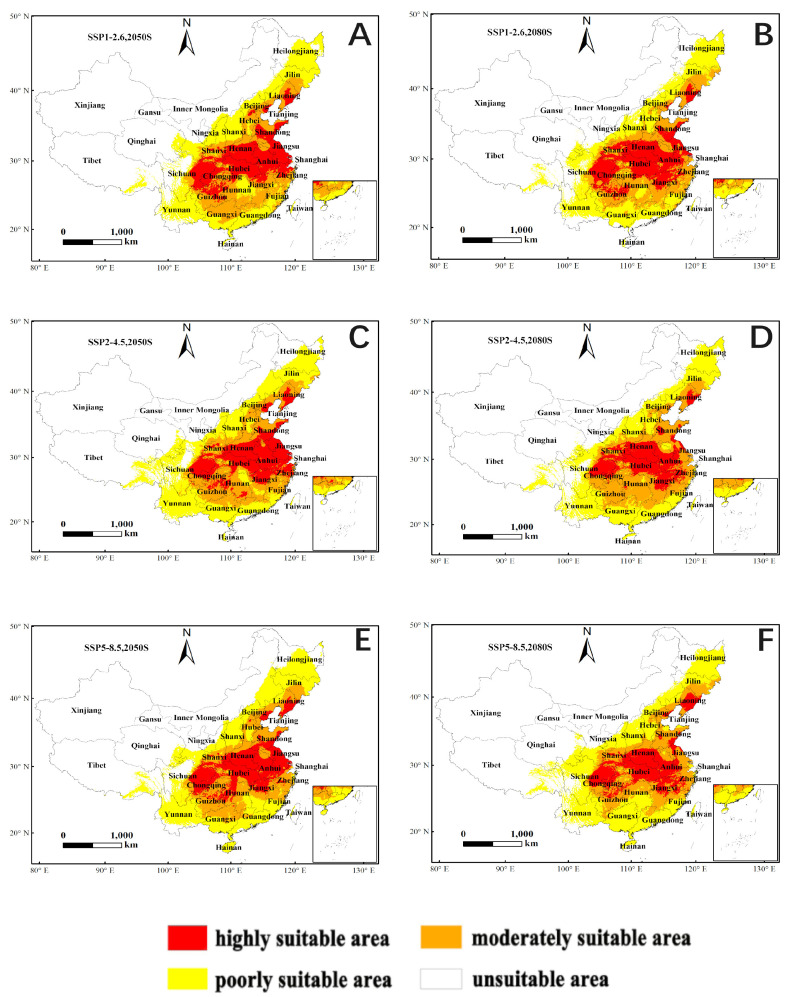
Curculio davidi is a major pest in chestnut-producing regions in China, and there have been many studies on its occurrence, biological characteristics, and management strategies. However, few of them have focused on the distribution changes of the pest under climate change. In this study, the MaxEnt model (version 3.3.4) and ArcGIS software (version 10.8) were first employed to map the current and future (2050 s and 2080 s) suitable habitat distribution of the weevil under climate change (CMIP 6: SSP1-2.6, SSP2-4.5, and SSP5-8.5). The results indicate that the highly suitable areas for C. davidi are mainly concentrated in Hubei, Henan, Anhui, Jiangxi, Jiangsu, Zhejiang, the coastal areas of Shandong, and eastern Guizhou, northwestern Hunan, and northeastern Sichuan provinces in China. Through the Jackknife test of 19 climate factors, six climate factors affecting the distribution of C. davidi were identified, with precipitation from July (Prec7), precipitation of warmest quarter (Bio18), and temperature seasonality (standard deviation × 100) (Bio4) contributing a combined percentage of 86.3%. Under three different climate scenarios (CMIP 6: SSP1-2.6, SSP2-4.5, and SSP5-8.5), the area of moderately suitable regions is projected to increase by 22.12-27.33% in the 2050 s and by 17.80-38.22% in the 2080 s compared to the current distribution, while the area of highly suitable regions shows a shrinking trend. This study provides data support for the management strategies of C. davidi and offers new insights into the dynamic changes of similar forestry pests.
Keywords: Curculio davidi; MaxEnt model; climate change; potential distribution.
Conflict of interest statement
The authors declare no conflicts of interest.
Figures


References
-
- Chen J., Wei X., Liu Y., Min Q., Liu R., Zhang W., Guo C. Extraction of Chestnut Forest Distribution based on Multi-temporal Remote Sensing Observations. Remote Sens. Technol. Appl. 2020;35:1226–1236.
-
- Kan L., Li Q., Xie S., Ouyang J. Resource distribution and nutritional quality difference of Chinese chestnuts. Sci. Technol. Food Ind. 2016;37:396–400.
-
- Caliskan S., Göltaş M., Aslan V., Özer G., Tandoğan M., Sezgin G., Cebeci H. Variation in fruit traits and infestation ratios in natural sweet chestnut (Castanea sativa) populations under chestnut weevil (Curculio elephas) damage. Biologia. 2020;75:2287–2294. doi: 10.2478/s11756-020-00491-1. - DOI
-
- Chen C., Xie Y., Zhou X., Wang X., Wang Y. Virulence of three strains of Beauveria bassiana infected Curculio davidi Fairmaire. J. Environ. Entomol. 2017;39:198–206.
Grants and funding
LinkOut - more resources
Full Text Sources
