. 2024 Sep 17;63(18):2310-2322.
doi: 10.1021/acs.biochem.3c00344. Epub 2024 Aug 28.

Sulfotransferase 1C2 Increases Mitochondrial Respiration by Converting Mitochondrial Membrane Cholesterol to Cholesterol Sulfate

Affiliations

Sulfotransferase 1C2 Increases Mitochondrial Respiration by Converting Mitochondrial Membrane Cholesterol to Cholesterol Sulfate

Alexander J Kolb et al. Biochemistry. .

Abstract

Hypothesis: In this communication, we test the hypothesis that sulfotransferase 1C2 (SULT1C2, UniProt accession no. Q9WUW8) can modulate mitochondrial respiration by increasing state-III respiration.

Methods and results: Using freshly isolated mitochondria, the addition of SULT1C2 and 3-phosphoadenosine 5 phosphosulfate (PAPS) results in an increased maximal respiratory capacity in response to the addition of succinate, ADP, and rotenone. Lipidomics and thin-layer chromatography of mitochondria treated with SULT1C2 and PAPS showed an increase in the level of cholesterol sulfate. Notably, adding cholesterol sulfate at nanomolar concentration to freshly isolated mitochondria also increases maximal respiratory capacity. In vivo studies utilizing gene delivery of SULT1C2 expression plasmids to kidneys result in increased mitochondrial membrane potential and confer resistance to ischemia/reperfusion injury. Mitochondria isolated from gene-transduced kidneys have elevated state-III respiration as compared with controls, thereby recapitulating results obtained with mitochondrial fractions treated with SULT1C2 and PAPS.

Conclusion: SULT1C2 increases mitochondrial respiratory capacity by modifying cholesterol, resulting in increased membrane potential and maximal respiratory capacity. This finding uncovers a unique role of SULT1C2 in cellular physiology and extends the role of sulfotransferases in modulating cellular metabolism.


Conflict of interest statement

The authors declare no competing financial interest.

Figures
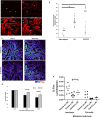
Figure 1
Figure 1
Mitochondrial membrane analysis following gene delivery and IPC. TMRM-labeled mitochondria by intravital microscopy in sham rats (A), rats following mock transfection (B), transfection with SULT1C2 (C), or following IPC (D). (E) Fluorescence intensity measurements compared between saline-injected kidneys (saline), IPC-treated kidneys, and SULT1C2 gene-delivered kidneys. *p value < 0.001, $p value < 0.001. N = 50 for each group, bars = standard deviation. (F) 5 and 30 min post infusion of TMRM, image at 30× magnification for the LAC-Z transfected rat on the left (taken for a larger view of the renal surface). Panels on the right show a similar set of micrographs for the SULT1C2 transfected rat; a pseudo-color intensity scale bar is located below figure F. Note the significant decrease in intensity throughout the tubules in the control LAC-Z transfected rat between the first and last time point. In contrast, the SULT1C2 micrographs at 30 min show a minimal decrease in intensity. This is consistent with the experimental design. Retention of TMRM in the tubules after a single bolus will be dependent on mitochondrial potential alone; greater potential reduces loss of fluorescence over time. The graph in panel G displays the analysis of the 60× images from the 10 fields, showing a significant difference in dye retention at the 15 and 30 minute time points. Bar = 40 μm. (H) Renal cortical mitochondria isolated from saline-treated kidneys (vehicle w/o IRI), saline-treated kidneys with I/R injury or kidneys injected with plasmids encoding SULT1C2 and then subjected to I/R injury (SULT1C2 w IRI) were subsequently studied using an Oroboros O2 oxygraph. The maximum oxygen flux (OCR) in response to added pyruvate or isocitrate was measured. *p < 0.05, N = 4, comparing OCR with isocitrate added as a substrate comparing vehicle-treated kidneys to SULT1C2 plasmid DNA-treated kidneys.
Figure 2
Figure 2
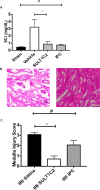
SULT1C2 gene delivery prevents ischemic injury. (A) Serum creatinine measurements comparison between sham, vehicle-treated, SULT1C2 gene delivery, and IPC groups. #—no statistical difference between sham, SULT1C2, and IPC groups (N = 4). *p < 0.01 comparing vehicle and SULT1C2 groups (N = 4). This data shows that SULT1C2 confers protection against subsequent ischemic injury like the effect of IPC. (B) Hematoxylin and eosin staining of corticomedullary kidney junctions. Left panel: vehicle-treated kidney. Right panel: SULT1C2 transformed kidney. The vehicle-treated kidney shows signs of extensive necrosis that is missing in the SULT1C2 transformed kidney. Both kidney sections are made from tissue fixed 24 h after a 40 min renal pedicle cross-clamp-induced ischemic injury. Bar = 25 μm. (C) Medullary injury scores comparing kidney cortico-medullary regions from kidneys treated with ischemia-reperfusion injury (IRI = 40 min renal pedicle cross-clamp) 7 days after saline (vehicle) hydrodynamic delivery or SULT1C2 gene delivery. Alternatively, kidneys were subjected to IRI after a treatment 14 days before IPC. All tissues are stained with hematoxylin and eosin. A blinded reviewer determined all injury scores. *p < 0.01 comparing IRI/saline vs IRI/SULT1C2 gene transduced kidneys. #p < 0.05 comparing IRI/saline vs IRI/IPC kidneys. N = 5 for each group with three replicates. This data shows that SULT1C2 gene transduction protects against subsequent ischemic injury.
Figure 3
Figure 3
SULT1C2 and PAPS or cholesterol sulfate increases state-III respiration in vitro. Mitochondrial oxygen consumption is measured in the presence of isolated mitochondria treated with (A) SULT1C2 or (B) SULT1C2/PAPS following the addition of succinate (S) and ADP (D). (C). Measurement of mitochondrial respiration following the addition of succinate (S) or succinate/ADP (SD) in isolated mitochondria treated with vehicle, PAPS, SULT1C2, or the combination of SULT1C2/PAPS. (D). Mitochondrial respiration is also analyzed with and without the addition of 10 nM cholesterol sulfate vs vehicle. Data indicates that the addition of the cholesterol sulfate (10 nM) increases mitochondrial respiration compared to controls (*p < 0.05 control vs cholesterol sulfate; #p < 0.05 control vs SULT1C2/PAPS).
Figure 4
Figure 4
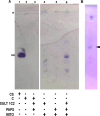
SULT1C2 converts cholesterol to cholesterol sulfate in mitochondrial membranes. Thin-layer chromatography analysis shows that mitochondria have cholesterol sulfate. (A) Synthesis of cholesterol sulfate by SULT1C2 is dependent on PAPS. SULT1C2 does not convert cholesterol to cholesterol sulfate in the absence of mitochondria. Conversion of mitochondrial cholesterol to cholesterol sulfate is dependent on PAPS. C: cholesterol, CS: cholesterol sulfate, MITO: mitochondria, PAPS: 3′phosphoadenosine-5-phosphosulfate, and SULT1C2: sulfotransferase 1C2. ** Cholesterol sulfate signal and region where cholesterol sulfate is expected to migrate on the thin-layer chromatography plate based on the migration of pure cholesterol sulfate. * Cholesterol signal and region where cholesterol is expected to migrate on the thin-layer chromatography plate based on the migration of pure cholesterol. (B) Mitochondria isolated from ischemia preconditioned kidneys have cholesterol sulfate in their lipid membranes. Arrowhead points to the cholesterol sulfate signal. The signal at the top of the image is cholesterol.
Figure 5
Figure 5
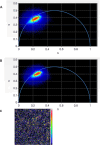
Fluorescence lifetime analysis of SULT1C2 and PAPS activity on mitochondrial membrane fluidity. Mitochondria were analyzed by FLIM following the addition of Laurdan, MitoTracker Red, SULT1C2, and PAPS. (A) Phasor plot of control mitochondria. (B) Phasor plot of mitochondria treated with SULT1C2 and PAPS. Phasor plots show that the addition of SULT1C2 and PAPS decreases Laurdan fluorescent lifetime, indicating potential changes in mitochondrial membrane organization. Control lifetime τb = 4.12 ns, τg = 4.55 ns vs SULT1C2-treated lifetime τb = 3.66 ns, τg = 4.48 ns (p < 0.05). Red circles identify the population of maximum signals collected from 10 images to determine fluorescence lifetimes (τ). (C) Image capture of MitoTracker Red stain of mitochondria analyzed by fluorescence lifetime measurements. The image is from the confocal image taken with a 580 nm excitation and emission at 644 nm. In the experiment, Laurdan fluorescence was achieved by two-photon excitation at 860 nm with emissions captured at 430–450 nm (blue) and 480–500 nm (green). Bar = 100 μm.

References

    1. Murry C. E.; Jennings R. B.; Reimer K. A. Preconditioning with ischemia: a delay of lethal cell injury in ischemic myocardium. Circulation 1986, 74, 1124–1136. 10.1161/01.CIR.74.5.1124. - DOI - PubMed
    1. Islam C. F.; Mathie R. T.; Dinneen M. D.; Kiely E. A.; Peters A. M.; Grace P. A. Ischaemia-reperfusion injury in the rat kidney: the effect of preconditioning. Br. J. Urol. 1997, 79, 842–847. 10.1046/j.1464-410X.1997.00209.x. - DOI - PubMed
    1. Athanasiadis D.; Kapelouzou A.; Martikos G.; Katsimpoulas M.; Schizas D.; Vasdekis S. N.; Kostakis A.; Liakakos T. D.; Lazaris A. M. Remote Ischemic Preconditioning May Attenuate Renal Ischemia-Reperfusion Injury in a Porcine Model of Supraceliac Aortic Cross-Clamping. J. Vasc. Res. 2015, 52, 161–171. 10.1159/000439219. - DOI - PubMed
    1. Gill R.; Kuriakose R.; Gertz Z. M.; Salloum F. N.; Xi L.; Kukreja R. C. Remote ischemic preconditioning for myocardial protection: update on mechanisms and clinical relevance. Mol. Cell. Biochem. 2015, 402, 41–49. 10.1007/s11010-014-2312-z. - DOI - PubMed
    1. Hussein A. M.; Sakr H. F.; Alenzi F. Q. Possible Underlying Mechanisms of the Renoprotective Effect of Remote Limb Ischemic Preconditioning Against Renal Ischemia/Reperfusion Injury: A Role of Osteopontin, Transforming Growth Factor-Beta and Survivin. Nephron 2016, 134, 117–129. 10.1159/000447953. - DOI - PubMed

Publication types