. 2024 Oct 15;213(8):1053-1060.
doi: 10.4049/jimmunol.2400264.

Cutting Edge: Low-dose Recombinant IL-2 Treatment Prevents Autoantibody Responses in Systemic Lupus Erythematosus via Regulatory T Cell-independent Depletion of T Follicular Helper Cells

Affiliations

Cutting Edge: Low-dose Recombinant IL-2 Treatment Prevents Autoantibody Responses in Systemic Lupus Erythematosus via Regulatory T Cell-independent Depletion of T Follicular Helper Cells

Silvia Santana et al. J Immunol. .

Abstract

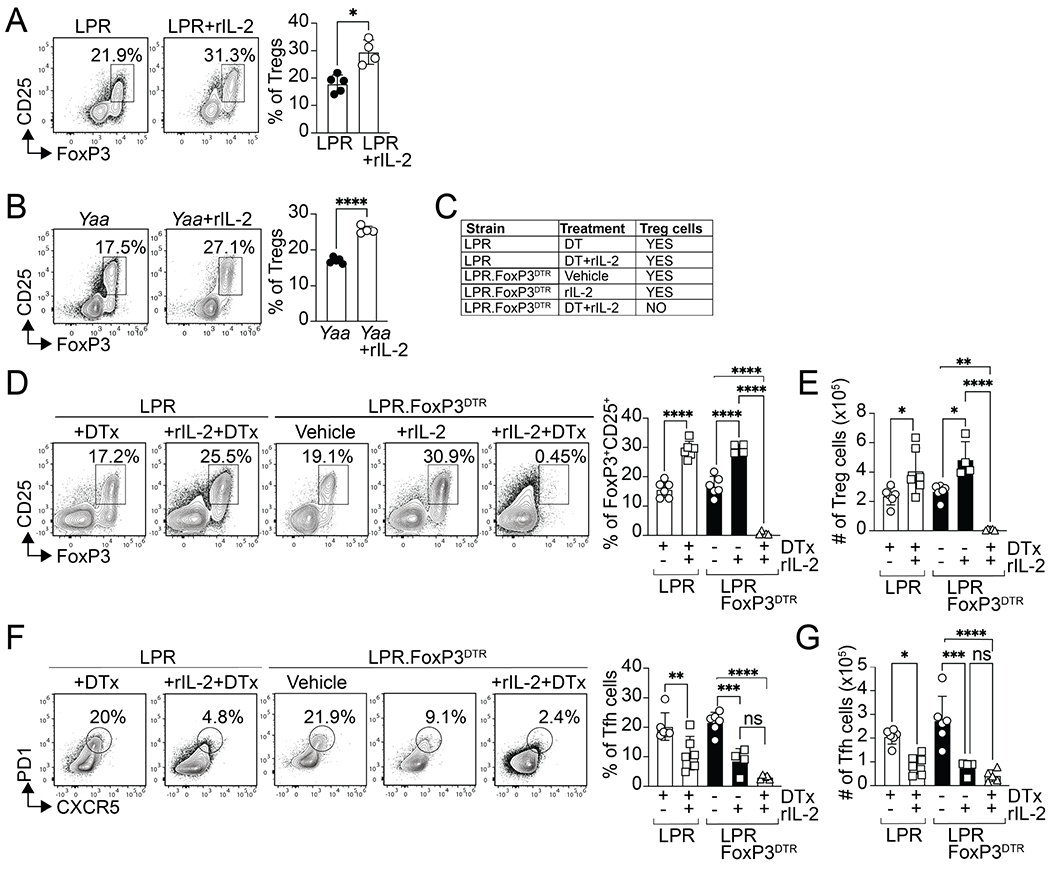
The expansion of T follicular helper (Tfh) cells correlates with disease progression in human and murine systemic lupus erythematosus (SLE). Unfortunately, there are no therapies to deplete Tfh cells. Importantly, low-dose rIL-2-based immunotherapy shows potent immunosuppressive effects in SLE patients and lupus-prone mice, primarily attributed to the expansion of regulatory T cells (Tregs). However, IL-2 can also inhibit Tfh cell differentiation. In this study, we investigate the potential of low-dose rIL-2 to deplete Tfh cells and prevent autoantibody responses in SLE. Our data demonstrate that low-dose rIL-2 efficiently depletes autoreactive Tfh cells and prevents autoantibody responses in lupus-prone mice. Importantly, this immunosuppressive effect was independent of the presence of Tregs. The therapeutic potential of eliminating Tfh cells was confirmed by selectively deleting Tfh cells in lupus-prone mice. Our findings demonstrate the critical role of Tfh cells in promoting autoantibody responses and unveil, (to our knowledge), a novel Treg-independent immunosuppressive function of IL-2 in SLE.


Figures

Figure 1.
Figure 1.. Effect of Low-dose rIL-2 treatment on Tfh cell and ASC responses in LPR mice.
Frequency (A) and number (B) of Tfh cells in the mediastinal LNs of 8-month-old WT and LPR mice. Frequency (C) and number (D) of ASC cells in the mediastinal LNs of 8-month-old WT and LPR mice. Frequency (E) and number (F) of ASC cells in the spleen of 8-month-old WT and LPR mice. (G-K) Cells from the cervical LNs from 6-month-old LPR mice were analyzed by flow cytometry after 10 weeks of treatment with either PBS or 30,000 units of rIL-2 administered twice a week. The frequency (G) and number (H) of Tfh cells, the frequency (I) and number (J) of ASC cells, and the frequency of IgG anti-dsDNA-specific ELISPOTs (K) are shown. (L-O) Anti-dsDNA IgG antibodies (L) in the serum of 7-month-old LPR mice after 16 weeks of treatment with either PBS or 30,000 units of rIL-2 administered twice a week. Glomerular IgG deposits in the kidneys of these mice were visualized using IgG immunofluorescence staining. IgG Corrected Total Cell Fluorescence (CTCF) (M) and the number of IgG+ Glomeruli per field (N) are shown. (O) High powered (40x objective magnification) images of H+E-stained kidney specimens focusing on renal glomeruli and the surrounding interstitium were evaluated for pathologic lesions. The average renal pathology score reflecting the average both glomerular and renal interstitial scores are shown. All data are representative of three independent experiments (n=5-7 mice/group). Representative plots and images are shown. Data shown as the mean ± SD. P values were determined using a two-tailed Student’s t-test.
Figure 2.
Figure 2.. Low-dose rIL-2 prevents Tfh cell and ASC responses in FcgR2b−/−Yaa mice.
(A-G) Five-month-old FcgR2b−/−Yaa mice (Yaa) mice were analyzed after 12 weeks of treatment with either PBS or 30,000 units of rIL-2 administered three times per week. The frequency and number of Tfh cells (A-B) and ASC cells (C-D) in the cervical LNs were determined by flow cytometry. Representative plots gated on CD4+CD3+CD8 CD19 and CD3 cells are shown. (E) The presence of anti-dsDNA and anti-histone IgG antibodies in the serum was assessed by ELISA. (F-G) Glomerular IgG deposits in the kidneys were visualized by IgG immunofluorescence staining. IgG Corrected Total Cell Fluorescence (CTCF) (F) and the number of IgG+ Glomeruli (G) per field are shown. Data are representative of two independent experiments (n=4-5 mice/group). Representative plots and images are shown. Data shown as the mean ± SD. P values were determined using a two-tailed Student’s t-test.
Figure 3.
Figure 3.. Low-dose rIL-2 treatment depletes Tfh cells in the absence of Treg cells.
(A) Frequency of CD25+FoxP3+ cells within the CD4+ T cells in the cervical LNs from 8-month-old LPR mice after 10 weeks of treatment with either PBS or 30,000 units of rIL-2 administered twice a week. Representative plots gated on CD4+CD3+CD8 CD19 cells are shown. Data are representative of three independent experiments (n=5-7 mice/group). Data shown as the mean ± SD. P values were determined using a two-tailed Student’s t-test. (B) Frequency of CD25+FoxP3+ cells within the CD4+ T cells in the cervical LNs from 5-month-old FcgR2b−/−Yaa mice (Yaa) mice after 12 weeks of treatment with either PBS or 30,000 units of rIL-2 administered three times per week Representative plots gated on CD4+CD3+CD8 CD19 cells are shown. Data are representative of two independent experiments (n=4-5 mice/group). Data shown as the mean ± SD. P values were determined using a two-tailed Student’s t-test. (C-G) 7-month-old LPR and LPR.FoxP3DTR mice were treated daily with 30,000 U of rIL-2 or vehicle for seven days and received or not DT on days 0 and 5. (C) The table shows the specific treatment combinations for each group. Frequency (D) and number (E) of CD25+FoxP3+ cells in the cervical LNs on day 8. Representative plots gated on CD4+CD3+CD8 CD19 cells are shown. Frequency (F) and number (G) of Tfh cells in the cervical LNs on day 8. Representative plots gated on CD4+CD3+CD8 FoxP3CD19 cells are shown. Data are representative of three independent experiments (n=4-6 mice/group). Data shown as the mean ± SD. All P values were determined by one-way ANOVA with post-hoc Tukey’s multiple comparison test.
Figure 4.
Figure 4.. Diminished Tfh cell and ASC responses in LPR.Il6−/− mice.
Cells from the cervical LNs of 8-month-old LPR and LPR.Il6 mice were analyzed by flow cytometry. Frequency (A) and number (B) of Tfh cells. Representative plots gated on CD4+CD3+CD8 CD19 cells. Frequency (C) and number (D) of ASC cells. Representative plots gated on CD3 cells are shown. (E) The presence of anti-dsDNA IgG antibodies in the serum was assessed by ELISA. (F) Glomerular IgG deposits in the kidneys were visualized by IgG immunofluorescence staining. Frequency (G) and number (H) of CD25+FoxP3+ Treg cells in the cervical LNs. Representative plots gated on CD4+CD3+CD8 CD19 cells are shown. Data are representative of three independent experiments (n=7-8 mice/group). Representative plots and images are shown. Data shown as the mean ± SD. P values were determined using a two-tailed Student’s t-test.
Figure 5.
Figure 5.. Lack of Tfh cells in LPR.Tfh−/− mice prevents auto-reactive B cell responses.
(A-F) Cells from the cervical LNs of eight-month-old LPR and LPR.Tfh−/− mice were analyzed by flow cytometry. Frequency (A) and number (B) of Tfh cells. Representative plots gated on CD4+CD3+CD8 CD19 cells. Frequency (C) and number (D) of FoxP3+ Treg cells. Representative plots gated on CD3+CD19 cells are shown. Frequency (E) and number (F) of ASC cells. Representative plots gated on CD3 cells are shown. (G) The presence of anti-dsDNA and anti-histone IgG antibodies in the serum was assessed by ELISA. (H-I) Glomerular IgG deposits in the kidneys were visualized using IgG immunofluorescence staining. IgG Corrected Total Cell Fluorescence (CTCF) (H) and the number of IgG+ Glomeruli (I) per field are shown. Data are representative of three independent experiments (n=8 mice/group). Data shown as the mean ± SD. P values were determined using a two-tailed Student’s t-test.

References

    1. Mountz JD, Hsu HC, and Ballesteros-Tato A. 2019. Dysregulation of T Follicular Helper Cells in Lupus. J Immunol 202: 1649–1658. - PMC - PubMed
    1. DeFranco AL 2016. Germinal centers and autoimmune disease in humans and mice. Immunol Cell Biol 94: 918–924. - PMC - PubMed
    1. Elsner RA, and Shlomchik MJ. 2020. Germinal Center and Extrafollicular B Cell Responses in Vaccination, Immunity, and Autoimmunity. Immunity 53: 1136–1150. - PMC - PubMed
    1. Jenks SA, Cashman KS, Woodruff MC, Lee FE, and Sanz I. 2019. Extrafollicular responses in humans and SLE. Immunol Rev 288: 136–148. - PMC - PubMed
    1. Jenks SA, Cashman KS, Zumaquero E, Marigorta UM, Patel AV, Wang X, Tomar D, Woodruff MC, Simon Z, Bugrovsky R, Blalock EL, Scharer CD, Tipton CM, Wei C, Lim SS, Petri M, Niewold TB, Anolik JH, Gibson G, Lee FE, Boss JM, Lund FE, and Sanz I. 2018. Distinct Effector B Cells Induced by Unregulated Toll-like Receptor 7 Contribute to Pathogenic Responses in Systemic Lupus Erythematosus. Immunity 49: 725–739 e726. - PMC - PubMed

MeSH terms

LinkOut - more resources