

Combined High-Throughput Proteomics and Random Forest Machine-Learning Approach Differentiates and Classifies Metabolic, Immune, Signaling and ECM Intra-Tumor Heterogeneity of Colorectal Cancer
- PMID: 39195201
- PMCID: PMC11352245
- DOI: 10.3390/cells13161311
Combined High-Throughput Proteomics and Random Forest Machine-Learning Approach Differentiates and Classifies Metabolic, Immune, Signaling and ECM Intra-Tumor Heterogeneity of Colorectal Cancer
Abstract
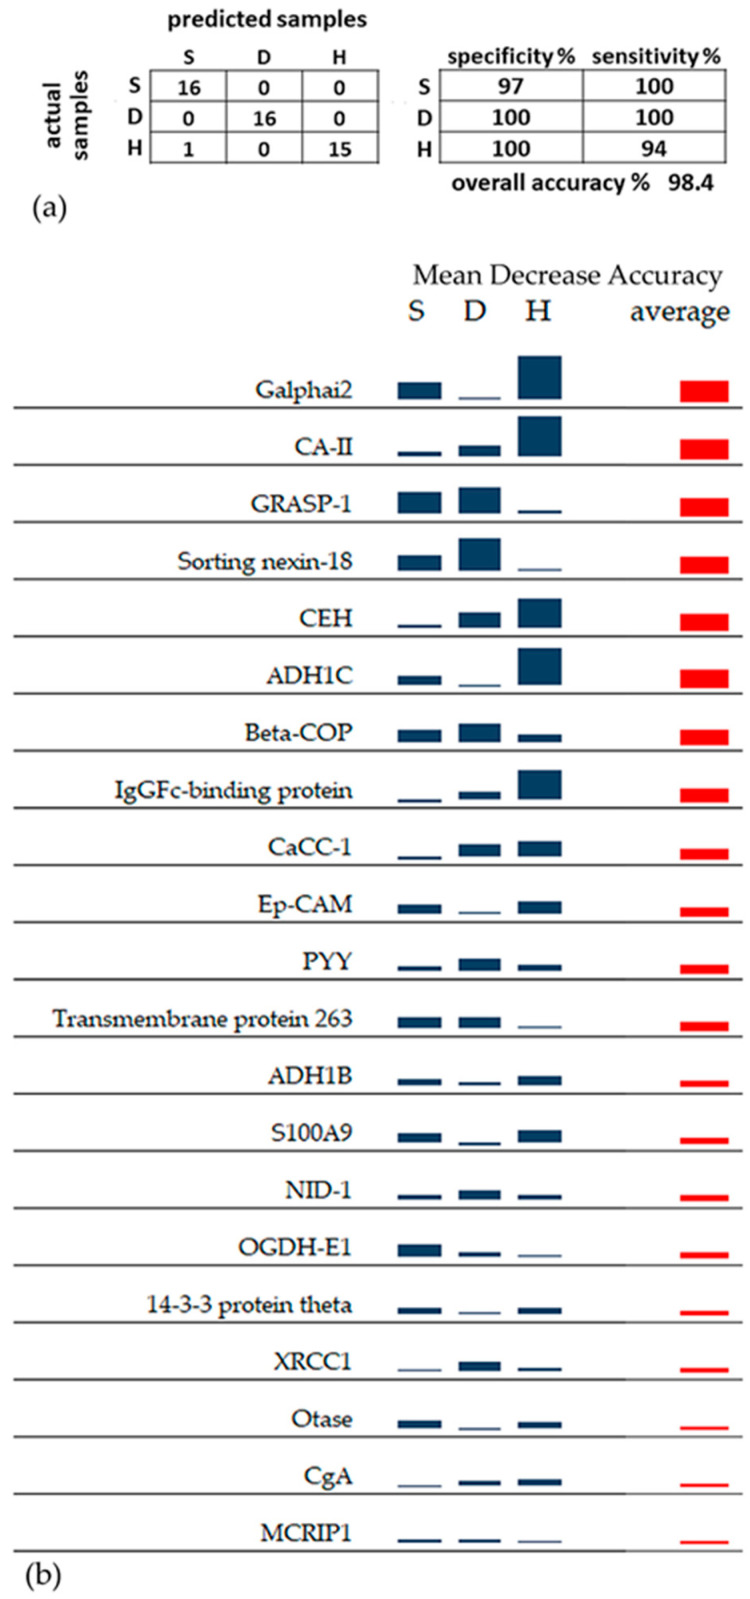
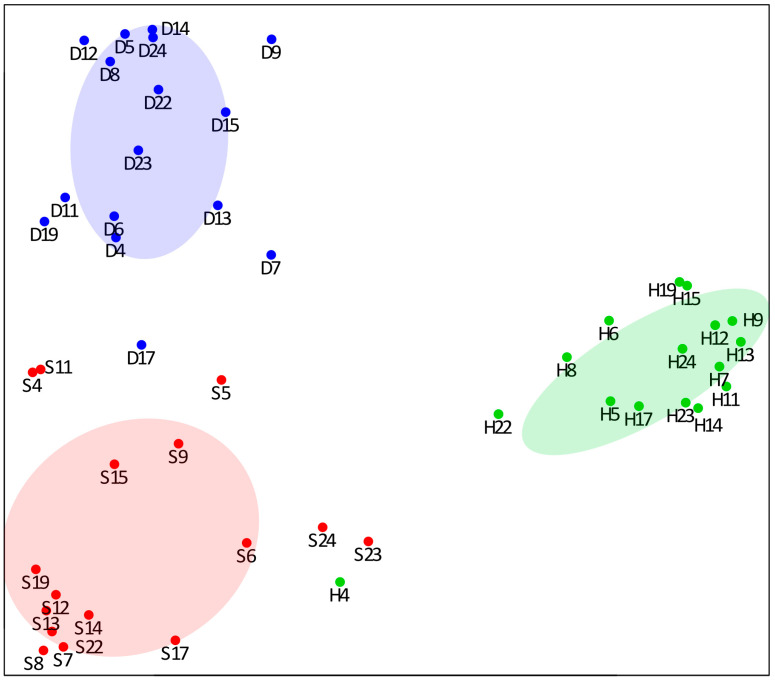
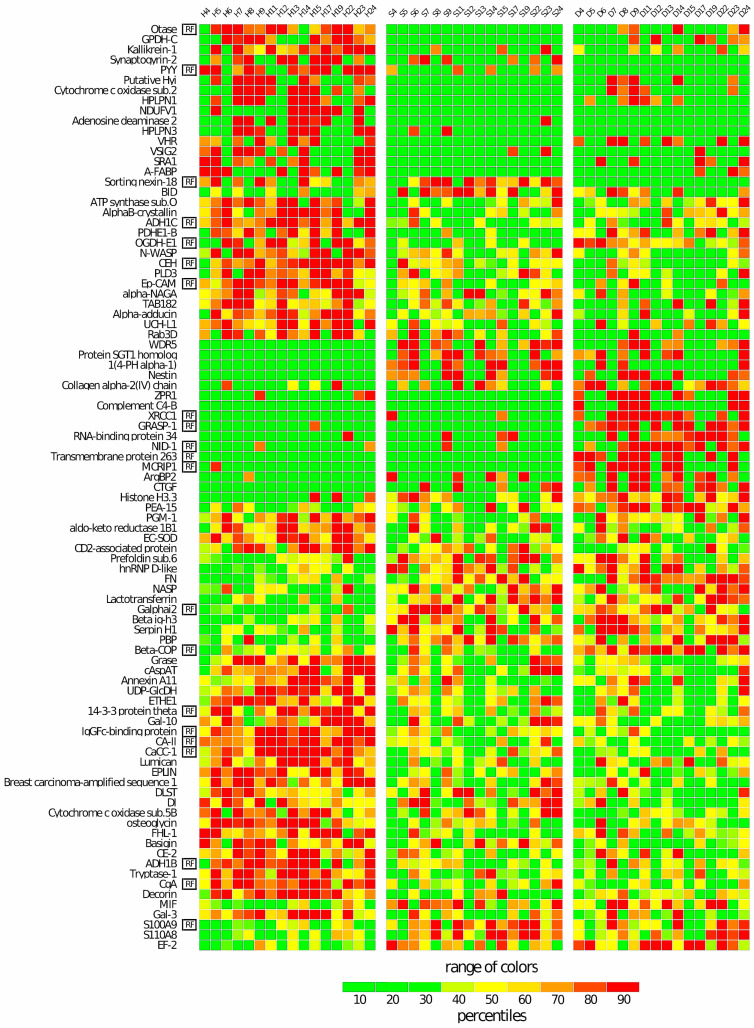
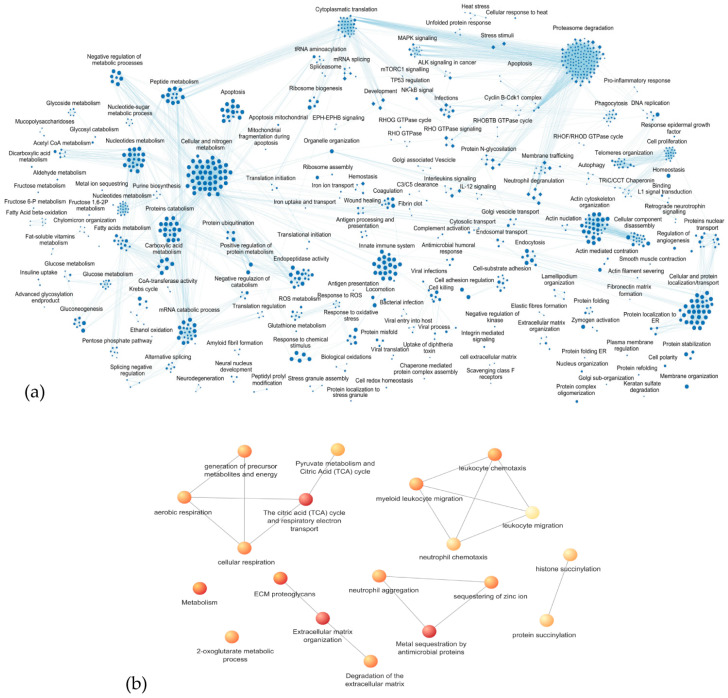
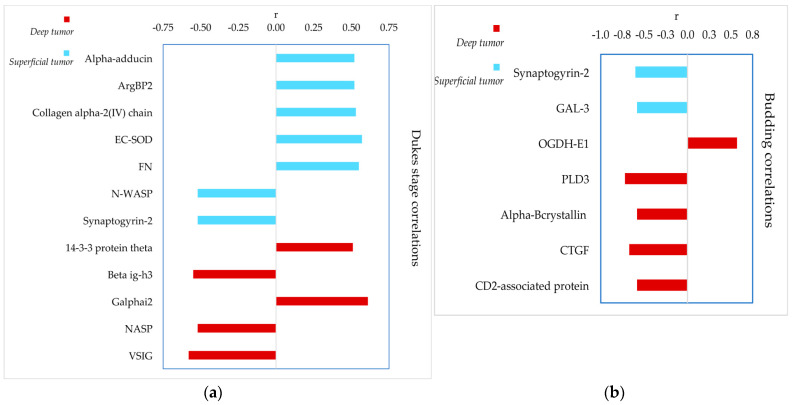
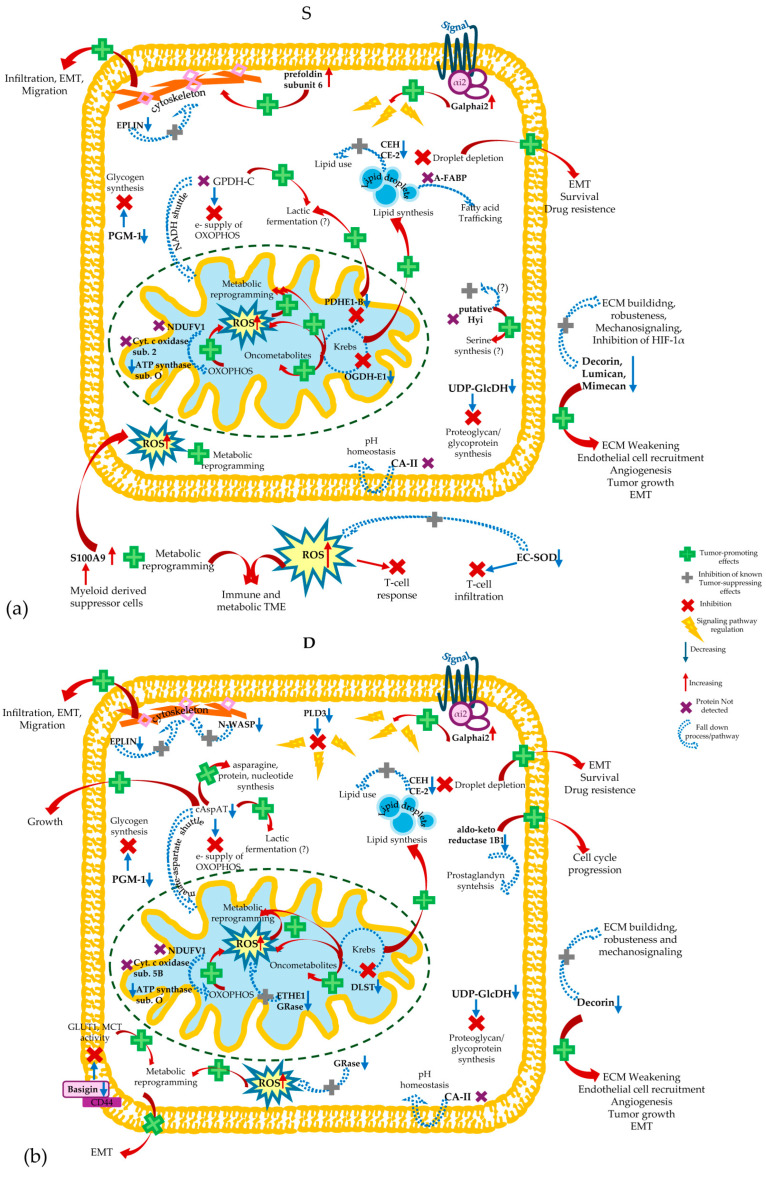
Colorectal cancer (CRC) is a frequent, worldwide tumor described for its huge complexity, including inter-/intra-heterogeneity and tumor microenvironment (TME) variability. Intra-tumor heterogeneity and its connections with metabolic reprogramming and epithelial-mesenchymal transition (EMT) were investigated with explorative shotgun proteomics complemented by a Random Forest (RF) machine-learning approach. Deep and superficial tumor regions and distant-site non-tumor samples from the same patients (n = 16) were analyzed. Among the 2009 proteins analyzed, 91 proteins, including 23 novel potential CRC hallmarks, showed significant quantitative changes. In addition, a 98.4% accurate classification of the three analyzed tissues was obtained by RF using a set of 21 proteins. Subunit E1 of 2-oxoglutarate dehydrogenase (OGDH-E1) was the best classifying factor for the superficial tumor region, while sorting nexin-18 and coatomer-beta protein (beta-COP), implicated in protein trafficking, classified the deep region. Down- and up-regulations of metabolic checkpoints involved different proteins in superficial and deep tumors. Analogously to immune checkpoints affecting the TME, cytoskeleton and extracellular matrix (ECM) dynamics were crucial for EMT. Galectin-3, basigin, S100A9, and fibronectin involved in TME-CRC-ECM crosstalk were found to be differently variated in both tumor regions. Different metabolic strategies appeared to be adopted by the two CRC regions to uncouple the Krebs cycle and cytosolic glucose metabolism, promote lipogenesis, promote amino acid synthesis, down-regulate bioenergetics in mitochondria, and up-regulate oxidative stress. Finally, correlations with the Dukes stage and budding supported the finding of novel potential CRC hallmarks and therapeutic targets.
Keywords: CRC proteomics; GRASP-1; ROS; S100A9; basigin; extracellular matrix; galectin-3; intra-tumor heterogeneity; mitochondrial metabolism; sorting nexin-18.
Conflict of interest statement
The authors declare no conflicts of interest. The funders had no role in the design of the study; in the collection, analyses, or interpretation of data; in the writing of the manuscript; or in the decision to publish the results.
Figures
References
-
- WHO Cancer. [(accessed on 20 March 2024)]. Available online: https://www.who.int/news-room/fact-sheets/detail/cancer.
-
- Árnadóttir S.S., Mattesen T.B., Vang S., Madsen M.R., Madsen A.H., Birkbak N.J., Bramsen J.B., Andersen C.L. Transcriptomic and Proteomic Intra-Tumor Heterogeneity of Colorectal Cancer Varies Depending on Tumor Location within the Colorectum. PLoS ONE. 2020;15:e0241148. doi: 10.1371/journal.pone.0241148. - DOI - PMC - PubMed
Publication types
MeSH terms
Grants and funding
LinkOut - more resources
Full Text Sources
Medical
Molecular Biology Databases
Miscellaneous
