. 2024 Aug 13;13(16):1339.
doi: 10.3390/cells13161339.

Enhancing Maturation and Translatability of Human Pluripotent Stem Cell-Derived Cardiomyocytes through a Novel Medium Containing Acetyl-CoA Carboxylase 2 Inhibitor

Affiliations

Enhancing Maturation and Translatability of Human Pluripotent Stem Cell-Derived Cardiomyocytes through a Novel Medium Containing Acetyl-CoA Carboxylase 2 Inhibitor

Cláudia Correia et al. Cells. .

Abstract

Human pluripotent stem cell-derived cardiomyocytes (hPSC-CMs) constitute an appealing tool for drug discovery, disease modeling, and cardiotoxicity screening. However, their physiological immaturity, resembling CMs in the late fetal stage, limits their utility. Herein, we have developed a novel, scalable cell culture medium designed to enhance the maturation of hPSC-CMs. This medium facilitates a metabolic shift towards fatty acid utilization and augments mitochondrial function by targeting Acetyl-CoA carboxylase 2 (ACC2) with a specific small molecule inhibitor. Our findings demonstrate that this maturation protocol significantly advances the metabolic, structural, molecular and functional maturity of hPSC-CMs at various stages of differentiation. Furthermore, it enables the creation of cardiac microtissues with superior structural integrity and contractile properties. Notably, hPSC-CMs cultured in this optimized maturation medium display increased accuracy in modeling a hypertrophic cardiac phenotype following acute endothelin-1 induction and show a strong correlation between in vitro and in vivo target engagement in drug screening efforts. This approach holds promise for improving the utility and translatability of hPSC-CMs in cardiac disease modeling and drug discovery.

Keywords: acetyl-CoA carboxylase 2 (ACC2); cardiac hypertrophy; human pluripotent stem cell-derived cardiomyocyte (hPSC-CM) maturation; in vitro-to-in vivo correlation; translatable in vitro model.


Conflict of interest statement

C.C., J.C., S.T., S.E-H., M.M-G., S.N., G.M., M.R., M.S., I.S.B, Q-D.W., K.J. and D.S. are employees of AstraZeneca. B.N. is a previous employee of AstraZeneca and is now an employee of NovoNordisk. P.D. is an employee of SciCross AB. M.J., R.B.R., A.H., and J.S. declare no conflicts of interest.

Figures
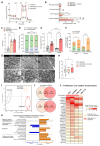
Figure 1
Figure 1
Maturation medium improves mitochondrial function and oxidative metabolism of hiPSC-CMs. (AF) Bioenergetics measurements of hiPSC-CMs cultured in standard (grey), maturation medium (red) and maturation medium without (w/o) ACC2i (orange) by Seahorse extracellular flux analyzer (n = 3–4 batches per group). (A) Representative kinetics of the oxygen consumption rate (OCR) during mitochondrial stress test. Cells were treated with the ATP synthase inhibitor Oligomycin (Oligo), the respiratory uncoupler (DNP), and the respiratory chain blockers rotenone and antimycin A (R/A). (B) Proportion of OCR due to non-mitochondrial oxygen consumption, proton leak, ATP production, and reserve capacity. (C) OCR/ECAR ratio. (D) Sensitivity of basal mitochondrial respiration to etomoxir as a measurement of % of OCR related to FA oxidation. (E,F) Comparison of basal OCR (E), mitochondrial ATP production, and glycolytic ATP production (F) after one and two weeks in culture in standard vs. maturation medium. (G) Representative TEM images of mitochondria in hiPSC-CMs cultured in standard medium, maturation medium, and maturation medium w/o ACC2i. Scale bars: 1 µm and 500 nm. (H) Quantification of mitochondrial content using total mitochondria area per TEM image. Data collected from 40 images per condition, with a minimum of 10 mitochondria per image. (I) Two-dimensional principal component analysis using RNA-seq data of hiPSC-CMs cultured in standard, maturation, and maturation medium w/o ACC2i. (J) Venn diagrams of overlapping DEGs (FDR < 0.05 and |log2 FC| > 1). (K) Significantly activated canonical pathways and disease functions associated with CM development, function, and metabolism comparing maturation medium vs. maturation medium w/o ACC2i using IPA analysis. (L) Heatmap depicting changes in the RNA-seq expression of FAO and oxidative phosphorylation-related genes across three hiPSC lines, comparing maturation or maturation w/o ACC2i vs. standard medium. Color scale shows only positive values since only upregulation was observed for these genes. Statistical analyses were performed by one-way ANOVA with Tukey’s multiple comparisons test in A-H. Data are presented as mean ± SEM. * p < 0.05, ** p < 0.01, *** p < 0.001, and **** p < 0.0001.
Figure 2
Figure 2
Maturation medium enhances Ca2+ handling properties of hiPSC-CMs. (A) Representative Ca2+ transients recorded by EarlyTox Cardiotoxicity calcium dye for iCell CMs2. Quantification of Ca2+ transient amplitude (B), upstroke velocity (C), decay velocity (D), and peak width at 70% duration (PWD 70%) (E). Each tracer is an average normalized change in fluorescence (F − F0)/F0 versus time plot from multiple peaks, where F means fluorescence intensity and F0 basal fluorescence. Panels B–D are represented as fold change using the standard medium experimental group as a reference. (F) Fold change in expression of sarcoplasmic reticulum (SR) genes involved in Ca2+ handling and beta-adrenergic receptors depicting a general increase in hiPSC-CMs cultured in maturation medium with greater differences in the hiPSC C32 cell line. Only statistically significant genes with FDR < 0.05 and |log2 FC| > 0.2 are represented. ATP2A2 or SERCA2a, sarco/endoplasmic reticulum Ca2+-ATPase; PLN, phospholamban; RYR2, ryanodine receptor 2; JPH2, junctophilin 2. Statistical analyses were performed by one-way ANOVA with Tukey’s multiple comparisons. Data are presented as mean ± SEM. * p < 0.05, ** p < 0.01, and **** p < 0.0001. Colors in all panels correspond to standard (grey), maturation medium w/o ACC2i (orange), and maturation medium (red).
Figure 3
Figure 3
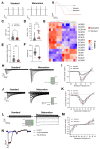
HiPSC—CMs cultured in maturation medium preserve a ventricular phenotype and show more mature electrophysiological properties. Patch-clamp analysis of iCell CMs2 cultured in standard medium (grey) and maturation medium (red) showing improved diastolic membrane potential, upstroke velocity, and inward rectifier (IK1) current in maturation medium. (A,B) Representative action potential (AP) traces from single spontaneously beating hiPSC-CMs. (C) Maximum diastolic potential (MDP). (D) AP upstroke velocity (dV/dtmax). (E) Depolarization rate. (F) AP duration at 90% repolarization. (G) Heatmap representing expression levels of key cardiac ion channels in hiPSC-CMs cultured in both standard and maturation media. (H) Representative Na+ current (INa) peak. Inset: voltage − clamp protocol. (I) Current–voltage relationship for INa (n = 17 maturation medium, n = 12 standard medium). (J) Representative Ca2+ current (ICa,L) peak. Inset: voltage-clamp protocol. (K) Current–voltage relationship for ICa,L (n = 15 maturation medium, n = 9 standard media). (L) Large inward rectifier K+ current (IK1). Inset: voltage-clamp protocol. (M) Current–voltage relationship for IK1 (n = 18 maturation medium, n = 14 standard medium). (N) Representative IK1 traces in control and following the application of 100 µM BaCl2 and 10 µM ivabradine. Outward components of Ba2+ − sensitive IK1 and voltage protocol are given in insets. Statistical analyses were performed by unpaired Student’s t-tests relative to standard medium. Data are presented as mean ± SEM. * p < 0.05, ** p < 0.01, *** p < 0.001, and **** p < 0.0001.
Figure 4
Figure 4
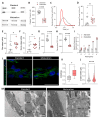
Maturation medium induces morphological and ultrastructural maturation in hiPSC-CMs. (A) Representative phase contrast and confocal fluorescent images of α-sarcomeric actinin, cardiac troponin T (cTnT) and connexin 43 staining in cells cultured in standard and maturation medium. Scale bars: 100 µm (phase contrast), 50 µm (α-sarcomeric actinin and cTnT), and 20 µm (connexin 43). (BD) Cell structure characterization in terms of length-to-width ratio (B), circularity index (C), and cell area (D). (E) Quantification of sarcomere anisotropy as a measurement of alignment based on α-sarcomeric actinin staining. (F) Representative TEM images showing more organized and aligned sarcomere structures of hiPSC-CMs cultured in maturation medium vs. standard medium. Scale bars: 2 µM (top row) and 500 nm (bottom row). (G) Sarcomere content based on quantification of Z-band area in TEM images. (H) Expression levels of GJA1 gene (coding connexin 43 (Cx43) protein). Comparison of the total intensity of Cx43 immunostaining per cell (I) and intensity of Cx43 co-localized in the plasma membrane per cell. The plasma membrane was visualized using CellBrite membrane dye (J). (K) Heatmap depicting expression levels of sarcomere genes. Statistical analyses were performed by unpaired Student’s t-tests relative to standard medium. Data are presented as mean ± SEM., ** p < 0.01, and **** p < 0.0001.
Figure 5
Figure 5
Maturation medium enhances contractile kinetics and structural integrity of hiPSC-CM 3D microtissues. Contractile force and kinetics measured using the Novoheart microtissue platform depict faster contractile kinetics and improved structural integrity in microtissues cultured in maturation medium. (A) Representative brightfield images of cardiac microtissues two weeks after culture in standard and maturation medium. (B) Passive tension measured at the last day of culture. (C) Representative contractility traces of cardiac microtissues paced at 1 Hz. (D) Quantification of contraction force. (E) Rising slope as a measurement of upstroke velocity. (F) Decay slope as a measurement of relaxation velocity. (G,H) Time to 90% rise and 90% decay, respectively. All measurements shown in C–H were acquired from microtissues paced at 1 HZ in Tyrode solution to provide comparable conditions. (I) Pacing frequency–beating frequency relationship showing that microtissues in maturation medium follow a short-term increase in pacing frequency in contrast to microtissues in standard medium. Microtissues were paced up to 4 Hz with increments of 1 HZ every 30 s. (J) Representative confocal fluorescent images of α-sarcomeric actinin in microtissues cultured for two weeks in standard and maturation medium. Scale bars: 25 µM. (K) Quantification of sarcomere anisotropy as a measurement of alignment based on α-sarcomeric actinin staining. (L) Quantification of sarcomere width as a measurement of myofibrillar density based on α-sarcomeric actinin staining. (M) Representative electron microscopy images of micro tissues cultured in either standard or maturation medium highlighting increased sarcomere and mitochondria content with maturation medium. Scale bars: 2 µM and 500 nm. Statistical analyses were performed by unpaired Student’s t-tests using standard medium as reference or one-way ANOVA with Tukey’s multiple comparisons. n = 12 microtissues were used. Data are presented as mean ± SEM. * p < 0.05, and **** p < 0.0001.
Figure 6
Figure 6
Matured hiPSC-CMs show improved ability to develop hypertrophy features after endothelin-1 (ET-1) stimulation. (A) Representative phase contrast images of hiPSC-CMs in standard and maturation medium with and without ET-1 treatment for 48 h. Scale bar: 100 µm. (B,C) Cell structure characterization in terms of length-to-width ratio (B) and cell area (C) comparing non-treated and ET-1-treated cells cultured either in standard or maturation medium. (D) Venn diagrams of upregulated (top) and downregulated (bottom) DEGs between ET-1-treated and non-treated hiPSC-CMs in both culture media. (E) Significantly activated and inhibited gene expression linked to canonical pathways and disease functions induced by ET-1 treatment in hiPSC-CMs. Terms related to CM hypertrophy, signaling, and metabolism were selected for representation. (F) Normalized expression levels of genes associated with cardiac hypertrophy signaling. (G) Lactate concentration in the supernatant upon 48 h stimulation with ET-1. Statistical analyses were performed by unpaired Student’s t-tests using standard medium as reference or one-way ANOVA with Tukey’s multiple comparisons. Data are represented as mean ± SEM. * p < 0.05; ** p < 0.01; *** p < 0.001; and **** p < 0.0001.
Figure 7
Figure 7
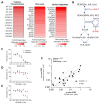
Maturation medium improves correlation between in vitro and in vivo target engagement in metabolic drug screening. (A) Heatmap of fold change in expression of genes involved in oxidative phosphorylation, TCA cycle, and BCAA catabolism in cells cultured in maturation medium compared to standard medium, as assessed by RNA-seq. Only genes with FDR < 0.05 are represented. (B) Schematic overview of BCAA catabolism pathway highlighting the key enzymes inhibited in the ketovaline assay: branched-chain amino acid transaminases (BCATs) and branched-chain keto acid dehydrogenase kinase (BCKDK). (CE) Dose responses on ketovaline concentration as a functional read-out of BCAT inhibition (C) and BCKDK inhibition with two inhibitors: BCKDKi-1 (D) and BCKDKi-2 (E) in standard and maturation medium-treated hiPSC-CMs. (F) Correlation between in vitro IC50 of ketovaline concentration in hiPSC-CMs cultured in maturation medium and in vivo IC50 of branched-chain α-keto acid (BCKA) concentration in rat plasma for 21 different BCKDK inhibitors (circles). The dotted lines represent a unity of 3 times in correlation between in vitro and in vivo IC50 values. Pearson correlation shows a significant positive correlation between in vitro and in vivo values.

References

    1. Seibertz F., Sutanto H., Dülk R., Pronto J.R.D., Springer R., Rapedius M., Liutkute A., Ritter M., Jung P., Stelzer L., et al. Electrophysiological and Calcium-Handling Development during Long-Term Culture of Human-Induced Pluripotent Stem Cell-Derived Cardiomyocytes. Basic. Res. Cardiol. 2023;118:14. doi: 10.1007/s00395-022-00973-0. - DOI - PMC - PubMed
    1. Lewandowski J., Rozwadowska N., Kolanowski T.J., Malcher A., Zimna A., Rugowska A., Fiedorowicz K., Łabędź W., Kubaszewski Ł., Chojnacka K., et al. The Impact of in Vitro Cell Culture Duration on the Maturation of Human Cardiomyocytes Derived from Induced Pluripotent Stem Cells of Myogenic Origin. Cell Transpl. 2018;27:1047–1067. doi: 10.1177/0963689718779346. - DOI - PMC - PubMed
    1. Wang L., Wada Y., Ballan N., Schmeckpeper J., Huang J., Rau C.D., Wang Y., Gepstein L., Knollmann B.C. Triiodothyronine and Dexamethasone Alter Potassium Channel Expression and Promote Electrophysiological Maturation of Human-Induced Pluripotent Stem Cell-Derived Cardiomyocytes. J. Mol. Cell Cardiol. 2021;161:130–138. doi: 10.1016/j.yjmcc.2021.08.005. - DOI - PMC - PubMed
    1. Yang X., Rodriguez M., Pabon L., Fischer K.A., Reinecke H., Regnier M., Sniadecki N.J., Ruohola-Baker H., Murry C.E. Tri-Iodo-l-Thyronine Promotes the Maturation of Human Cardiomyocytes-Derived from Induced Pluripotent Stem Cells. J. Mol. Cell Cardiol. 2014;72:296–304. doi: 10.1016/j.yjmcc.2014.04.005. - DOI - PMC - PubMed
    1. Birket M.J., Ribeiro M.C., Kosmidis G., Ward D., Leitoguinho A.R., van de Pol V., Dambrot C., Devalla H.D., Davis R.P., Mastroberardino P.G., et al. Contractile Defect Caused by Mutation in MYBPC3 Revealed under Conditions Optimized for Human PSC-Cardiomyocyte Function. Cell Rep. 2015;13:733–745. doi: 10.1016/j.celrep.2015.09.025. - DOI - PMC - PubMed

Publication types

MeSH terms

LinkOut - more resources