. 2024 Sep;3(9):1123-1139.
doi: 10.1038/s44161-024-00525-w. Epub 2024 Aug 15.

An engineered human cardiac tissue model reveals contributions of systemic lupus erythematosus autoantibodies to myocardial injury

Affiliations

An engineered human cardiac tissue model reveals contributions of systemic lupus erythematosus autoantibodies to myocardial injury

Sharon Fleischer et al. Nat Cardiovasc Res. 2024 Sep.

Abstract

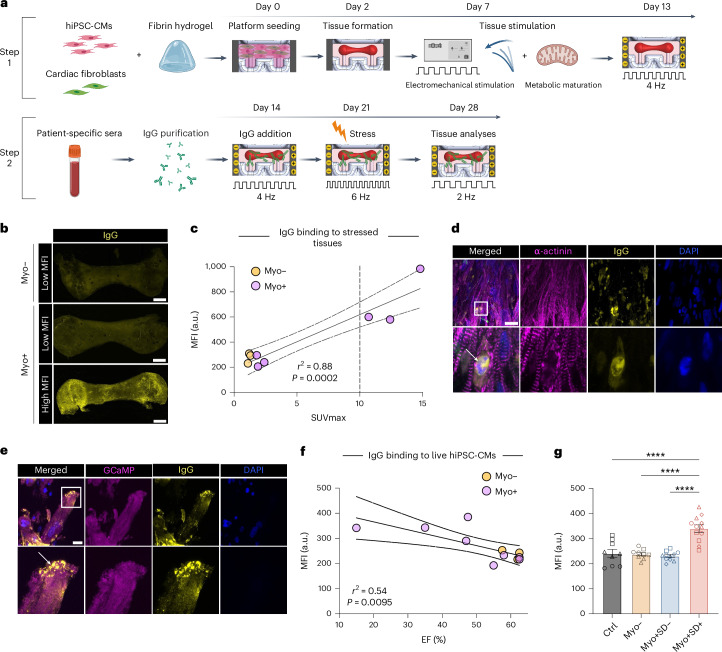
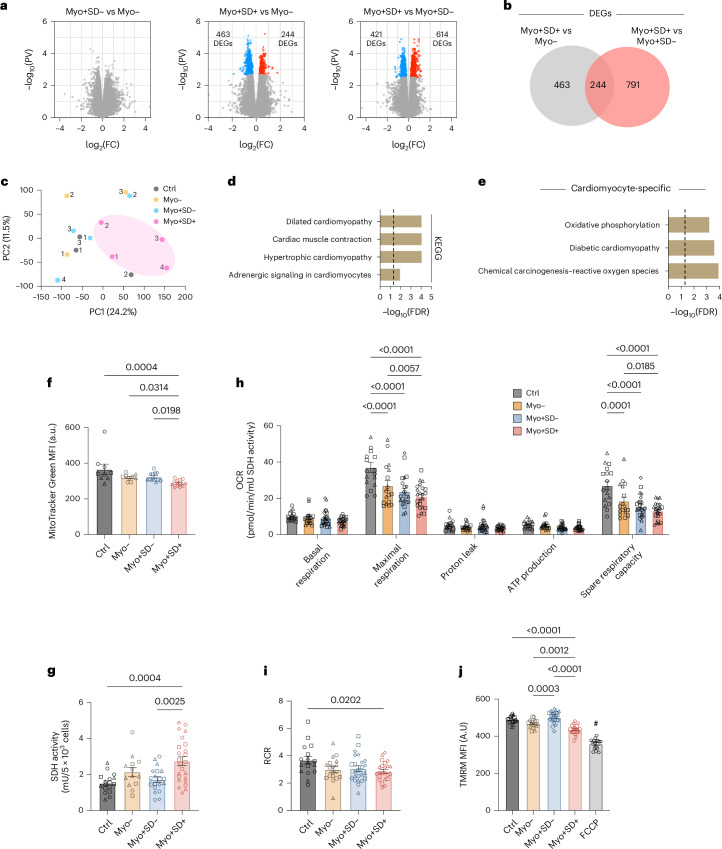
Systemic lupus erythematosus (SLE) is a heterogenous autoimmune disease that affects multiple organs, including the heart. The mechanisms of myocardial injury in SLE remain poorly understood. In this study, we engineered human cardiac tissues and cultured them with IgG from patients with SLE, with and without myocardial involvement. IgG from patients with elevated myocardial inflammation exhibited increased binding to apoptotic cells within cardiac tissues subjected to stress, whereas IgG from patients with systolic dysfunction exhibited enhanced binding to the surface of live cardiomyocytes. Functional assays and RNA sequencing revealed that, in the absence of immune cells, IgG from patients with systolic dysfunction altered cellular composition, respiration and calcium handling. Phage immunoprecipitation sequencing (PhIP-seq) confirmed distinctive IgG profiles between patient subgroups. Coupling IgG profiling with cell surfaceome analysis identified four potential pathogenic autoantibodies that may directly affect the myocardium. Overall, these insights may improve patient risk stratification and inform the development of new therapeutic strategies.


Conflict of interest statement

The authors declare no competing interests.

Figures

Fig. 1
Fig. 1. Overview of the experimental design.
Figure was created using BioRender.
Fig. 2
Fig. 2. Distinct patient IgG reactivity with engineered cardiac tissues and hiPSC-CMs corresponds with specific clinical outcomes.
a, Overview of tissue formation, stimulation and treatment with purified patient sera-derived IgG. Each tissue was cultured with IgG from one specific patient. b, Immunofluorescence staining of human IgG (yellow) derived from patient sera and bound to engineered cardiac tissues (scale bar, 500 μm). c, Linear correlation between patient IgG binding levels to engineered cardiac tissues (MFI) and clinical measurements of myocardial inflammation (18F-FDG uptake quantified as SUVs). Each dot represents a patient (n = 9), and dots with SUVmax > 10 represent patients with elevated myocardial inflammation. P value and r2 were calculated by two-tailed Pearson’s correlation analysis. d,e, Immunofluorescence staining of engineered cardiac tissues showing strong sera-derived IgG binding to condensed nuclei (d; scale bar, 20 μm; bottom panels are higher magnification of region of interest in top panels; top panel is confocal maximum intensity projection; bottom panel is single confocal plane) and apoptotic blebs on the cell surface (e; scale bar, 20 μm; bottom panels are higher magnification of region of interest in top panels; both panels are single confocal planes). f, Linear correlation between patient IgG binding levels to the cell surface of live hiPSC-CMs (MFI) and corresponding patient EF. Each dot represents a patient (n = 11). P value and r2 were calculated by two-tailed Pearson’s correlation analysis. g, Quantification using flow cytometry of patient IgG binding to live hiPSC-CMs based on clinical subgroupings. MFI indicates median fluorescence intensity. Data are represented as mean ± s.e.m. n = 3 healthy control patients, n = 3 Myo− patients, n = 4 Myo+SD− patients and n = 4 Myo+SD+ patients (n = 2–3 independent replicate wells per patient sample; exact replicate values are included in Supplementary Table 1). Symbol shapes represent different patients within each group; one-way ANOVA with Tukey’s test for multiple comparisons; ****P < 0.0001. Ctrl, control.
Fig. 3
Fig. 3. IgGs from Myo+SD+ patients alter engineered cardiac tissue function and composition.
a, Representative bright-field images of engineered cardiac tissues after 14 days of culture with patient-specific purified IgG showing overall tissue morphology for each subgroup (scale bar, 500 μm). b, Representative immunofluorescence images of engineered cardiac tissue stained to show cardiomyocytes (α-actinin, red) and fibroblasts (vimentin, yellow) after 14 day culture with patient-specific IgG (scale bar, 50 μm). c, Quantification of the percentage of Ki-67-positive human cardiac fibroblasts after treatment with patient IgG; n = 3 healthy controls, n = 3 Myo− patients, n = 4 Myo+SD− patients and n = 4 Myo+SD+ patients (n = 8–12 independent replicate wells per patient sample; exact replicate values are included in Supplementary Table 1). d, Representative traces of calcium flux in engineered cardiac tissues after treatment with patient IgG. Values for each curve were normalized to the maximum value. e,f, Quantification of the percent change of the parameters tau (e) and FWHM (f) extracted from engineered cardiac tissue calcium transients after treatment with patient IgG compared to baseline. n = 3 healthy controls, n = 3 Myo− patients, n = 4 Myo+SD− patients and n = 4 Myo+SD+ patients (n = 4–6 independent replicate tissues per patient sample; exact replicate values are included in Supplementary Table 1). Data are represented as mean ± s.e.m. Symbol shapes represent different patients within each group. Statistical significance was determined by ordinary one-way ANOVA with Tukey’s test for multiple comparisons. CF, cardiac fibroblast; Ctrl, control; MFI, mean fluorescence intensity.
Fig. 4
Fig. 4. IgGs isolated from Myo+SD+ patients alter tissue transcriptomics, mitochondrial content and respiration.
a, Volcano plots depicting the DEGs between tissues cultured with patient IgG from different clinical subgroups. Statistical significance was determined by two-sided Student’s t-test with Benjamini–Hochberg correction for multiple comparisons. Genes that were significantly upregulated (FDR < 0.05) are shown in red, and genes that were significantly downregulated (FDR < 0.05) are shown in blue. b, Venn diagram describing the number of DEGs between tissues treated with IgG from Myo+SD+ patients and IgG from either Myo− patients or Myo+SD− patients and the overlapping DEGs. c, PCA plot of global gene expression profiles for tissues treated with IgG from different patients with SLE and healthy controls. Each point represents the average expression of n = 3 independent tissues treated with IgG from the same patient. d, KEGG analysis of DEGs between tissues treated with IgG from Myo+SD+ patients and IgG from Myo+SD− patients. e, KEGG analysis of cardiomyocyte population DEGs between tissues treated with IgG from Myo+SD+ patients and IgG from Myo+SD− patients. f, Changes in hiPSC-CM mitochondrial quantity in response to patient IgG and measured by the MitoTracker Green probe. Ordinary one-way ANOVA with Dunn’s post hoc comparisons test. g, Changes in SDH activity in hiPSC-CMs in response to patient IgG. Ordinary one-way ANOVA with Tukey’s test for multiple comparisons. h, Characterization of IgG effect on mitochondrial respiration in hiPSC-CMs by Seahorse metabolic flux assay. OCR values were normalized to SDH activity. Ordinary two-way ANOVA with Tukey’s test for multiple comparisons. i, Changes in hiPSC-CM RCR in response to patient IgG. Ordinary one-way ANOVA with Tukey’s test for multiple comparisons. j, Changes in hiPSC-CM mitochondrial membrane potential in response to IgG, measured with the TMRM probe. Ordinary one-way ANOVA with Tukey’s test for multiple comparisons; #P < 0.0001 for comparison of the FCCP group to each other patient group. Data are represented as mean ± s.e.m. n = 3 healthy controls, n = 3 Myo− patients, n = 4 Myo+SD− patients and n = 4 Myo+SD+ patients, with n = 3 independent tissues per patient (a), n = 3 wells per patient (f) or n = 4–6 independent replicate wells per patient sample (gj). Exact replicate values are included in Supplementary Table 1. Symbol shapes represent different patients within each group. Ctrl, control; FC, fold change; PC, principal component; PV, P value.
Fig. 5
Fig. 5. Identification of unique and potentially pathogenic autoantibody populations in Myo+SD+ patient serum.
a, PCA plot of differential antigen targets. b, Venn diagram describing the number of antigen targets in each SLE patient subgroup and their overlap. c, Venn diagrams describing the number of cardiomyocytes and cardiac fibroblast-specific surface proteins and their overlap, representing shared surface proteins. d, Heatmap of potential Myo+SD+ pathogenic autoantibodies targeting cardiac cell surface antigens. e, Linear correlation between patient EF and corresponding read counts of LMO7. P value and r2 were calculated by two-tailed Pearson’s correlation analysis. Ctrl, control; PC, principal component.

Update of

References

    1. Guglin, M., Smith, C. & Rao, R. The spectrum of lupus myocarditis: from asymptomatic forms to cardiogenic shock. Heart Fail. Rev.26, 553–560 (2021). 10.1007/s10741-020-10054-w - DOI - PubMed
    1. Appenzeller, S., Pineau, C. A. & Clarke, A. E. Acute lupus myocarditis: clinical features and outcome. Lupus20, 981–988 (2011). 10.1177/0961203310395800 - DOI - PubMed
    1. Thomas, G. et al. Lupus myocarditis: initial presentation and longterm outcomes in a multicentric series of 29 patients. J. Rheumatol.44, 24–32 (2017). 10.3899/jrheum.160493 - DOI - PubMed
    1. Bartels, C. M. et al. Mortality and cardiovascular burden of systemic lupus erythematosus in a US population-based cohort. J. Rheumatol.41, 680–687 (2014). 10.3899/jrheum.130874 - DOI - PMC - PubMed
    1. Hak, A. E., Karlson, E. W., Feskanich, D., Stampfer, M. J. & Costenbader, K. H. Systemic lupus erythematosus and the risk of cardiovascular disease: results from the Nurses’ Health Study. Arthritis Rheum.61, 1396–1402 (2009). 10.1002/art.24537 - DOI - PMC - PubMed