. 2024 Jan;3(1):28-45.
doi: 10.1038/s44161-023-00392-x. Epub 2024 Jan 4.

ATF3 coordinates the survival and proliferation of cardiac macrophages and protects against ischemia-reperfusion injury

Affiliations

ATF3 coordinates the survival and proliferation of cardiac macrophages and protects against ischemia-reperfusion injury

Yihui Shao et al. Nat Cardiovasc Res. 2024 Jan.

Abstract

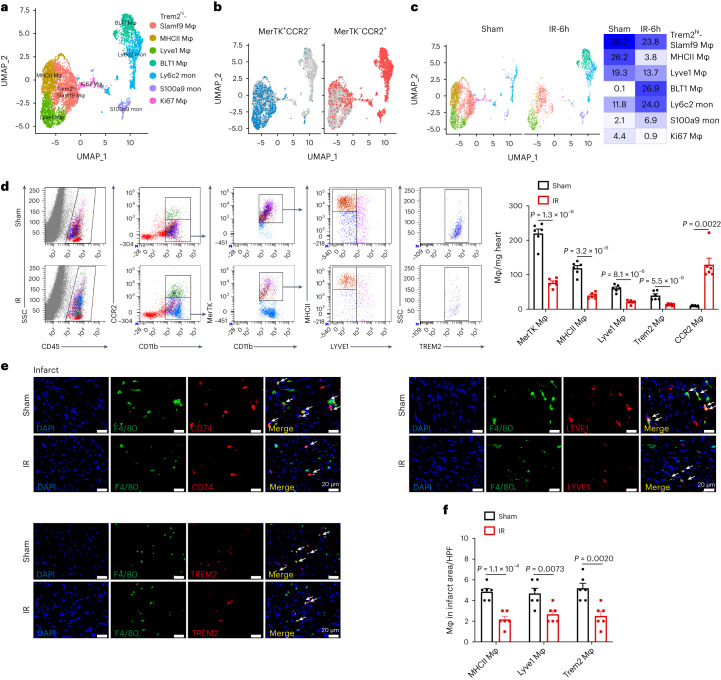
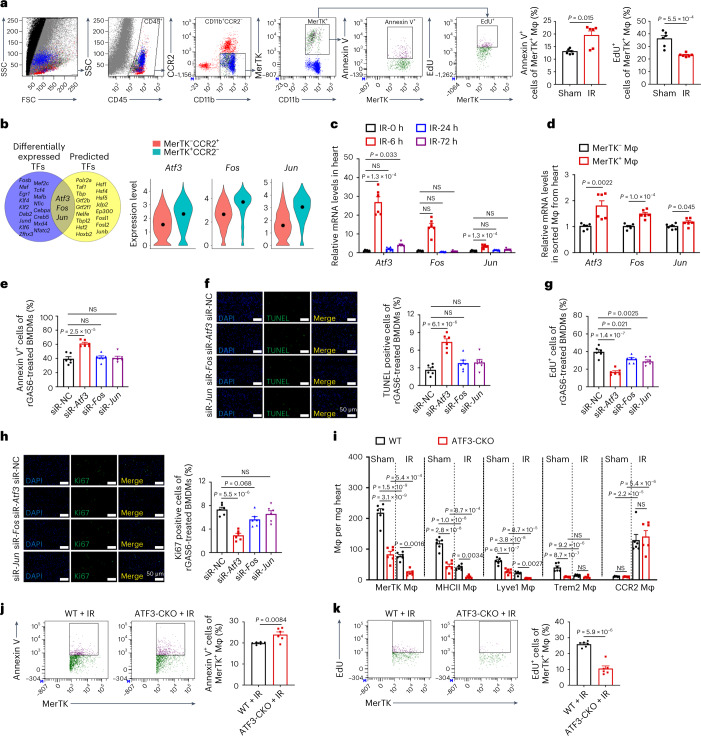
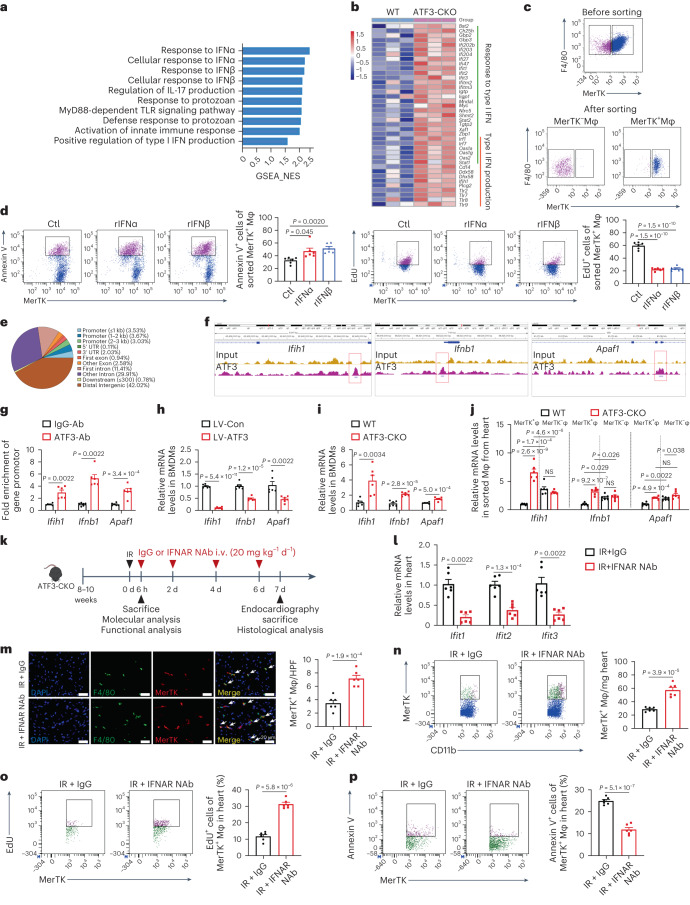
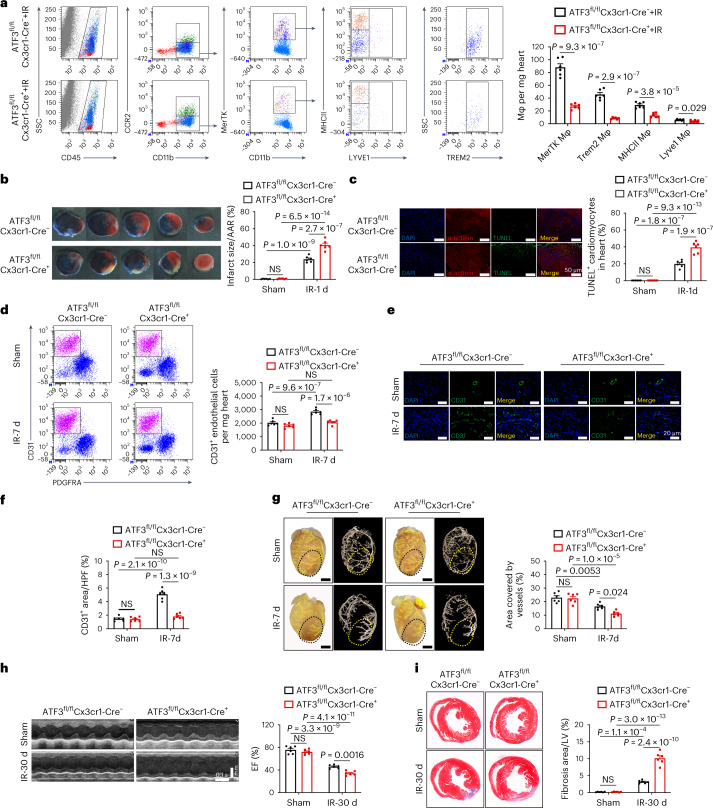
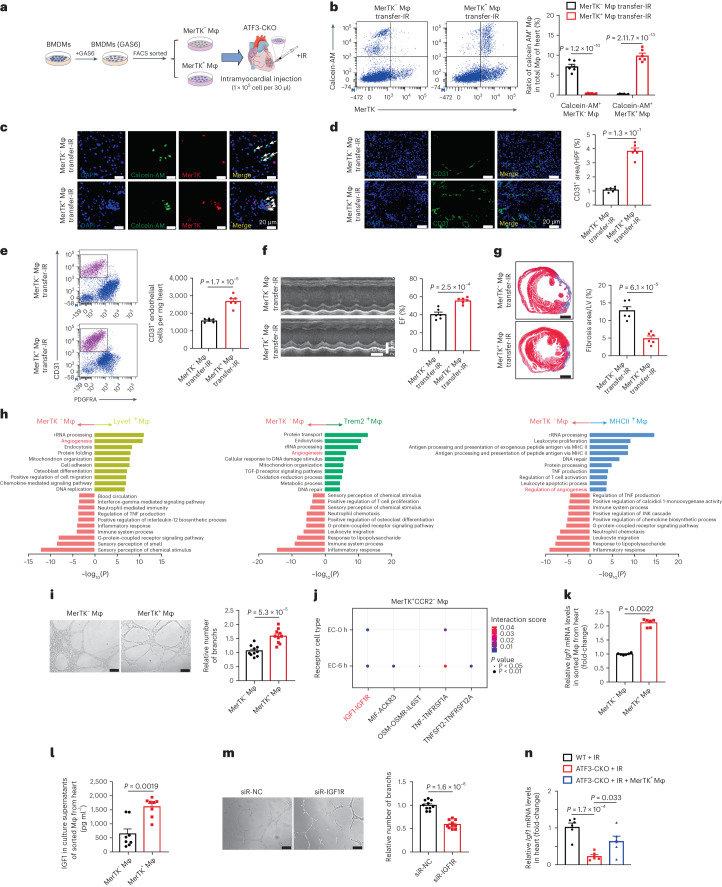
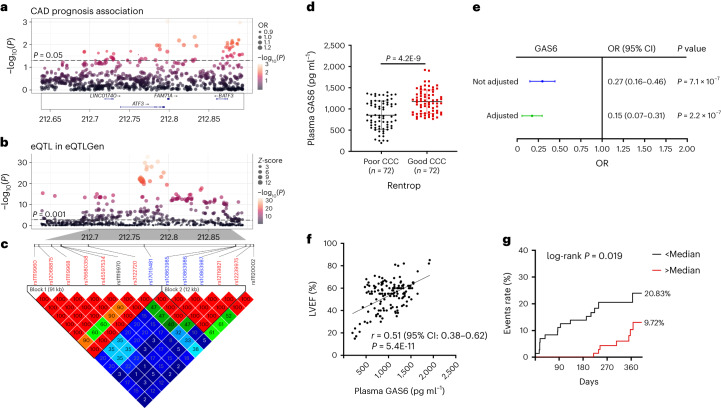
Cardiac resident MerTK+ macrophages exert multiple protective roles after ischemic injury; however, the mechanisms regulating their fate are not fully understood. In the present study, we show that the GAS6-inducible transcription factor, activating transcription factor 3 (ATF3), prevents apoptosis of MerTK+ macrophages after ischemia-reperfusion (IR) injury by repressing the transcription of multiple genes involved in type I interferon expression (Ifih1 and Ifnb1) and apoptosis (Apaf1). Mice lacking ATF3 in cardiac macrophages or myeloid cells showed excessive loss of MerTK+ cardiac macrophages, poor angiogenesis and worse heart dysfunction after IR, which were rescued by the transfer of MerTK+ cardiac macrophages. GAS6 administration improved cardiac repair in an ATF3-dependent manner. Finally, we showed a negative association of GAS6 and ATF3 expression with the risk of major adverse cardiac events in patients with ischemic heart disease. These results indicate that the GAS6-ATF3 axis has a protective role against IR injury by regulating MerTK+ cardiac macrophage survival and/or proliferation.


Conflict of interest statement

The authors declare no competing interests.

Figures

Fig. 1
Fig. 1. Myocardial IR induces a reduction in MerTK+ cardiac macrophage proportions.
a, UMAP of seven macrophage (Mφ)/monocyte (mon) clusters identified via scRNA-seq analysis. b, UMAP visualization of MerTK+CCR2 and MerTKCCR2+ macrophages. c, Split UMAP of macrophage/monocyte clusters (left) and percentage of seven clusters (right) in the heart between sham operation and IR. d, Representative flow cytometry plots (left) and quantification (right) of MerTK+CCR2 macrophages and MerTKCCR2+ macrophages under sham operation and IR (n = 6 mice per group). e,f, Quantification (e) and colocalization (f) of IF signals of F4/80 and LYVE1, TREM2 and CD74 in cardiac infarct regions of the sham and IR (n = 6 mice per group). Scale bars, 20 μm. Statistical significance was evaluated using two-tailed, unpaired Student’s t-test (d: MerTK macrophage (Mφ), MHCII Mφ, Lyve1 Mφ, Trem2 Mφ; and f) or unpaired Mann–Whitney U-test (d: CCR2 Mφ). All data are presented as mean ± s.e.m. HPF, high-power field. Source data
Fig. 2
Fig. 2. ATF3 as a key determinant for MerTK+ resident macrophage survival and/or proliferation in response to IR.
a, Flow cytometry gating strategy and quantification of Annexin V+ and EdU+ cells in MerTK+ macrophages in the heart of the sham operation and IR groups (n = 6 mice per group). b, Overlap between differentially expressed TFs and RCisTarget-predicted TFs (left). Violin plots of normalized scRNA expression profiles of the three TFs in two types of macrophages (right). c, Relative mRNA expression of Atf3, Jun and Fos in the heart tissues at different time points after IR (n = 6 mice per group). d, Relative mRNA expression of Atf3, Jun and Fos in MerTK+ and MerTK macrophages sorted from the heart 6 h after IR (n = 6 mice per group). e, Flow cytometry analysis of Annexin V+ apoptotic cells in rGAS6-treated BMDMs transfected with the respective siRNAs (n = 6 biologically independent samples per group). f, Representative images (left) and quantification (right) of TUNEL-stained cells in rGAS6-treated BMDMs transfected with the respective siRNAs (n = 6 biologically independent samples per group). Scale bars, 50 μm. g, Flow cytometry analysis of EdU incorporation into rGAS6-treated BMDMs transfected with the respective siRNAs (n = 6 biologically independent samples per group). h, Representative images (left) and quantification (right) of Ki67+ cells in rGAS6-treated BMDMs transfected with the respective siRNAs (n = 6 biologically independent samples per group). Scale bars, 50 μm. i, Quantification of MerTK+, Trem2+, Lyve1+, MHCII+ and CCR2+ macrophages from the hearts of the two genotypes 6 h after sham operation and IR (n = 6 mice per group). j,k, Flow cytometry analysis of Annexin V+MerTK+ (j) and EdU+MerTK+ (k) macrophages in the heart of mice with two genotypes 6 h after IR (n = 6 mice per group). Statistical significance was evaluated via two-tailed, unpaired Student’s t-test (a, EdU; d, Fos, Jun; j and k), unpaired Mann–Whitney U-test (a, Annexin V; d, Atf3), Kruskal–Wallis test followed by Dunn’s multiple-comparison test (c), one-way ANOVA followed by Tukey’s multiple-comparison test (eh) and two-way ANOVA followed by Tukey’s multiple-comparison test (i). All data are presented as mean ± s.e.m. Source data
Fig. 3
Fig. 3. ATF3 controls MerTK+ macrophage fate via inhibiting type I IFN.
a, GSEA comparing rGAS6-stimulated BMDMs from ATF3-CKO and WT mice (n = 3 mice). NES, normalized enrichment score. b, Heatmap of DEGs in type I IFN signals. c,d, Flow cytometry analysis of Annexin V+ and EdU+ cells in sorted MerTK+ macrophages treated with rIFNα (c) or rIFNβ (d; n = 6 biologically independent samples). e, Pie chart of the percentage of peaks within each category bound by ATF3. f, Genome browser view of ChIP–seq tracks for ATF3 at the Ifih1, Ifnb1 and Apaf1 loci in BMDMs. g, ChIP–qPCR analysis of ATF3 binding to the Ifih1, Ifnb1 and Apaf1 promoter regions in BMDMs (n = 6 biologically independent samples). The signal was relative to the percentage input. h, Relative mRNA expression of Ifih1, Ifnb1 and Apaf1 in rGAS6-induced BMDMs infected with LV-Con or LV-ATF3 (n = 6 biologically independent samples). i, Relative mRNA expression of Ifih1, Ifnb1 and Apaf1 in rGAS6-stimulated BMDMs from ATF3-CKO and WT mice (n = 6 biologically independent samples). j, Relative mRNA expression of Ifih1, Ifnb1 and Apaf1 in MerTK+ and MerTK macrophages sorted from the heart of ATF3-CKO and WT mice 6 h after IR (n = 6 mice). k, Outline of IFNAR NAbs (20 mg kg−1 d−1) or IgG treatment in ATF3-CKO mice subjected to IR surgery. l, Relative mRNA expression of Ifit1, Ifit2 and Ifit3 in the hearts of the two groups (n = 6 mice). m, Representative IF images and quantification of MerTK+ macrophages in the hearts of the two groups (n = 6 mice). Scale bars, 20 μm. n, Representative flow cytometry plots and quantification of MerTK+ macrophages in the hearts of the two groups (n = 6 mice). o,p, Flow cytometry analysis of EdU+ (o) and Annexin V+ (p) cells in MerTK+ macrophages in the hearts of the two groups (n = 6 mice). Statistical significance was evaluated using two-tailed, unpaired Student’s t-test (g, Apaf1; h, Ifih1, Ifnb1; i and l, Ifit2; and mp), unpaired Mann–Whitney U-test (g, Ifih1, Ifnb1; h, Apaf1; l, Ifit1, Ifit3), one-way ANOVA followed by Tukey’s multiple-comparison test (d, EdU), Kruskal–Wallis test followed by Dunn’s multiple-comparison test (d, Annexin V) and two-way ANOVA followed by Tukey’s multiple-comparison test (j). All data are presented as mean ± s.e.m. Ctl, Control. Source data
Fig. 4
Fig. 4. Effect of cardiac resident, macrophage-specific ATF3 on cardiac injury and repair after IR.
a, Flow cytometry analysis (left) and quantification (right) of MerTK+, Trem2+, Lyve1+ and MHCII+ macrophages from the heart of ATF3fl/flCx3cr1-Cre and ATF3fl/flCx3cr1-Cre+ mice 6 h after IR (n = 6 mice per group). b, Representative images of Evans Blue and 2,3,5-triphenyltetrazolium chloride staining in the heart of mice with two genotypes 1 d after IR. Infarct size was calculated as a percentage of the myocardial area at risk (n = 6 mice per group). c, Representative images (left) and quantification (right) of TUNEL+α-actinin+ cardiomyocytes in the heart of mice with the two genotypes 1 d after IR (n = 6 mice per group). Scale bars, 50 μm. d, Flow cytometry analysis (left) and quantification (right) of CD45PDGFRαCD31+ ECs in the hearts of mice with the two genotypes (n = 6 mice per group). e,f, Representative IF images (e) and quantification (f) of CD31+ cells in the cardiac border area of mice with the two genotypes (n = 6 mice per group). Scale bars, 20 μm. g, Representative images (left) and quantification (right) of Microfil vascular casting and micro-CT in the hearts of mice with the two genotypes 7 d after IR (n = 6 mice per group). Scale bars, 1 mm. h, Representative echocardiographic images (left) and EF (right) of mice with the two genotypes 30 d after IR (n = 6 mice per group). i, Representative images (left) and quantification (right) of cardiac fibrosis of mice with the two genotypes 30 d after IR (n = 6 mice per group). Scale bar, 1 mm. Statistical significance was evaluated using two-tailed, unpaired Student’s t-test (a) and two-way ANOVA followed by Tukey’s multiple-comparison test (bd and fi). All data are presented as mean ± s.e.m. Source data
Fig. 5
Fig. 5. MerTK+ macrophage transfer restores cardiac repair in ATF3-CKO mice.
a, Scheme showing sorted MerTKand MerTK+ macrophages transferred into ATF3-CKO mice via intramyocardial injection. b,c, Flow cytometry analysis (b) and immunostaining (c) of Calcein AM+MerTK and Calcein AM+MerTK+ macrophages in hearts of ATF3-CKO mice transferred with MerTK or MerTK+ macrophages (n = 6 mice per group). Scale bars, 20 μm. dg, Immunostaining (d) and flow cytometry analysis (e) of CD31+ ECs, EF (f) and fibrosis (g) in the hearts of the two groups (n = 6 mice per group). h, GO enrichment analysis based on upregulated DEGs in sorted Trem2+, MHCII+ and Lyve1+ macrophages compared with MerTK macrophages. i, Tube formation assay in ECs cocultured with sorted MerTK+ and MerTK macrophages (n = 10 biologically independent samples per group). Scale bar, 100 μm. j, Predicted interactions between MerTK+ cardiac macrophage-derived ligands and receptors expressed on ECs using CellChat receptor–ligand interaction analysis. k, Relative mRNA expression of Igf1 in sorted MerTK+ and MerTK macrophages from hearts after IR (n = 6 mice per group). l, IGF1 levels in the culture supernatants of sorted MerTK+ and MerTK macrophages from the hearts via ELISA (n = 8 biologically independent samples per group). m, Tube formation assay in ECs transfected with siRNA-NC or siRNA-IGF1R and then cocultured with sorted MerTK+ macrophages (n = 10 biologically independent samples per group). Scale bars, 100 μm. n, Relative mRNA levels of Igf1 in hearts from WT mice, ATF3-CKO mice and ATF3-CKO mice injected with MerTK+ macrophages (n = 6 mice per group). Statistical significance was evaluated using two-tailed, unpaired Student’s t-tests (dg,i,m), unpaired Mann–Whitney U-tests (k,l), one-way ANOVA followed by Tukey’s multiple-comparison test (n), two-way ANOVA followed by Tukey’s multiple-comparison test (b) and Fisher’s exact test (h,j). All data are presented as mean ± s.e.m. Source data
Fig. 6
Fig. 6. Protective effect of rGAS6 administration against IR injury is dependent on ATF3.
a, Outline of rGAS6 (40 μg kg−1 d−1) or vehicle (IgG) treatment in WT or ATF3-CKO mice subjected to IR surgery. bh. Plasma GAS6 levels (b), cardiac Atf3 mRNA expression (c), MerTK+ cardiac macrophages (d), EF (e), cardiac fibrosis (f) and CD31+ ECs (g and h) in WT or ATF3-CKO mice administered rGAS6 (g) or IgG (h) after IR (b, n = 8 mice per group; ch, n = 6 mice per group). Statistical significance was evaluated using two-tailed, two-way ANOVA followed by Tukey’s multiple-comparison test (bh). All data are presented as mean ± s.e.m. Source data
Fig. 7
Fig. 7. ATF3–GAS6 levels associated with the risk of MACEs in patients with ischemic heart disease.
a, Manhattan plot indicating GWASs highlighting SNPs in the 100-kb upstream and downstream of ATF3 correlated with the MACEs in patients with CAD. b, The eQTLs of ATF3 in the whole blood. c, Heatmap of pairwise linkage disequilibrium measurements for the 14 intersection SNPs. d, Plasma levels of GAS6 in patients with ischemia with poor or good CCC (n = 72 per group). e, Unadjusted and adjusted ORs obtained using a logical regression analysis for poor CCC. They were adjusted for drinking and CABG history. f, Pearson’s correlation between the plasma GAS6 and LVEF. g, Kaplan–Meier plots of major adverse events according to median values of plasma GAS6 levels at admission. Statistical significance was evaluated using two-tailed, unpaired Student’s t-tests (d), logistic regression analyses (a,e), Pearson’s correlations analysis (b,f) and log(rank) tests (g). OR, odds ratio. Source data
Extended Data Fig. 1
Extended Data Fig. 1. Identification of macrophage/monocyte subpopulations.
a. Uniform manifold approximation and projection (UMAP) of single-cell RNA-sequencing (scRNA-seq) revealed 11 unique clusters (left) and the percentage of cells per cell type (right) in the heart between sham and IR. Mφ, macrophage; Mon, monocyte; CF, cardiac fibroblast; Neu, neutrophil; DC, dendritic cell; EC, endothelial cell; SMC, smooth muscle cell; CM, cardiomyocyte; LPC, lymphoid progenitor cell. b. Heatmap of the top ten differentially expressed genes (DEGs) in seven clusters of macrophages/monocytes. c. Hierarchical clustering of macrophages and monocytes. d. Violin plots representing log-normalized expression of Mertk and Ccr2 in the seven macrophage/monocyte clusters. e. Violin plots representing the log-normalized expression of Timd4, Folr2, and Cd163 in MerTK+CCR2- macrophages and MerTKCCR2+ macrophages. f, g. Colocalization (up) and quantification (down) of immunofluorescence (IF) signals of F4/80 and LYVE1, TREM2, and CD74 in cardiac border (f) and remote (g) regions of the sham and IR (n = 6 mice per group). Scale bar, 20 μm. HPF, high-power field. Statistical significance was evaluated using two-tailed unpaired t tests (f and g). All data are presented as mean ± SEM. Source data
Extended Data Fig. 2
Extended Data Fig. 2. Role of GAS6-MerTK signaling in ATF3 induction of macrophage.
a. Flow cytometry analysis and quantification of MerTK+ macrophages in bone marrow-derived macrophages (BMDMs) treated with rGAS6 at each time point (n = 6 per group). b. Relative mRNA expression of Mertk, Timd4, Folr2, and Cd163 in the rGAS6-treated BMDMs at different time points (n = 6 biologically independent samples per group). c. Relative mRNA expression of Atf3, Jun, and Fos in the rGAS6-treated BMDMs at different time points (n = 6 biologically independent samples per group). d. Representative IF images of ATF3 in BMDMs treated with rGAS6 or PBS for 24 h. Scale bar, 20 μm. This experiment was repeated independently triple with similar results. e. Representative IF images of MerTK (green) and ATF3 (red) in the heart of the sham operation and IR 6 h post-MI. Scale bar, 20 μm. This experiment was repeated independently triple with similar results. f. Relative mRNA expression of Atf3 in Mφ, CF, CM, and EC sorted from the heart of the sham and IR (n = 6 mice per group). g. Representative western blot analysis and quantification of the expression of phosphorylated- and total-AKT in BMDMs treated with rGAS6 for 1 h (n = 6 biologically independent samples per group). h. Relative mRNA expression of Atf3, Jun, and Fos in rGAS6-treated BMDMs transfected with scrambled control or Mertk-siRNA (n = 6 biologically independent samples per group). i. Relative mRNA expression of Atf3, Jun, and Fos in BMDMs pretreated with vehicle or LY294002 (a AKT inhibitor) (n = 6 biologically independent samples per group). j. Outline of UNC2250 (3 mg/kg) or saline treatment in WT mice subjected to IR surgery. k, l. Representative western blot analysis (k) and quantification (l) of the expression of phosphorylated- and total-MerTK, phosphorylated- and total-AKT, and ATF3 in the heart of IR mice treated with saline or UNC2250 (n = 6 mice per group). Statistical significance was evaluated using two-tailed unpaired t tests (f, g, h-Atf3, Jun, and k), unpaired Mann-Whitney U test (h-Fos), and oneway ANOVA analysis followed by Tukey’s multiple comparisons test (ac, i). All data are presented as mean ± SEM. Source data
Extended Data Fig. 3
Extended Data Fig. 3. Flow cytometry analysis of macrophages and other immune cells.
a. Representative agarose gel images of PCR results using DNA extracted from the tail as a template in ATF3-CKO and WT littermate control mice. b. Relative mRNA expression of Atf3 in Mφ, CF, CM, and EC sorted from ATF3-CKO and WT mice (n = 6 mice per group). c. Representative IF images of ATF3 (green) and F4/80, Col1a2, CD31, and α-actinin (red) in the heart of ATF3-CKO and WT mice. Scale bar, 20 μm. This experiment was repeated independently triple with similar results. d. Representative flow cytometry plots of MerTK+ macrophages and the three clusters in ATF3-CKO and WT mice under sham and IR. e. Representative dot plots and quantification of neutrophils, T cells, and B cells in the heart of ATF3-CKO and WT mice post-IR (n = 6 mice per group). Statistical significance was evaluated using two-tailed unpaired t-test (b, e). All data are presented as mean ± SEM. Source data
Extended Data Fig. 4
Extended Data Fig. 4. Effect of Type I IFN on MerTK+ macrophage in vitro.
a. Schematic representation of the in vitro experimental design. BMDMs obtained from WT and ATF3-CKO mice treated with rGAS6 for 4 days before hypoxia/reoxygenation, followed by GeneChip transcriptome analysis. b. Relative mRNA expression of randomly selected type I IFN-related genes in BMDMs obtained from ATF3-CKO and WT mice after HR (n = 6 mice per group). cf. Quantification or representative images of EdU+ (c), Ki67+ (d), Annexin V+ (e), and TUNEL+ (f) cells in rGAS6-treated BMDMs stimulated with rIFN-α or rIFN-β (n = 6 biologically independent samples per group). Scale bar, 50 μm. Statistical significance was evaluated using two-tailed unpaired t tests (b), and one-way ANOVA analysis followed by Tukey’s multiple comparisons test (cf). All data are presented as mean ± SEM. Source data
Extended Data Fig. 5
Extended Data Fig. 5. Expression of Ifih1, Ifnb1, and Apaf1 in MerTK+ cardiac macrophage.
ac. Representative IF images and quantification of IFIH1+MerTK+ (a), IFNB1+MerTK+ (b) and APAF1+MerTK+ (c) cells in cardiac ischemic regions of WT and ATF3-CKO mice post-IR. Percentage of double positive cells in total MerTK+ cells per HPF (n = 6 mice per group). Statistical significance was evaluated using two-tailed unpaired t tests (ac). All data are presented as mean ± SEM. Source data
Extended Data Fig. 6
Extended Data Fig. 6. Effect of Ifih1, Ifnb1, and Apaf1 on MerTK+ macrophage in vitro.
af. Quantification or representative images of EdU+ (a), Ki67+ (b, c), Annexin V+ (d), and TUNEL+ (e, f) cells in rGAS6-treateded BMDMs from ATF3-CKO and WT mice after siRNA transfection (n = 6 biologically independent samples per group). Scale bar, 50 μm. Statistical significance was evaluated using two-tailed two-way ANOVA analysis followed by Tukey’s multiple comparisons test (a, b, d, and e). All data are presented as mean ± SEM. Source data
Extended Data Fig. 7
Extended Data Fig. 7. Identification of cardiac resident macrophage-specific ATF3 deletion.
a. Representative agarose gel images of PCR results using DNA extracted from the tail as a template in ATF3fl/flCx3cr1-cre+ and ATF3fl/flCx3cr1-cre- mice. b. Representative dot plots showing sorting strategy of CD45 cells, Cx3cr1 macrophages, and Cx3cr1+ macrophages. Relative mRNA expression of Atf3 in three types of cells in two genotypes (n = 6 mice per group). c. Representative IF images of F4/80 (green), ATF3 (red) and CX3CR1 (pink) in the hearts of the two genotypes. Scale bar, 20 μm. Statistical significance was evaluated using two-tailed unpaired t tests (b). All data are presented as mean ± SEM. Source data
Extended Data Fig. 8
Extended Data Fig. 8. Cardiac repair is attenuated upon the loss of myeloid-specific ATF3.
a. Representative transverse cardiac magnetic resonance imaging (MRI). The epicardial border (green), endocardial border (red), and infarct region (yellow) are delineated on a T1 map (up). Representative images of Evans blue and 2,3,5triphenyltetrazolium chloride staining (down) in ATF3-CKO and WT hearts 1 day post-IR (bottom). Scale bar, 1 mm. b. Late gadolinium enhancement was used to determine the infarct size (n = 6 mice per group). c. Ejection fraction (EF) as determined via MRI 1 day post-IR (n = 6 mice per group). d. Infarct size was calculated as a percentage of the myocardial area at risk (sham, n = 6 mice per group, IR-1d, n = 10 mice per group). e. Representative images and quantification of TUNEL+α-actinin+ cardiomyocytes in the hearts of ATF3-CKO and WT mice 1 day post-IR (n = 6 mice per group). Scale bar, 50 μm. f. Flow cytometry analysis and quantification of CD45-PDGFRα-CD31+ EC populations in the hearts of ATF3-CKO and WT mice (n = 6 mice per group). g. Representative images and quantification of CD31+ area per HPF in CD31+ cells in the cardiac border area of ATF3-CKO and WT mice (n = 6 per group). Scale bar, 20 μm. h, i. Representative images (h) and quantification (i) of microfil vascular casting and microCT in ATF3-CKO and WT hearts 7 days after IR (n = 6 mice per group). Scale bar, 1 mm. j. Representative echocardiographic images and ejection factor of ATF3-CKO and WT mice 30 days after IR (n = 6 mice per group). k. Representative images and quantification of fibrosis of ATF3-CKO and WT hearts 30 days after IR (n = 6 mice per group). Scale bar, 1 mm. Statistical significance was evaluated using two-tailed two-way ANOVA analysis followed by Tukey’s multiple comparisons test (b-g, and i-k). All data are presented as mean ± SEM. Source data
Extended Data Fig. 9
Extended Data Fig. 9. Effect of ATF3 deficient MerTK+ macrophage transfer on cardiac repair post IR.
a. Scheme showing WT-MerTK+ and ATF3 deficient-MerTK+ macrophages transferred into ATF3-CKO mice. b, c. Flow cytometry analysis of Annexin V+ cells (b) and EdU+ cells (c) gated on Calcein-AM+MerTK+ macrophages in the heart of mice transferred with two types of MerTK+ macrophages (n = 6 mice per group). dg. Immunostaining (d) and flow cytometry analysis (e) of CD31+ cells in the cardiac border area, EF (f), and cardiac fibrosis (g) in the heart of ATF3-CKO mice injected with WT-MerTK+ and ATF3 deficient-MerTK+ macrophages (n = 6 mice per group). Statistical significance was evaluated using two-tailed unpaired t-test (bg). All data are presented as mean ± SEM. Source data
Extended Data Fig. 10
Extended Data Fig. 10. Efficiency of siRNA knockdown and lentiviral transfection.
ah. RT-qPCR of Atf3 (a), Fos (b), Jun (c), Mertk (d), Ifih1 (e), Ifnb1 (f), Apaf1 (g) and IGF1R (h) knockdown efficiency in macrophages upon siRNA treatment (n = 6 biologically independent samples per group). i. RT-qPCR validation of Atf3 overexpression efficiency by LV-ATF3 in macrophages (n = 6 biologically independent samples per group). Statistical significance was evaluated using two-tailed unpaired t-test (ai). All data are presented as mean ± SEM. Source data

Comment in

References

    1. Reed, G. W., Rossi, J. E. & Cannon, C. P. Acute myocardial infarction. Lancet389, 197–210 (2017). 10.1016/S0140-6736(16)30677-8 - DOI - PubMed
    1. Li, Y. et al. S100a8/a9 signaling causes mitochondrial dysfunction and cardiomyocyte death in response to ischemic/reperfusion injury. Circulation140, 751–764 (2019). 10.1161/CIRCULATIONAHA.118.039262 - DOI - PubMed
    1. Horckmans, M. et al. Neutrophils orchestrate post-myocardial infarction healing by polarizing macrophages towards a reparative phenotype. Eur. Heart J.38, 187–197 (2017). - PubMed
    1. Bajpai, G. et al. Tissue resident CCR2 and CCR2+ cardiac macrophages differentially orchestrate monocyte recruitment and fate specification following myocardial injury. Circ. Res.124, 263–278 (2019). 10.1161/CIRCRESAHA.118.314028 - DOI - PMC - PubMed
    1. Sansonetti, M., Waleczek, F. J. G., Jung, M., Thum, T. & Perbellini, F. Resident cardiac macrophages: crucial modulators of cardiac (patho)physiology. Basic Res. Cardiol.115, 77 (2020). 10.1007/s00395-020-00836-6 - DOI - PMC - PubMed

Publication types

MeSH terms

Substances