. 2024 May;3(5):525-540.
doi: 10.1038/s44161-024-00462-8. Epub 2024 Apr 23.

Stroke and myocardial infarction induce neutrophil extracellular trap release disrupting lymphoid organ structure and immunoglobulin secretion

Affiliations

Stroke and myocardial infarction induce neutrophil extracellular trap release disrupting lymphoid organ structure and immunoglobulin secretion

Ali A Tuz et al. Nat Cardiovasc Res. 2024 May.

Abstract

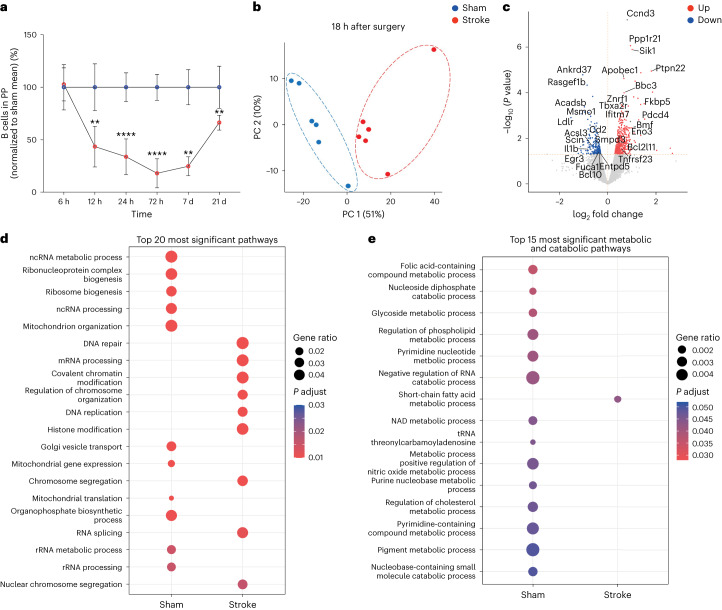
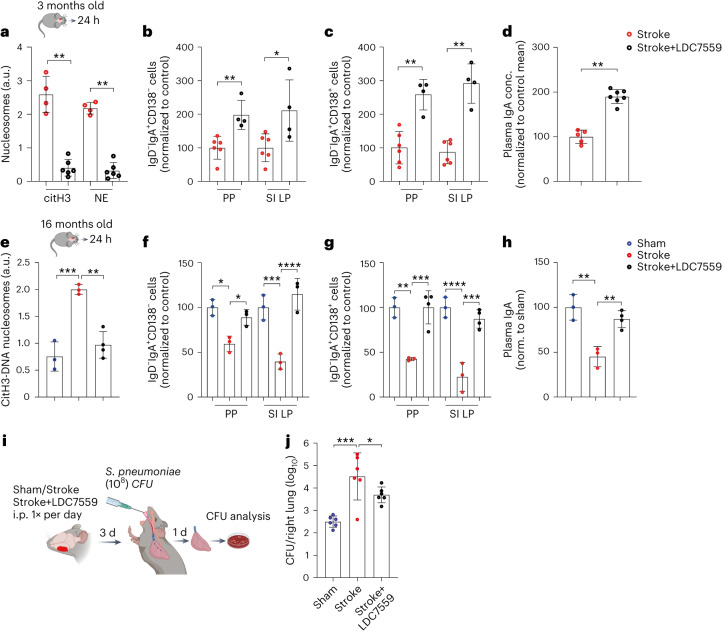
Post-injury dysfunction of humoral immunity accounts for infections and poor outcomes in cardiovascular diseases. Among immunoglobulins (Ig), IgA, the most abundant mucosal antibody, is produced by plasma B cells in intestinal Peyer's patches (PP) and lamina propria. Here we show that patients with stroke and myocardial ischemia (MI) had strongly reduced IgA blood levels. This was phenocopied in experimental mouse models where decreased plasma and fecal IgA were accompanied by rapid loss of IgA-producing plasma cells in PP and lamina propria. Reduced plasma IgG was detectable in patients and experimental mice 3-10 d after injury. Stroke/MI triggered the release of neutrophil extracellular traps (NETs). Depletion of neutrophils, NET degradation or blockade of NET release inhibited the loss of IgA+ cells and circulating IgA in experimental stroke and MI and in patients with stroke. Our results unveil how tissue-injury-triggered systemic NET release disrupts physiological Ig secretion and how this can be inhibited in patients.


Conflict of interest statement

The authors declare no competing interests.

Figures

Fig. 1
Fig. 1. Ischemic stroke and MI reduce plasma IgA levels and B cell follicle volumes in PP.
a, Concentrations of plasma IgA in patients with stroke and in healthy controls measured by ELISA (n = 14−23 per group, P = 0.0002). b,c, Concentrations of plasma IgA and fecal IgA in sham and stroke mice measured by ELISA (n = 6−8 per group, **P = 0.037, *P = 0.0053). d, Macroscopic overview of the mouse GI tract with the demarcation of PP 1 d after sham surgery or stroke. e, Fluorescence images after 3D reconstruction of stained PP showing the position of PP in the small intestine that were whole-mount stained with anti-CD19 (green) and anti-CD3 (blue) fluorescent antibodies before LSFM (left). Fluorescence single−channel images are shown (right); scale bar, 500 μm. f, Deep-learning-based automated analysis of B cell follicle volume in PP from duodenum, jejunum and ileum 1 d after stroke or sham (n = 7−11 PP per intestinal segment, 4−6 mice per group, sham versus stroke duodenum non-significant P > 0.9999, ***P = 0.0003, ****P < 0.0001). g, Concentrations of plasma IgA in patients with MI and healthy controls measured by ELISA (n = 16−39 per group, ****P < 0.0001). h, Deep-learning-based quantification of B cell follicle volume in PP of the duodenum, jejunum and ileum 1 d after sham or myocardial infarction (n = 4−9 PP per intestinal segment, 4−5 mice per group, sham versus MI non-significant P = 0.7879, ***P = 0.0002, *P = 0.0451). Data are mean ± s.d.; statistical analyses were performed by two-tailed Mann−Whitney U-test. All mouse data were combined from at least three independent experiments. HC, healthy control. Source data
Fig. 2
Fig. 2. Stroke induces B cell loss in PP via activation of cell death pathways.
a, Flow-cytometry-based quantification of the number of CD19+ B cells and CD3+ T cells in all intestinal PP 24 h after sham surgery or stroke and unoperated naive mice (n = 5−8 per group, sham versus naive non-significant P = 0.4351, ***P = 0.0003, **P = 0.0037). b, Quantification of IgDIgA+CD138 IgA-switched B cells in all PP and SI LP after 24 h of sham surgery or stroke and naive mice (n = 5 per group, naive versus sham PP non-significant P = 0.2222, sham versus stroke PP **P = 0.0079, naive versus sham SI LP non-significant P = 0.8413, sham versus stroke SI LP *P = 0.0159). Data are presented as a percentage change and normalized to the mean of naive controls c, Quantification of IgDIgA+CD138+ plasma cells in all PP and SI LP (n = 5 per group, naive versus sham PP non-significant P = 0.1775, sham versus stroke PP **P = 0.0079, naive versus sham SI LP non-significant P = 0.5476, sham versus stroke SI LP **P = 0.0079). d, Single-cell suspensions from PP of sham and stroke mice were prepared 12 h after the operation, and apoptotic cells were quantified by staining with Annexin V and PI followed by flow cytometry analysis (n = 6 per group, **P = 0.0043). e, After sham operation or stroke, B cells from PP were enriched using MACS and analyzed by mass spectrometry (n = 3 per group). f, Gene Ontology chord diagram of the functional enrichment analysis. Genes are ranked based on log2FC value (high to low). Each chord connects the gene with its associated pathway. Data are mean ± s.d.; statistical analyses were performed by two-tailed Mann−Whitney U-test. All data were combined from at least three independent experiments. ER, endoplasmic reticulum.
Fig. 3
Fig. 3. Stroke downregulates cellular and metabolic functional gene pathways of B cells in PP.
a, Kinetics of B cell loss in PP of stroke mice compared to sham controls. Data are presented as a percentage decrease in B cell numbers in stroke mice normalized to mean of sham controls for each timepoint (n = 6−9 per group and timepoint, sham versus stroke 6 h P = 0.9372, 12 h **P = 0.079, 24 h ****P < 0.0001, 72 h ****P < 0.0001, 7 d **P = 0.0095, 21 d **P = 0.0087). b, PCA of RNA-seq data of CD19+ B cells in PP from mice exposed to sham surgery or stroke (n = 6 per group). c, Volcano plot showing statistically significant differentially expressed genes in PP B cells of stroke mice compared to sham, as determined by non-multiple-testing-adjusted P values from two-sided Wald test. Red dots indicate upregulated genes, and blue dots indicate downregulated genes. d, GSEA of RNA-seq showing enriched cell function pathways in sham-operated and stroke mice as determined by one-sided Fisher’s exact test P values, adjusted for multiple testing with FDR and significance set at P < 0.05. e, GSEA showing enriched metabolic/catabolic pathways in PP B cells of stroke and sham-operated mice. The dot size indicates the calculated gene ratio, and the dot color indicates the adjusted P value representing the enrichment score as described in the Methods. Note that B cells from stroke mice appear metabolically inactive. Data represent mean ± s.d., two-tailed Mann−Whitney U-test. All data were combined from at least three independent experiments, n = 6 mice per group. Down, downregulated genes; Up, upregulated genes.
Fig. 4
Fig. 4. Stroke increases ciDNA and promotes lymphocyte loss in PP.
a, Quantification of plasma DNA 6 h and 24 h after sham surgery or stroke using Qubit assays (n = 5−12 per group, two−tailed Mann−Whitney U-test, ***P = 0.0002, *P = 0.0459). b, Numbers of B cells in PP 24 h after sham surgery or stroke in DNase-I-treated and vehicle-treated mice analyzed by flow cytometry (n = 3−6 per group, ordinary one-way ANOVA with Bonferroni’s multiple comparisons tests, sham+DNase-I versus stroke+DNase-I non-significant P > 0.9999, sham control versus sham+DNase-I non-significant P > 0.9999, ****P < 0.0001). c, Numbers of T cells in PP 24 h after sham operation or stroke in DNase-I-treated and vehicle-treated mice (n = 3−7 per group, ordinary one-way ANOVA with Bonferroni’s multiple comparisons tests, sham+DNase-I versus stroke+DNase-I non-significant P > 0.9999, sham control versus stroke control ****P < 0.0001, stroke control versus stroke+DNase-I ****P < 0.0001). d, Brain infarct volumes in DNase-I-treated and untreated mice at 24 h (n = 6−7 per group, two−tailed Mann−Whitney U-test, non-significant P = 0.2343). e, 3D reconstruction LSFM images of CD19+ B cells and CD3+ T cells in PP after sham, stroke and stroke+DNase-I-treated mice; scale bar, 500 µm. f, Quantification of CD19+ B cell follicle volume (n = 4−6 PP per intestinal segment, two-tailed Mann−Whitney U-test, stroke versus stroke+DNase-I duodenum non-significant P = 0.9048, stroke versus stroke+DNase-I jejunum *P = 0.0173, stroke versus stroke+DNase-I ileum *P = 0.0317). g, T cell zone volume in duodenum, jejunum and ileum 24 h after stroke or stroke+DNase-I treatment (n = 4−6 PP per intestinal segment, two-tailed Mann−Whitney U-test, stroke versus stroke+DNase-I duodenum non-significant, P = 0.2, stroke versus stroke+DNase-I jejunum *P = 0.0173, stroke versus stroke+DNase-I ileum *P = 0.0317). h, Schematic of the experimental paradigm. Mice underwent stroke or sham operation and were euthanized after 6 h to collect blood plasma. Cell cultures from PP were prepared and treated with the plasma of sham or stroke mice for 12 h. In the third condition, plasma of stroke mice was treated with DNase-I before addition to the cell cultures, and quantification of caspase-3/7-expressing cells was performed by flow cytometry. i, The percentages of caspase-3/7+ B and T cells in PP cell cultures incubated with the plasma of sham or stroke mice or DNase-I-treated stroke plasma (n = 5−10 mice per group, ordinary one-way ANOVA, CD19+ sham versus stroke ****P < 0.0001, stroke versus stroke+DNase-I ***P = 0.0002, CD3+ sham versus stroke ****P < 0.0001, stroke versus stroke+DNase-I **P = 0.0037). Data are mean ± s.d., Shapiro–Wilk normality tests.
Fig. 5
Fig. 5. Stroke activates circulating neutrophils to release cytotoxic NETs, which induce B cell loss.
a, Schematic of the experimental paradigm for neutrophil mass spectrometry and proteomics analysis. Blood neutrophils were isolated 6 h after sham surgery or stroke to perform liquid chromatography–mass spectrometry analysis. b, PCA of neutrophil proteomics after sham or stroke (n = 4 mice per group). c, Volcano plot comparing the normalized protein abundance in blood neutrophils of stroke mice versus sham-operated mice. Red dots indicate significantly upregulated proteins, and blue dots indicate significantly downregulated proteins. Two-tailed t-test, P < 0.05 adjusted with the Benjamini–Hochberg method, FC > 1.5 or FC < 0.5. d, Relative plasma levels of citH3-DNA (n = 5−6 per group, sham versus stroke ****P < 0.0001, stroke versus stroke+DNase-I ***P = 0.0004, stroke versus stroke+anti-Ly6G ****P < 0.0001). e, NE-DNA complexes after sham+isotype antibody, stroke+isotype antibody, stroke+DNase-I treatment or stroke+anti-Ly6G antibody treatment (n = 5−6 per group, sham versus stroke, stroke versus stroke+DNase-I, stroke versus stroke+anti-Ly6G treatment ****P < 0.0001). f, Numbers of CD19+ B cells in intestinal PP in sham-operated+isotype antibody, stroke+isotype antibody and stroke+anti-Ly6G antibody-treated mice (n = 5−7 per group, sham versus stroke, stroke versus stroke+anti-Ly6G treatment ****P < 0.0001). g, Numbers of CD19+ B cells in PP in sham-operated Ly6gcreMcl1f/f mice, stroke Ly6gcre and Ly6gcreMcl1f/f mice (n = 4−6 per group, sham versus Ly6gcre **P = 0.0013, stroke Ly6gcre versus stroke Ly6gcreMcl1f/f **P = 0.0095). h, Quantification of plasma IgA amounts sham, stroke, stroke+DNase-I treatment, stroke+anti-Ly6G antibody treatment or stroke Ly6gcreMcl1f/f mice (n = 6−13 per group, stroke versus sham, stroke versus stroke+DNase-I, stroke versus stroke+anti-Ly6G antibody, stroke versus stroke Ly6gcreMcl1f/f ****P < 0.0001). Data represent mean ± s.d., Shapiro−Wilk normality and ordinary one-way ANOVA with Bonferroni’s multiple comparisons tests.
Fig. 6
Fig. 6. Stroke triggers platelet aggregation and vascular thrombus formation in PP.
a, 3D reconstruction images of GP1bβ+ platelet aggregates in CD31+ vasculature in PP isolated from sham, stroke+vehicle and stroke+DNase-I-treated mice. Scale bar, 300 µm. b, Quantification of GP1bβ+ platelet aggregates in PP isolated from sham, stroke+vehicle and stroke+DNase-I-treated mice (n = 5 PP per group, **P = 0.0027). c, 3D images showing GP1bβ+ platelet aggregates in CD31+ vasculature of PP used for analyzing surface volumes. Scale bar, 20 µm. d, Quantification of total GP1bβ+ platelet volumes to CD31+ surface volumes in PP isolated from sham, stroke+vehicle and stroke+DNase-I-treated mice (n = 5 PP per group, *P = 0.0037). Data are represented as mean ± s.d.; statistical analyses were performed by Kruskal–Wallis test.
Fig. 7
Fig. 7. Inhibition of NETs protects IgA-secreting plasma cells after stroke in young and old mice.
a, Relative plasma levels of citH3-DNA and NE-DNA complexes in stroke+vehicle and stroke+LDC7559-treated 3-month-old young mice (n = 4−6 per group, citH3 stroke versus stroke+LDC7559 **P = 0.0095, NE stroke versus stroke+LDC7559 **P = 0.0095). b, Numbers of IgDIgA+CD138 IgA-switched B cells in all PP and SI LP in stroke and stroke+LDC7559-treated young mice (n = 4−6 per group, **P = 0.0095, *P = 0.019). c, Numbers of IgA+IgDCD138+ plasma cells in all PP and LP in stroke and stroke+LDC7559-treated young mice (n = 4−6 per group, PP comparison **P = 0.0095, SI LP comparison **P = 0.0095). d, Relative concentrations of plasma IgA in stroke and stroke+LDC7559-treated young mice (n = 4−7 per group, **P = 0.0025). e, Relative plasma levels of citH3-DNA complexes in sham, stroke+vehicle and stroke+LDC7559-treated 16-month-old mice (n = 3−4 per group, ordinary one-way ANOVA, ***P = 0.0007, **P = 0.0016). f, Numbers of IgDIgA+CD138 B cells in all PP and LP in sham, stroke and stroke+LDC7559-treated old mice (n = 3 per group, ordinary one-way ANOVA, PP sham versus stroke *P = 0.0165, stroke versus stroke+LDC7559 *P = 0.0144, SI LP sham versus stroke ***P = 0.0006, stroke versus stroke+LDC7559 ****P < 0.0001). g, Numbers of IgDIgA+CD138+ plasma cells in all PP and LP in stroke and stroke+LDC7559-treated old mice (n = 3−4 per group, ordinary one-way ANOVA, PP sham versus stroke **P = 0.0014, stroke versus stroke+LDC7559 ***P = 0.0007, SI LP sham versus stroke ****P < 0.0001, stroke versus stroke+LDC7559 ***P = 0.0002). h, Relative concentrations of plasma IgA in stroke and stroke+LDC7559-treated old mice (n = 3−4 per group, ordinary one-way ANOVA, sham versus stroke **P = 0.0019, stroke versus stroke+LDC7559 **P = 0.0061). i, sham or stroke mice were treated with vehicle or LDC7559 every day, and, after 3 d, all mice were intratracheally inoculated with S. pneumoniae (108 CFUs). Mice were euthanized 1 d after infection to analyze bacterial burden in the lungs. j, CFUs in the lungs of infected sham+vehicle, stroke+vehicle and stroke LDC7559 mice (n = 6 per group, ordinary one-way ANOVA, ***P = 0.0003, *P = 0.0195). Data represent mean ± s.d., two-tailed Mann−Whitney U-test (ad). All data were combined from at least two independent experiments.
Fig. 8
Fig. 8. Patients with stroke and MI show increased circulating NETs and reduced IgA levels that can be treated with DNase-I.
a,b, Relative plasma levels of citH3−DNA (a) and NE−DNA complexes (b) in patients with stroke and healthy individuals (n = 14−23 per group, ****P < 0.0001). c, A significant negative correlation between plasma citH3-DNA complex levels and IgA amounts in patients with stroke. d,e, Relative plasma levels of citH3-DNA (d) and NE-DNA complexes in patients with MI and healthy controls (n = 17−38 per group, ****P < 0.0001). f, A significant negative correlation between plasma citH3-DNA complex levels and IgA amounts in MI (n = 17−38 per group). g,h, citH3-DNA (n = 7−8 per group, *P = 0.0263) (g) or NE−DNA (n = 7−9 per group, **P = 0.0012) (h) complexes at 24 h after therapy in the plasma of patients with stroke treated at timepoint 0 with tPA alone or combined with recombinant human DNase-I. i, Levels of plasma IgA in the same patients with stroke (n = 7−8 per group, **P = 0.0093). The IgA data were normalized to the baseline plasma IgA levels of the same individuals before the administration of treatment, and percentage values are presented. Data represent mean ± s.d., Mann−Whitney U-test. HC, healthy control; MI, myocardial infarction.
Extended Data Fig. 1
Extended Data Fig. 1. Stroke induces long-term IgG loss in patients and shrinks PP in mice after ischemia-reperfusion injury.
a, Concentrations of plasma IgG in stroke patients after 1−3 d and 4−10 d of hospital admission and healthy controls measured by ELISA (n = 14−21 per group, ordinary one−way ANOVA, **P = 0.0037, ****P < 0.0001). b, Quantification of brain infarct volume after 24 h and 72 h of stroke (n = 9−12 per group). c, Quantification of plasma IgG in sham or stroke mice after 24 h, 72 h and 7 d using ELISA (n = 5−12 per group, ordinary one−way ANOVA, ****P < 0.0001). d, The total number of intestinal PP per mouse 24 h and 72 h after sham surgery or stroke or unoperated naïve mice (n = 8−13 mice per group, two−tailed Mann−Whitney U test, sham 24 h vs naïve P = 0.6883, sham 72 h vs naïve P = 0.5810, 24 h sham vs stroke P = 0.5597, 72 h sham vs stroke **P = 0.0047). e, Illustration of the intestinal tissue preparation for unstained−volume analysis of whole PP or whole−mount staining of B and T cells in PP, followed by tissue clearing and LSFM−based 3D volume analysis. f, Representative LSFM images of cleared unstained intestinal PP showing their shrinkage 24 h after sham or stroke, scale bar=500 µm. g, Tissue volume analysis of PP after 24 h and 72 h of sham or stroke; (n = 23 PP for sham and n = 16 PP for stroke, n = 3−4 mice for 24 h and n = 34 PP for sham and n = 24 PP for stroke, n = 6 mice for 72 h, two−tailed Mann−Whitney U test, naïve vs sham 24 h P = 0.3990, 24 h sham vs stroke **P = 0.0055, 72 h sham vs stroke ****P < 0.0001). h, Overview of the human−in−the−loop segmentation workflow for automated analysis of B cell follicles volume and T cell zone volume. Data represented as mean ±s.d., All data are combined from at least three independent experiments. PP=Peyer’s patches.
Extended Data Fig. 2
Extended Data Fig. 2. Stroke and myocardial infarction induce shrinkage of B cell follicles and T cell zone volumes in PP.
a, 3D reconstruction images of CD19+ B cells and CD3+ T cells in PP isolated from duodenum, jejunum and ileum 24 h after stroke or sham surgery, scale bar=500 µm. b, The quantification of T cell zone volume in different intestinal segments after 24 h of stroke or sham controls (n = 8−11 PP per intestinal segment, two−tailed Mann−Whitney U test, duodenum sham vs stroke P > 0.9999, jejunum sham vs stroke P = 0.8633, leum sham vs stroke ***P = 0.0002). c, Numbers of GL7+ GC cells in PP after 24 h of sham or stroke operation using flow cytometry (n = 4 mice per group, unpaired t-test ***P = 0.0007). d, Representative fluorescence histology images of ileal PP stained with, anti−GL7, anti−EpCAM and DAPI after 24 h of stroke and sham operation, scale bar=200 µm. e, 3D reconstruction images of CD19+ B cells and CD3+ T cells in PP isolated from duodenum, jejunum and ileum 24 h after MI or sham surgery, scale bar=500 µm. f, The quantification of T cell zone volume in different intestinal segments after 24 h of myocardial infarction or sham controls (n = 4−6 PP per intestinal segment, two−tailed Mann−Whitney U test, duodenum sham vs MI P = 0.1636, jejunum sham vs MI *P = 0.0274, ileum sham vs MI P = 0.8329). g, 3D reconstruction images of CD19+ B cells and CD3+ T cells in PP isolated from ileum of naïve wild type, anti-CD20 treated wild type and JhT−/− mice, scale bar=500 µm. h, Quantification of the number of B cell follicles per PP in different intestinal regions after stroke or sham operation (n = 6 PP per group, two−tailed Mann−Whitney U test, duodenum sham vs stroke P = 0.6993, jejunum sham vs stroke P = 0.2456, ileum sham vs stroke P = 0.4082). Data represented as mean ±s.d., statistical analyses were performed by two−tailed Mann−Whitney U test. All data are combined from at least three independent experiments. PP=Peyer´s patches, MI=myocardial infarction.
Extended Data Fig. 3
Extended Data Fig. 3. Differential frequencies of B and T cells in PP and SI LP.
a, Representative gating strategy for the analysis of lymphocytes and granulocytes in spleen using multi−color flow cytometry. b, Representative gating strategy for the analysis of IgA-switched B cells and IgA+ mature plasma cell subsets in SI LP using multi-color flow cytometry. c, The frequency of CD19+, CD3+, CD11b+ and Ly6G+ CD11b+ cells in PP (n = 11 mice per group) and d, SI LP (n = 5 mice per group) of sham mice. Data represented as mean ±s.d. All data are combined from at least three independent experiments. PP=Peyer´s patches, SI LP=small intestine lamina propria.
Extended Data Fig. 4
Extended Data Fig. 4. Stroke differentially impacts lymphocyte numbers in lymphoid tissues and is independent of reduced food consumption.
a, Total numbers of CD19+ B cells and CD3+ T cells in spleens of stroke or sham−operated mice (n = 12−14 per group, two−tailed Mann−Whitney U test, ****P < 0.0001, *P = 0.0202). b-d, Total numbers of CD19+ B cells and CD3+ T cells in mLN (n = 12−14 per group, two−tailed Mann−Whitney U test, CD19+ cells P = 0.3744, CD3+ cells P = 0.5952), BM (n = 12−14 per group, two−tailed Mann−Whitney U test, CD19+ P = 0.6308, CD3+ P = 0.3217) and blood (n = 12−14 per group, two−tailed Mann−Whitney U test, CD19+ P = 0.5267, CD3+ P = 0.7045) of stroke or sham−operated mice. e, The percentage change in IgG+ and IgM+ B cells in PP after 24 h of sham or stroke operation (n = 4 mice per group, unpaired t-test, ***P = 0.0005, **P = 0.0064). Data is presented as normalized to the mean of sham. f, Relative frequencies of B cells in blood, mLN and SI LP after 12 h of stroke or sham−operation (n = 3−4 per group) normalized to mean of sham. g, Mice underwent stroke or sham surgery and received two times food gavage and were sacrificed 24 h after the operation to analyze the number of B and T cells in PP. h, Total numbers of CD19+ B cells and CD3+ T cells in PP of stroke or sham−operated mice that received food gavage (n = 7 per group, two−tailed Mann−Whitney U test, ***P = 0.0006, **P = 0.0023). i, Percentage of body-weight loss in sham and stroke mice with and without food gavage (n = 6−8 per group, two−tailed Mann−Whitney U test, no gavage sham vs stroke P = 0.2284, food gavage sham vs stroke P = 0.5589). j, Quantification of plasma DNA content in sham−operated or MI mice (n = 5−8 per group, ordinary one−way ANOVA, ****P < 0.0001). k, Cell cultures from PP were prepared and treated with the plasma of sham or stroke mice for 12 h. In the third condition, plasma of stroke mice was treated with DNase−I before addition to the cell cultures and quantification of Annexin V+ PI cells was performed by flow cytometry (n = 5 per group). Data represented as mean ±s.d., Shapiro-Wilk normality test. PP=Peyer’s patches, SI LP=small intestine lamina propria, mLN=mesenteric lymph nodes, MI=myocardial infarction.
Extended Data Fig. 5
Extended Data Fig. 5. Neutrophil-released NETs after tissue injury contribute to reduced B and T cell numbers in PP.
a, A sample-wise comparison showed a Pearson correlation coefficient for all analyzed samples for mass spectrometry analysis. b, Relative plasma levels of citH3−DNA complexes after 6 h of myocardial infarction or sham operation (n = 5 per group, two−tailed Mann−Whitney U test, **P = 0.0079). c, Relative frequencies of blood Ly6G+CD11b+ neutrophils in stroke mice treated with anti−Ly6G antibodies or vehicle (n = 5−7 per group, two−tailed Mann−Whitney U test, **P = 0.0025). d, Quantification of plasma DNA at 6 h and 24 h after stroke + isotype antibody or stroke + anti−Ly6G antibody injected mice (n = 5−14 per group, ordinary one−way ANOVA, ****P < 0.0001, Ly6G antibody 6 h vs 24 h P > 0.9999). e, The total numbers of CD3+ T cells in PP of stroke + isotype antibody or stroke + anti−Ly6G antibody−injected mice after 24 h (n = 5−7 per group, two−tailed Mann−Whitney U test, **P = 0.0025). f, Brain infarct volumes after 24 h of stroke + isotype antibody or stroke + anti−Ly6G antibody−injected mice (n = 5−7 per group, two−tailed Mann−Whitney U test, P = 0.3434). g, 3D reconstruction images of CD19+ B cells and CD3+ T cells in PP isolated from duodenum, jejunum and ileum 24 h of stroke + isotype antibody or stroke + anti−Ly6G treated mice, scale bar=500 μm. Data represented as mean ±s.d., Shapiro-Wilk normality. PP=Peyer’s patch, CitH3=citrullinated Histone-3.
Extended Data Fig. 6
Extended Data Fig. 6. Neutrophil−deficiency blocked stroke triggered lymphocyte loss and shrinkage of B cell follicles in PP.
a, Percentages of blood Ly6G+ CD11b+ neutrophils in naïve Ly6gcre and Ly6gcreMcl1f/f mice (n = 11−15 per group, ****P < 0.0001). b, Brain infarct volumes after 24 h of stroke in Ly6gcre and Ly6gcreMcl1f/f mice (n = 4−6 per group, P = 0.4762). c, Total numbers of CD19+ T cells after 24 h of stroke in spleens of Ly6gcre and Ly6gcreMcl1f/f mice (n = 4 per group, *P = 0.0286). d, Brain infarct volumes after 72 h of stroke in Ly6gcre and Ly6gcreMcl1f/f mice (n = 4 per group, **P = 0.008). e, 3D reconstruction images of CD19+ B cells and CD3+ T cells in PP isolated from duodenum, jejunum and ileum 24 h after stroke in Ly6gcre and Ly6gcreMcl1f/f mice, scale bar=500 μm. f, Representative fluorescence histology images of PP stained with, anti−CD3, anti−CD19, anti−MPO and DAPI after 12 h of stroke and sham operation, scale bar=20 µm. g, Log2 fold numbers of Ly6G+ CD11b+ neutrophils in PP, SI LP and blood in sham or stroke mice (n = 12−14 mice per group, PP comparison P = 0.8201, SI LP comparison P = 0.4562, per ml Blood comparison P = 0.4668). Data represented as mean ±s.d., statistical analyses were performed by two−tailed Mann−Whitney U test. PP=Peyer’s patches, SI LP=small intestine lamina propria.
Extended Data Fig. 7
Extended Data Fig. 7. Neutrophils after MI release NETs and induce loss of plasma cells and IgA.
a, Numbers of CD19+ and CD3+ cells in all PP in MI + vehicle and MI + DNase-I treated mice (n = 4−5 per group, unpaired t-test, **P = 0.0006, **P = 0.0035). b, Numbers of IgDIgA+ CD138 IgA-switched B cells in all PP and SI LP in MI and MI + DNase-I treated mice (n = 4−5 mice per group, unpaired t-test ***P = 0.0006, ****P < 0.0001). c, Numbers of IgDIgA+ CD138+ plasma cells in all PP and SI LP in MI and MI + DNase-I treated mice (n = 4−5 mice per group, unpaired t-test, **P = 0.0024, ***P = 0.0005). d, Relative concentrations of plasma IgA in MI and MI + DNase-I treated mice (n = 4−5 per group, unpaired t-test ***P = 0.0003). e, Numbers of CD19+ and CD3+ cells in all PP in MI + isotype antibody and MI + anti-Ly6G treated mice (n = 4−6 per group, unpaired t-test, CD19+ **P = 0.0031, CD3+ **P = 0.0047). f, Numbers of IgDIgA+CD138 B cells in all PP and SI LP in MI + isotype antibody and MI + anti-Ly6G treated mice (n = 4−5 mice per group, unpaired t-test, ****P < 0.0001). g, Numbers of IgDIgA+ CD138+ plasma cells in all PP and SI LP in MI + isotype antibody and MI + anti-Ly6G treated mice (n = 5−6 mice per group, unpaired t-test, ****P < 0.0001, ***P = 0.0006). h, Relative concentrations of plasma IgA in MI + isotype antibody and MI + anti-Ly6G treated mice (n = 4−5 per group, unpaired t-test **P = 0.0065). For B-D and F-H, data are presented as a percentage change and normalized to the mean of MI controls. Data represent mean ±s.d. All data is combined from at least two independent experiments, PP=Peyer’s patches, SI LP= small intestine lamina propria.
Extended Data Fig. 8
Extended Data Fig. 8. Pharmacological inhibition of NET formation blocks stroke-induced lymphocyte loss and reduction of B cell follicles in PP.
a, Relative plasma levels of citH3−DNA complexes after 6 h of MI or MI + anti-Ly6G or MI+ DNase−I treated mice (n = 5−8 mice per group, ordinary one-way ANOVA, ****P < 0.0001). b, Relative plasma levels of citH3−DNA complexes after 6 h of stroke or Bi + Cl−amidine treated mice (n = 6 per group, unpaired t-test, ****P < 0.0001). c, Total numbers of B cells in PP of stroke + vehicle or stroke + Cl−amidine treated mice after 24 h (n = 6−7 mice per group, unpaired t-test, ****P < 0.0001). d, Brain infarct volumes after 24 h of stroke + vehicle or stroke + Cl−amidine treated mice (n = 6−7 per group, two−tailed Mann−Whitney U test, **P = 0.0012). e, 3D reconstruction images of CD19+ B cells and CD3+ T cells in PP isolated from duodenum, jejunum and ileum 24 h of stroke + vehicle or stroke + LDC7559 treated mice, scale bar=500 µm. f, Brain infarct volumes after 24 h of stroke + vehicle or stroke + LDC7559 treated mice (n = 4−5 per group, two−tailed Mann−Whitney U test, P = 0.5556). Data represented as mean ±s.d. PP=Peyer’s patches.
Extended Data Fig. 9
Extended Data Fig. 9. Inhibition of NETs release after stroke prevented lymphocyte loss in PP and spleen in young and old mice.
a, Numbers of CD19+ B cells and CD3+ T cells in PP of sham, stroke and stroke + LDC7559 treated young mice (n = 5−6 mice per group, two−tailed Mann−Whitney U test, CD19+ **P = 0.0043, CD3+ **P = 0.0022). b, Numbers of CD19+ B cells and CD3+ T cells in spleens of sham, stroke and stroke + LDC7559 treated young mice (n = 6−7 mice per group, two−tailed Mann−Whitney U test, **P = 0.0012). c, Numbers of CD19+ B cells and CD3+ T cells in PP of sham, stroke and stroke + LDC7559 treated old aged mice (n = 3−4 mice per group, ordinary one-way ANOVA, CD19+ sham vs stroke **P = 0.0078, stroke vs stroke+LDC7559 *P = 0.0427, CD3+ sham vs stroke *P = 0.0183, stroke vs stroke+LDC7559 *P = 0.027). d, Numbers of CD19+ B cells and CD3+ T cells in spleens of sham, stroke and stroke + LDC7559 treated aged mice (n = 3−4 mice per group, ordinary one-way ANOVA, CD19+ sham vs stroke **P = 0.0025, stroke vs stroke+LDC7559 *P = 0.0438, CD3+ sham vs stroke *P = 0.0463, stroke vs stroke+LDC7559 *P = 0.0138). Data represent mean ±s.d., All data is combined from at least two independent experiments, PP=Peyer’s patches.

Comment in

References

    1. Eastin, T. M. et al. Delayed revascularization in acute ischemic stroke patients. Front. Pharmacol.14, 1124263 (2023). 10.3389/fphar.2023.1124263 - DOI - PMC - PubMed
    1. Shi, K., Wood, K., Shi, F. D., Wang, X. & Liu, Q. Stroke-induced immunosuppression and poststroke infection. Stroke Vasc. Neurol.3, 34–41 (2018). 10.1136/svn-2017-000123 - DOI - PMC - PubMed
    1. Stanley, D. et al. Translocation and dissemination of commensal bacteria in post-stroke infection. Nat. Med.22, 1277–1284 (2016). 10.1038/nm.4194 - DOI - PubMed
    1. Liu, Y. et al. Risk estimation for infection in patients with ST-segment elevation myocardial infarction undergoing percutaneous coronary intervention: development and validation of a predictive score. Front. Cardiovasc. Med.9, 845307 (2022). 10.3389/fcvm.2022.845307 - DOI - PMC - PubMed
    1. Lycke, N. Y. & Bemark, M. The regulation of gut mucosal IgA B-cell responses: recent developments. Mucosal Immunol.10, 1361–1374 (2017). 10.1038/mi.2017.62 - DOI - PubMed

Publication types

MeSH terms