. 2023 Aug;2(8):746-763.
doi: 10.1038/s44161-023-00305-y. Epub 2023 Jul 17.

Efficient megakaryopoiesis and platelet production require phospholipid remodeling and PUFA uptake through CD36

Affiliations

Efficient megakaryopoiesis and platelet production require phospholipid remodeling and PUFA uptake through CD36

Maria N Barrachina et al. Nat Cardiovasc Res. 2023 Aug.

Abstract

Lipids contribute to hematopoiesis and membrane properties and dynamics; however, little is known about the role of lipids in megakaryopoiesis. Here we show that megakaryocyte progenitors, megakaryocytes and platelets present a unique lipidome progressively enriched in polyunsaturated fatty acid (PUFA)-containing phospholipids. In vitro, inhibition of both exogenous fatty acid functionalization and uptake as well as de novo lipogenesis impaired megakaryocyte differentiation and proplatelet production. In vivo, mice on a high saturated fatty acid diet had significantly lower platelet counts, which was prevented by eating a PUFA-enriched diet. Fatty acid uptake was largely dependent on CD36, and its deletion in mice resulted in low platelets. Moreover, patients with a CD36 loss-of-function mutation exhibited thrombocytopenia and increased bleeding. Our results suggest that fatty acid uptake and regulation is essential for megakaryocyte maturation and platelet production and that changes in dietary fatty acids may be a viable target to modulate platelet counts.


Conflict of interest statement

Competing interests

J.E.I. has financial interest in and is a founder of Stellular Bio, a biotechnology company focused on making donor-independent platelet-like cells for regenerative medicine. The interests of J.E.I. are managed by Boston Children’s Hospital. All other authors have no conflicts of interest to declare that are relevant to the content of this article.

Figures

Extended Data Fig. 1 |
Extended Data Fig. 1 |. Megakaryocytes and platelets have unique lipidomic profiles.
Murine bone marrow cell populations were isolated by fluorescence-activated cell sorting and platelets by sequential centrifugation. Lipids were extracted and analyzed using 20-min gradient HPLC and mass spectrometry (see methods for details). (a) Percentage of different lipid classes of indicated murine bone marrow cell populations and autologous platelets in lipidomic analyses. Volcano plots from the different lipid classes between (b) bone marrow extracellular fluid (BMEF) and MEPs. n = 4 and n = 8, respectively, (c) BMEF and immature (CD41+) MKs, n = 4 (d) BMEF and mature (CD41/42+) MKs, n = 4, and (e) platelets and plasma n = 4. Total percentage of all acyl/alkyl composition of (f) PC (g) PI, (h) PE, (i) PS. n = 8 for MEP and 4 for all other cell types, biological replicates. All data are presented as mean +/− SD. MK: megakaryocyte; MEP: MK-erythroid progenitor; PA: phosphatidic acid; PC: phosphatidylcholine; PE: phosphatidylethanolamine; PI: phosphatidylinositol; PS: phosphatidylserine; PG: phosphatidylglycerol.
Extended Data Fig. 2 |
Extended Data Fig. 2 |. Fatty acid uptake and synthesis affected MK differentiation but not mitochondria metabolism.
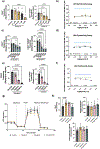
(a) Fetal liver-derived HSPCs were cultured with TPO and treated with the ACSL inhibitor Triacsin C at indicated doses. CD41+ and CD41/CD42d+ cells were quantified using flow cytometry, n = 5, one-way ANOVA – Dunnett’s test. Data are presented as mean +/− SD. (b) Cytotoxicity assay was performed on day 4 after fetal liver MKs were treated with Triacsin C. Control=cells treated with the vehicle; positive control=cells lysed with TritonX-100. n = 4. Data are presented as mean +/− SEM (c) Fetal liver derived HSPCs were cultured with TPO and treated with the ACC inhibitor PF-05175175 at indicated doses. CD41+ and CD41/CD42d+ cells were quantified using flow cytometry, n = 5, one-way ANOVA – Dunnett’s test. Data are presented as mean +/− SD (d) Cytotoxicity assay was performed day 4 after fetal liver MKs treated with PF-05175175. Control=cells treated with the vehicle; positive control=cells lysed with TritonX-100. n = 4. Data are presented as mean +/− SEM (e) Fetal liver derived HSPCs were cultured with TPO and treated with the FASN inhibitor Cerulenin at indicated doses CD41+ and CD41/CD42d+ cells were quantified using flow cytometry, n = 5, one-way ANOVA – Dunnett’s test. Data are presented as mean +/− SD (f) Cytotoxicity assay was performed day 4 after fetal liver MKs were treated with Cerulenin. Control=cells treated with the vehicle; positive control=cells lysed with TritonX-100, n = 4. Data are presented as mean +/− SEM (g) Representative graph of mitostress assay. MKs were treated with Triacsin C (T4540, Sigma), PF-05175175 (PZ0299, Sigma), Cerulenin (C2389, Sigma) at the indicated concentrations in complete media for 90 min prior the measurement. Oxygen consumption rates were measured in accordance with manufacturer instructions (Agilent/Seahorse Bioscience) n = 5 biological replicates (h) Individual parameters for basal respiration, maximal respiration, and spare respiratory capacity were measured and analyzed. n = 5 biological replicates, one-way ANOVA. Data are presented as mean +/− SD.
Extended Data Fig. 3 |
Extended Data Fig. 3 |. Blood cell counts and characteristics in SFA-enriched high fat diet.
Blood parameters were measured using a Sysmex hematology analyzer, (a) Platelet Distribution Width (PDW), (b) Mean Platelet Volume (MPV), (c) red blood cells, (d) white blood cells, (e) neutrophils; WT n = 12 and Cd36/ n = 16, animals per group, unpaired t-test (f) Platelet lifespan was assessed by flow cytometry measuring the fluorescence-positive platelet population at the indicated time points after injection of biotin-NHS. n = 5 animals per group, unpaired t-test. All data are presented as mean +/− SD.
Extended Data Fig. 4 |
Extended Data Fig. 4 |. Blood cell counts and characteristics in PUFA-enriched high fat diet.
Blood parameters were measured using a Sysmex hematology analyzer, (a) Platelet Distribution Width (PDW), (b) Mean Platelet Volume (MPV), (c) red blood cells; n = 10, unpaired t-test. (d) Platelet lifespan was assessed by flow cytometry measuring the fluorescence-positive platelet population at the indicated time points after injection of biotin-NHS. n = 5, unpaired t-test. Data are presented as mean +/− SD.
Extended Data Fig. 5 |
Extended Data Fig. 5 |. Candidate gene panel analysis.
Schematic of the bioinformatic pipeline workflow used for patient recruitment in the UK-GAPP study.
Extended Data Fig. 6 |
Extended Data Fig. 6 |. Mutant CD36 constructs are not trafficked to the cell surface.
WT and mutant CD36 constructs were transfected into both (a) Jurkat T cells and (b) HEK293 cells and surface expression was assessed. Flow cytometry scatter plots indicate that only wildtype CD36 is detected on the cell surface for both cell types. n = 3 biological replicates, unpaired t-test.
Extended Data Fig. 7 |
Extended Data Fig. 7 |. Gating strategies for flow cytometry panels.
In vitro studies with bone marrow and fetal liver MKs. Gating strategies of CD41+ and CD41/CD42d+ cells were analyzed using FlowJo. (b) Gating strategies to analyze hematopoietic stem cells and progenitors using FlowJo.
Fig. 1 |
Fig. 1 |. Megakaryocytes and platelets have a unique lipid profile that is enriched in PUFAs.
a, Murine bone marrow cell populations were isolated by fluorescence-activated cell sorting and platelets by sequential centrifugation. Lipids were extracted and analyzed using 20-min gradient HPLC and MS (see Methods for details) (n = 8 for MEP and n = 4 for all other cell populations). b, t-SNE analysis highlights lipidomic differences among MEPs, immature (CD41+) MKs, mature (CD41/42+) MKs and platelets. c, LION enrichment analysis showing the top 10 upregulated LION terms. d, Bulk RNA sequencing was performed on MKs immediately preceding and during proplatelet formation, and the heat map shows the log2 fold change of selected genes. e, Reactome enrichment analysis from bulk RNA sequencing on MKs reveals that canonical pathways altered include metabolism of lipids, synthesis of very long-chain fatty acyl-CoAs and fatty acyl-CoA biosynthesis. Color intensity is directly correlated to the FDR. fi, Total percentage of phospholipid classes (f) and lipid saturation levels (g) of indicated murine bone marrow cell populations in lipidomics analyses. Percentage of SFAs (h) and PUFAs with 6+ double bonds (i) in indicated cell populations (MEP, n = 8 biologically independent samples; CD41+ MKs, CD41/CD42+ MKs and platelets, n = 4 biologically independent samples; one-way ANOVA with Tukey’s multiple comparison test). Data are presented as mean ± s.d. Illustrations were done using BioRender.
Fig. 2 |
Fig. 2 |. Fatty acid incorporation and de novo lipogenesis are necessary for MK differentiation and efficient proplatelet formation.
a, Schematic of fatty acid functionalization through long-chain acyl-coA synthetase (ACSL). Murine bone marrow HSPCs were cultured with TPO and treated with the ACSL inhibitor triacsin C (1 μM and 3 μM). b, Representative images after 4 d of treatment, showing MKs (large cells) and surrounding HSPCs (n = 5; scale bar, 150 μm). c, CD41+ and CD41/CD42d+ cells were quantified using flow cytometry (n = 5; one-way ANOVA with Dunnett’s test). d, Schematic of de novo lipogenesis. e,f, Murine bone marrow HSPCs were cultured with TPO and treated on day 0 with acetyl-CoA carboxylase (ACC) and fatty acid synthetase (FASN) inhibitors (PF-05175157 (0.3 μM and 1 μM), n = 4, one-way ANOVA with Dunnett’s test (e) and cerulenin (1 μg ml−1 and 3 μg ml−1), n = 6 (f), respectively). Cells were quantified by flow cytometry, one-way ANOVA with Dunnett’s test. Data are presented as mean ± s.d. g, Mature fetal liver MKs (day 4) were treated with inhibitors at indicated dosages, and percentage of MKs making proplatelets and proplatelet area were quantified using the Incucyte high content imaging system. h, Representative phase contrast image showing example quantification of round (red outline) versus proplatelet-making (green outline) MKs (vehicle (left) and triacsin C, 3 μM (right)). i, Representative graph of vehicle (gray) and triacsin C (1 μM and 3 μM, dark and light yellow, respectively), n = 3, two-way ANOVA. Data are presented as mean ± s.e.m. j, Representative image of vehicle (left), triacsin 3 μM (right), β-tubulin (cyan), phalloidin (magenta) and DAPI (blue). Scale bar, 50 μm. k, Representative graph of vehicle (gray) and ACC inhibitor, PF-05175175 (0.1 μM and 0.3 μM, dark and light green, respectively), n = 3, two-way ANOVA. Data are presented as mean ± s.e.m. l, Representative image of vehicle (left), PF-05175175 1 μM (right), β-tubulin (cyan), phalloidin (magenta) and DAPI (blue). Scale bar, 50 μm. m, Representative graph of vehicle (gray) and FASN inhibitor, cerulenin (1 μg ml−1 and 3 μg ml−1, dark and light pink, respectively), n = 3, two-way ANOVA. Data are presented as mean ± s.e.m. n, Representative image of vehicle (left), cerulenin 1 μg ml−1 (right), β-tubulin (cyan), phalloidin (magenta) and DAPI (blue). Scale bar, 50 μm. Illustrations were done using BioRender.
Fig. 3 |
Fig. 3 |. A high-saturated-fat diet significantly alters MK phenotype and reduces platelet counts.
a, Schematic of click chemistry technique where fatty acids modified with an alkyne are supplemented into murine bone marrow HSPC cultures. After 4 d of culture, the fatty acid with the alkyne that incorporated into mature MKs was functionalized with an azide-linked fluorescent reporter to visualize its uptake into cells. b, Murine bone marrow HSPCs from wild-type mice were incubated with 100 μM modified palmitic acid (PA). After 4 d of maturation, MKs were isolated, and the azide-linked fluorescent reporter was added. The incorporation of PA was visualized using confocal microscopy (PA-alkyne (cyan); DAPI (blue); scale bar, 5 μm). c, MFI of MKs incubated with 10 μM and 100 μM PA was calculated using ImageJ (n = 3, one-way ANOVA with Dunnett’s test). d, Murine bone marrow HSPCs from wild-type mice were cultured with TPO and supplemented with 10 μM and 300 μM PA. Representative images show MK size. MK area was quantified using ImageJ (n = 4, one-way ANOVA with Dunnett’s test; scale bar, 150 μm). e, To examine proplatelet formation, mature MKs (day 4) were supplemented with PA (100 μM) or DMEM with 0.1% BSA (vehicle); the percentage of MKs making proplatelets at 24 h was quantified using the Incucyte high content imaging system (n = 4, unpaired t-test, two-tailed). f, Male mice were fed a 60% high-fat diet (DIO) (D12492, Research Diets) or chow diet (CHOW) (D12450B, Research Diets) for 14 weeks (n = 16, unpaired t-test). g, Mice were weighed at week 14 (n = 16 mice per group, unpaired t-test). h, LT-HSC, ST-HSC, Pre-GM, Pre-MK and MKP cell populations were quantified at week 14 using flow cytometry (n = 4, unpaired t-test). i, Representative images of bone marrow showing MKs (CD41, blue) and vasculature (laminin, pink) in femur cryosections. Scale bar, 50 μm. j, MK area and number were quantified manually from femur cryosections using ImageJ (CHOW n = 4 and DIO n = 7 biological replicates, unpaired t-test). k, Platelet counts were measured using a Sysmex hematology analyzer (CHOW n = 12 and DIO n = 16 biological replicates, unpaired t-test, two-tailed). Illustrations were done using BioRender. All data are presented as mean ± s.d. MUFA, monounsaturated fatty acid.
Fig. 4 |
Fig. 4 |. Platelet counts can be modified in vivo by altering dietary PUFA composition.
a, Murine bone marrow HSPCs were incubated with arachidonic acid (AA) modified with an alkyne group (3 μM and 10 μM). After 4 d, MKs were isolated, and a fluorescently conjugated azide was added. Incorporation of AA was visualized using confocal microscopy, and MFI was calculated using ImageJ (n = 3, one-way ANOVA with Dunnett’s test) (AA-alkyne (yellow), DAPI (blue); scale bar, 5 μm). b, Murine bone marrow HSPCs from wild-type mice were cultured with TPO and supplemented with AA (1 μM and 3 μM). On day 4, MK area was quantified using ImageJ (n = 6 and n = 3, respectively, one-way ANOVA with Dunnett’s test). c, Mature MKs (day 4) were cultured with AA at indicated dosages, and the percentage of MKs making proplatelets at 24 h was quantified using the Incucyte high content imaging system (n = 3, unpaired t-test, two-tailed). d, Male mice were fed a 60% high-fat diet enriched with PUFAs (D22050406i, Research Diets) or chow diet (CHOW) (D12450B, Research Diets) for 12 weeks (n = 10 mice per group). ej, Body weight (e) and glucose levels (f) were measured (n = 10, two-way ANOVA and unpaired t-test, two-tailed, respectively). Platelet counts were measured at week 4 (g) and week 12 (h) using a Sysmex hematology analyzer (n = 10, unpaired t-test, two-tailed). Newly made platelets were analyzed by quantifying percentage (i) and absolute platelet numbers (j) positive for thiazole orange by flow cytometry (CHOW n = 5 and PUFA n = 4 biological replicates, unpaired t-test, two-tailed). k, Representative images showing MKs (CD41, blue) and vasculature (laminin, pink) in femur cryosections at week 12. Scale bar, 50 μm. l, MK area and number were quantified from femur cryosections using ImageJ (CHOW n = 4 and PUFA n = 3 biological replicates, unpaired t-test, two-tailed). m, Ploidy analysis of native bone marrow MKs assessed by propidium iodide staining and quantified by flow cytometry (n = 5, two-way ANOVA). Illustrations were done using BioRender. All data are presented as mean ± s.d. MUFA, monounsaturated fatty acid.
Fig. 5 |
Fig. 5 |. Lack of CD36 in mice reduces cellular fatty acid incorporation and impairs proplatelet formation.
Platelets and MKs were characterized in adult male wild-type (WT) and Cd36/ mice. a, Platelet counts, MPV and platelet distribution (PDW) were measured using the Sysmex hematology analyzer (WT, n = 16 and Cd36/, n = 20 biological replicates, unpaired t-test, two-tailed). b, Red blood cell (RBC) and monocyte counts were measured using the Sysmex hematology analyzer (unpaired t-test, two-tailed, WT n = 16 and Cd36/ n = 20 biological replicates). ce, HSCs from WT and Cd36/ mice were cultured with palmitic acid or arachidonic acid (AA) modified with an alkyne group at indicated dosages. After 4 d of maturation, MKs were isolated, and click chemistry was performed as described. c, Representative images of MKs from WT and Cd36/ mice. MFI was calculated using ImageJ (blue: palmitic acid (100 μM); scale bar, 5 μm). Incorporation of palmitic acid (d) and AA (e) was visualized using confocal microscopy, and MFI was calculated using ImageJ (WT n = 3 and Cd36/ n = 4 biological replicates, unpaired t-test, two-tailed). f, Murine bone marrow HSPCs from WT and Cd36/ mice were cultured with TPO. After 4 d of maturation, the number of mature MKs (CD41/CD42d+ cells) was measured using flow cytometry (WT n = 3 and Cd36/ n = 4 biological replicates, unpaired t-test, two-tailed). g, MK number and area were quantified from femur cryosections using ImageJ (WT n = 3 and Cd36/ n = 4 biological replicates, unpaired t-test). Representative images show MKs (CD41, blue) and vasculature (laminin, pink). Scale bar, 50 μm. h, Ploidy analysis of cultured bone marrow MKs assessed by propidium iodide staining and flow cytometry. Percentage of CD41+ cells with different levels of ploidy is shown (n = 4, two-way ANOVA). i,j, Proplatelet formation was quantified from mature MKs (day 4) from WT and Cd36/ mice in the presence of hirudin. i, Representative graph of proplatelet area from n = 4. Data are presented as mean ± s.e.m. j, Proplatelet percentage at 24 h was quantified using the Incucyte high content imaging system (n = 6, unpaired t-test, two-tailed). All data are presented as mean ± s.d.
Fig. 6 |
Fig. 6 |. Megakaryocytes and platelet counts in Cd36−/− mice are not affected by high-fat diets enriched in fatty acids.
Adult male wild-type (WT) and Cd36/ mice were fed chow diets (CHOW) or high-fat diets enriched in SFAs (DIO) or PUFAs as in Figs. 3 and 4, respectively, for 13 weeks. a–i, At week 8, platelet counts (a) and MPV (b) were measured using the Sysmex hematology analyzer, and newly made platelets (c) were analyzed by quantifying percentage and absolute platelet numbers positive for TO by flow cytometry (n = 3 (CHOW), n = 4 (DIO) and n = 3 (PUFA) mice per group, one-way ANOVA with Dunnett’s test). At week 13, platelet counts (d), MPV (e) and newly made platelets (f) were measured as above. g, Representative images showing MKs (CD41, blue) and vasculature (laminin, pink) in femur cryosections at week 13 in indicated treatment groups. Scale bar, 50 μm. MK area (h) and number (i) were quantified from femur cryosections using ImageJ (n = 3 mice per group, one-way ANOVA with Dunnett’s test). All data are presented as mean ± s.d.
Fig. 7 |
Fig. 7 |. Identification of a CD36 loss-of-function variant (p.Tyr325Ter) in patients with thrombocytopenia.
a, Family pedigree including affected mother (I.2) and patients II.1 and II.2 highlighted in solid black. Asterisks (*) indicate patients whose whole exomes were sequenced. b, Details and hematological parameters of patients II.1 and II.2. MPV values are shown in the table as ‘Large’ because platelets with large volume are undetectable by Sysmex hematology analyzer. c, The nonsense variant c.975T > G; p. Tyr325Ter results in the substitution of tyrosine residue at position 325 to a stop codon, which is predicted to truncate the full length of 472 amino acids. d, Mutation details. e, Western blot of protein lysate from patient platelets showing truncation of CD36 protein and GAPDH loading control. f, Conservation of tyrosine 325 residue across multiple species. The location of the tyrosine residue is shown by the highlighted green box. g, Modeled structure of the CD36 ectodomain using homology modeling. The structure shows the result of the CD36 nonsense variant on the structure of the wild-type CD36 protein (left) and mutant CD36 (right) because of the truncation. h, Schematic of the CD36 protein structure. CD36 has two short cytoplasmic domains representing the C-terminal and N-terminal, two transmembrane domains and two large extracellular domains. The extracellular domain contains three disulfide bonds, binding sites of interaction with thrombospondin type I repeat (TSR), plasmodium falciparum, oxLDL, sites of acetylation (palmitoylation), phosphorylation, glycosylation and the position of the nonsense variant found in patients II.1 and II.2 (refs. 56,57). i, Protein expression of transfected CD36 wild-type and CD36 mutants. C, pEF6 empty vector; Del, pEF6/CD36 deleted mutant; Sub, pEF6/CD36 substitution mutant; WT, pEF6/CD36 wild-type. SDS-PAGE immunoblot expression analysis of samples probed with anti-CD36 and anti-GAPDH antibodies. Expected sizes of the samples are indicated on the right. j, NFAT-luciferase activity measuring activation of CD36 after normalization of the stimulated and unstimulated conditions. Only wild-type CD36 shows luciferase activity over background (n = 3 biological replicates, one-way ANOVA with Dunnett’s test). Data are presented as mean ± s.d. F, female; M, male; Mono, monocyte; oxLDL, oxidized low-density lipoprotein; RBC, red blood cell; WBC, white blood cell.

References

    1. van Meer G, Voelker DR & Feigenson GW Membrane lipids: where they are and how they behave. Nat. Rev. Mol. Cell Biol. 9, 112–124 (2008). - PMC - PubMed
    1. Murphy AJ et al. ApoE regulates hematopoietic stem cell proliferation, monocytosis, and monocyte accumulation in atherosclerotic lesions in mice. J. Clin. Invest. 121, 4138–4149 (2011). - PMC - PubMed
    1. Bansal P et al. Current updates on role of lipids in hematopoiesis. Infect. Disord. Drug Targets 18, 192–198 (2018). - PubMed
    1. Lee MKS, Al-Sharea A, Dragoljevic D & Murphy AJ Hand of FATe: lipid metabolism in hematopoietic stem cells. Curr. Opin. Lipidol. 29, 240–245 (2018). - PubMed
    1. Pernes G, Flynn MC, Lancaster GI & Murphy AJ Fat for fuel: lipid metabolism in haematopoiesis. Clin. Transl. Immunol. 8, e1098 (2019). - PMC - PubMed

MeSH terms

LinkOut - more resources