. 2024 Aug;3(8):970-986.
doi: 10.1038/s44161-024-00507-y. Epub 2024 Jul 17.

Cytotoxic T cells drive doxorubicin-induced cardiac fibrosis and systolic dysfunction

Affiliations

Cytotoxic T cells drive doxorubicin-induced cardiac fibrosis and systolic dysfunction

Abraham L Bayer et al. Nat Cardiovasc Res. 2024 Aug.

Abstract

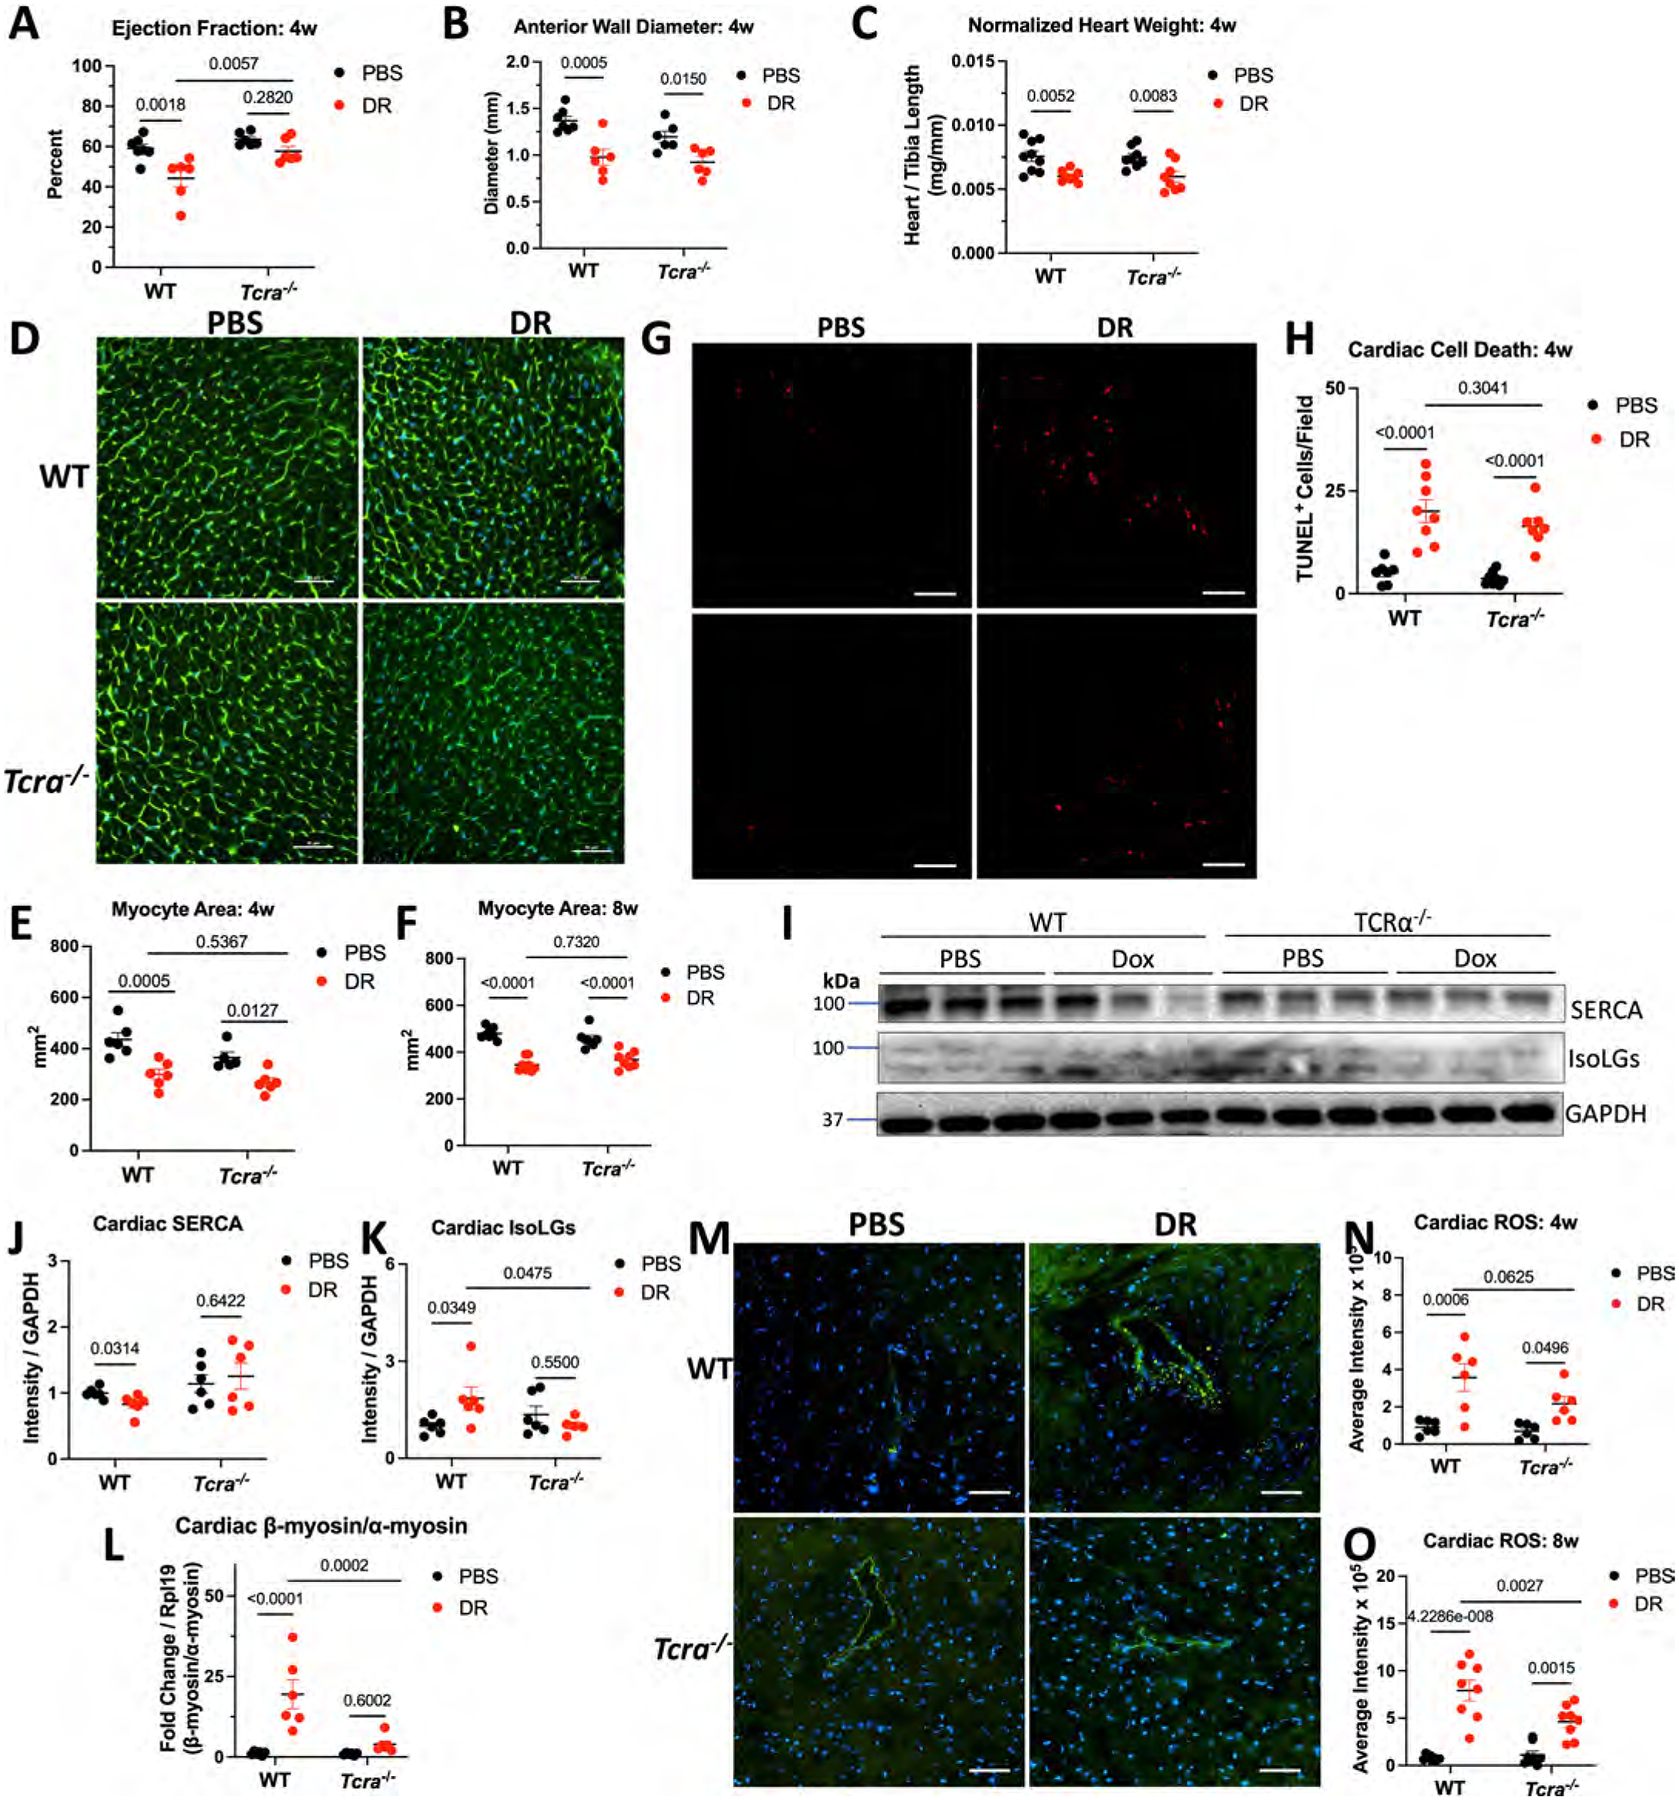
Doxorubicin, the most prescribed chemotherapeutic drug, causes dose-dependent cardiotoxicity and heart failure. However, our understanding of the immune response elicited by doxorubicin is limited. Here we show that an aberrant CD8+ T cell immune response following doxorubicin-induced cardiac injury drives adverse remodeling and cardiomyopathy. Doxorubicin treatment in non-tumor-bearing mice increased circulating and cardiac IFNγ+CD8+ T cells and activated effector CD8+ T cells in lymphoid tissues. Moreover, doxorubicin promoted cardiac CD8+ T cell infiltration and depletion of CD8+ T cells in doxorubicin-treated mice decreased cardiac fibrosis and improved systolic function. Doxorubicin treatment induced ICAM-1 expression by cardiac fibroblasts resulting in enhanced CD8+ T cell adhesion and transformation, contact-dependent CD8+ degranulation and release of granzyme B. Canine lymphoma patients and human patients with hematopoietic malignancies showed increased circulating CD8+ T cells after doxorubicin treatment. In human cancer patients, T cells expressed IFNγ and CXCR3, and plasma levels of the CXCR3 ligands CXCL9 and CXCL10 correlated with decreased systolic function.


Conflict of interest statement

Competing interests

The authors have no competing interests to declare.

Figures

Extended Data Fig. 1 |
Extended Data Fig. 1 |. Doxorubicin Effects on Cardiac and Circulating Myeloid Populations.
WT mice were treated with PBS or 5.0 mg/kg DR for 4 or 8 weeks (n = 7–10 mice / group). A. Hearts were digested and analyzed by flow cytometry, shown is the gating strategy used for T-cells and myeloid populations, and quantification by frequency or total cell number for CD11b+ cells (B,F), CD11b+CCR2+ cells (C,G), CD11b+Ly6G− cells (D,H), or CD11b+MertK+ cells (E, I). J. Whole blood was analyzed by flow cytometry, shown is gating strategy for T-cells and myeloid populations, and quantification for CD11b+CCR2+ cells (K), or CD11b+Ly6G− cells (L). All data shown are mean±SEM. Statistical analysis by 2-way ANOVA with Sidak’s multiple comparison test, exact p-values shown.
Extended Data Fig. 2 |
Extended Data Fig. 2 |. Female Mice Treated with Doxorubicin Exhibit Cardiotoxicity and Cardiac CD8+ T-cell Infiltration.
A. Schematic of DR treatment in female mice (n = 7 mice / group). B-C. Echocardiography was used to measure ejection fraction and wall thickness one day prior to tissue collection. D. Whole heart weight normalized to tibia length. E-F. Formalin fixed cardiac samples were stained with TUNEL, representative images shown in E with scale bars of 50 μm quantified using ImageJ in F. G-J. Hearts were enzymatically and mechanically digested and analyzed for cardiac T-cells by flow cytometry (gating strategy in Supplementary Fig. 1). Quantification by frequency shown in G, I and by total cell number in H, J. K-L. Whole blood was analyzed by flow cytometry for circulating T-cells (gating strategy in Supplementary Fig. 1) quantified in K-L. All data shown are mean±SEM. Statistical analysis by 2 sided T-tests, exact p-values shown.
Extended Data Fig. 3 |
Extended Data Fig. 3 |. Gating Strategies for Lymphoid Organ Effector Populations.
WT mice were treated with PBS or 5.0 mg/kg DR for 4 or 8 weeks (n = 7–10 mice / group). A. Mediastinal lymph nodes or spleens were digested and analyzed by flow cytometry. Shown is gating strategy for effector and memory T-cells. B–E. Quantification of memory CD8+ T-cells by frequency (B,D) and total number (C,E) in the mLN and spleen. F. Representative plots for CD4+ effector T-cells from 8 week treated mice (gated on CD45+CD11b-CD4+ cells), with quantification for mLN (G-H) or splenic T-cells (I-J). K-N. Quantification of mLN and splenic effector CD8+ T-cells from female mice treated with DR for 4 weeks. All data shown are mean±SEM. Statistical analysis by 2-way ANOVA with Sidak’s multiple comparison test (B-J) or unpaired 2 sided T-test (K-N), exact p-values shown
Extended Data Fig. 4 |
Extended Data Fig. 4 |. Lymphoid T-cells Do Not Increase Exhaustion Markers in Response to Doxorubicin.
WT mice were treated with PBS or 5.0 mg/kg DR for 4 or 8 weeks (n = 7–9 mice per group), and mediastinal lymph nodes or spleens were digested and analyzed by flow cytometry. A. Gating strategy for T-cell PD-1 and CTLA-4 expression. B-C Quantification of relative mLN CD4+ T-cell PD-1 and CTLA-4 expression, with representative plots shown in D-E. F-G. Quantification of relative mLN CD8+ T-cell PD1 and CTLA-4 expression. H-I. Quantification of relative splenic CD4+ T-cell PD-1 and CTLA-4 expression. J-K. Quantification of relative splenic CD8+ T-cell PD-1 and CTLA-4 expression. All data shown are mean±SEM. Statistical analysis by 2-way ANOVA with Sidak’s multiple comparison test, exact p-values shown.
Extended Data Fig. 5 |
Extended Data Fig. 5 |. Doxorubicin Increases Multiple Helper T-cell Subtypes in Lymphoid Organs.
A. Schematic showing helper T-cell differentiation and transcription factors probed to quantify each subtype (n = 7–9 mice / group). B. Gating strategy used to identify T-cell transcription factors in digested mediastinal lymph nodes (mLN) or spleens form PBS or DR-treated mice, with quantification of mLN Th17 cells (C), mLN Th2 cells (D), splenic Th17 cells (E), or splenic Th2 cells (F). G. Representative plots of splenic CD4+ Tbx21 staining from 8 week treated mice (gated on CD45+CD11b-CD4+ cells), with quantification for splenic Th1 cells (H) or mLN Th1 cells (I). All data shown are mean±SEM. Statistical analysis by 2-way ANOVA with Sidak’s multiple comparison test, exact p-values shown.
Extended Data Fig. 6 |
Extended Data Fig. 6 |. Analysis of Doxorubicin Treatment in Antibody Depleted Mice.
WT mice were treated with Doxorubicin alongside anti-CD4 and anti-CD8 antibody depletion (see Fig. 4, n = 6 mice / group). A–C. mLN were digested and analyzed by flow cytometry, representative plots shown in A with quantified CD4+ T-cells (B) or CD8+ T-cells (C). D-F. Spleens were digested and analyzed by flow cytometry, representative plots shown in D with quantified CD4+ T-cells (E) or CD8+ T-cells (F). G-H. Cardiac sections were stained with wheat-germ agglutinin to measure cardiomyocyte area, representative images in G with scale bars of 50 μm, quantified using ImageJ in H. I-J. Cardiac sections were stained with anti-CD8 and analyzed by immunofluorescence, representative image identifying CD8+ T-cells shown in I. T-cells were counted manually and quantified in J. All data shown are mean±SEM. Statistical analysis by 1-way ANOVA with Tukey’s multiple comparison test, ns = no significance, exact p-values shown.
Extended Data Fig. 7 |
Extended Data Fig. 7 |. Analysis of Doxorubicin Treatment in Antibody Depleted Mice Cont.
A–C. WT mice were treated with Doxorubicin for 4 or 8 weeks (n = 7–9 mice / group), mLN were digested and analyzed by flow cytometry, (gating strategy in Supplementary Fig. 6). A. Frequency of Foxp3+CD4+ T-cells. B. Relative intensity of Helios expression in Foxp3+CD4+ T-cells, with representative plots for Helios staining in C. D-I. WT mice were treated with Doxorubicin alongside CD4 and CD8 antibody depletion (see Fig. 4, n = 6 mice / group). D-E. Cardiac sections were stained with TUNEL, representative images in D. with scale bars of 50 μm, quantified using ImageJ in E. F-G. Cardiac lysate was analyzed by western blotting for cleaved caspase 3, representative blot for n = 3 mice shown in F. quantified for n = 6 mice in G. H-I Cardiac sections were stained with picrosirius red, representative images in h. with scale bars of 50 μm, quantified using imageJ in I. All data shown are mean±SEM. Statistical analysis by 2 sided T-test (A-B), or 1-way ANOVA with Tukey’s multiple comparison test (E-I), exact p-values shown.
Extended Data Fig. 8 |
Extended Data Fig. 8 |. Tcra−/− mice Are Partially Protected from Doxorubicin Cardiomyopathy.
Age matched WT or Tcra−/− mice were treated with DR or PBS for 4 weeks (n = 6–8 mice / group). A-B. Echocardiography was used to measure ejection fraction and wall thickness one day prior to tissue collection. C. Whole heart weight normalized to tibia length. D. Frozen cardiac samples were stained with Wheat Germ Agglutinin (WGA), representative images shown in D with scale bars of 50 μm quantified using ImageJ in E-F. G-H. Formalin fixed cardiac samples were stained with TUNEL, representative images shown in G with scale bars of 50 μm quantified using ImageJ in H (TCR samples compared to 4w WT from Fig. 1). I-K. Cardiac lysate from PBS or 8w DR treated mice was analyzed by western blot for SERCA or IsoLG expression, representative blots for n = 3 mice show in I with quantification from n = 6 mice in J-K. L. Cardiac RNA was analyzed by RT-qPCR for alpha and beta myosin. M. Frozen cardiac samples were stained with DCFDA, representative images shown in M. with scale bars of 50 μm quantified using ImageJ in N-O. All data shown are mean±SEM. Statistical analysis by 2-way ANOVA with Sidak’s multiple comparison test.
Extended Data Fig. 9 |
Extended Data Fig. 9 |. Adoptive Transfer of Tc1 Cells Restores Doxorubicin Cardiotoxicity.
A. Schematic of DR treatment in Tcra−/− mice alongside adoptive transfer of Tc1 cells (n = 6 mice / group). B-C. Echocardiography was used to measure ejection fraction and wall thickness one day prior to tissue collection. D. Whole heart weight normalized to tibia length. E. Gating strategy for identification of CD8+ T-cells in the heart of lymphoid organs. Quantification of CD8+ T-cell number in the mediastinal lymph nodes (F), spleen (G), or heart (H). I-L. Formalin fixed cardiac samples were stained with picrosirius red, representative images shown in I/K. with scale bars of 50 μm quantified using ImageJ in the interstitial region (J), or perivascular region (L). m-n. Formalin fixed cardiac samples were stained with TUNEL, representative images shown in M. with scale bars of 50 μm quantified using ImageJ (N). All data shown are mean±SEM. Statistical analysis by 2 sided T-tests, exact p-values shown.
Extended Data Fig. 10 |
Extended Data Fig. 10 |. Gating Strategy for Patient Blood, Human T-cell Granzyme B Expression.
Whole blood was analyzed by flow cytometry from canine or human patients before or after anthracycline initiation. A. Gating strategies for T-cells from canine patients. B. Gating strategies for T-cells and additional markers from human patients. C. Representative plots for CD8 T-cell Granzyme B expression (gated on CD45+CD3+CD8+ cells), with quantification in D. Data from n = 5 patients shown paired before/after treatment. Statistical analysis by paired 2 sided T-test, p-value shown.
Fig. 1 |
Fig. 1 |. CD8+ T cells infiltrate the heart concurrently with DR-induced cardiac pathology and systemic inflammation.
a, A schematic of DR treatment given by intraperitoneal (IP) injection. All data include n = 8–10 mice per group. bf, Hearts from WT PBS- or DR-treated mice were digested and analyzed by flow cytometry. Representative plots showing cardiac T cells (gated on CD45+CD11b cells) in 8-week treated mice shown in b, quantified for CD8 T-cells by frequency (c) or total number (d) and CD4 T-cells by frequency (e) or total number (f) at 4 and 8 weeks. g, Representative immunohistochemistry for CD8 in cardiac sections of PBS or 8-week DR-treated mice. Scale bars, 50 μm. h,i, Echocardiography was used to measure EF (h) and wall thickness (i) 1 day before tissue collection. j, Whole-heart weight normalized to tibia length. k,l, Formalin-fixed cardiac samples were stained with TUNEL. Representative images are shown in k with scale bars, 50 μm, quantified using ImageJ in l. mo. Whole blood from PBS- or DR-treated mice was analyzed by flow cytometry. Representative plots showing circulating T cells (gated on CD45+CD11b cells) in 8-week treated mice shown in m, quantified for CD8 T-cells (n) and CD4 T-cells (o) at 4 and 8 weeks. All data shown are mean ± s.e.m. Statistical analysis by two-way ANOVA with Sidak’s multiple comparison test, exact P values are shown.
Fig. 2 |
Fig. 2 |. DR Induces a IFNγ-Tbx21 CD8+ T cell response that increases IFNγ-inducible T cell chemoattractants.
ah, mLN or spleens from WT PBS- or DR-treated mice were digested and analyzed by flow cytometry. Representative plots showing gating strategies (gated on CD45+CD11bCD8+ cells) in 8-week treated mice shown for effector and memory T cells (a), quantified for mLN CD8+ T-cells by frequency (b) or total number (c) and splenic CD8+ T-cells by frequency (d) or total number (e) at 4 and 8 weeks, and representative plots for Tbx21+ T cells in f quantified for mLN in g and spleen in h at 4 and 8 weeks. i,j, Hearts from WT PBS- or DR-treated mice were digested, CD45+ cells were isolated by magnetic sorting and then stimulated for analysis by intracellular cytokine staining using flow cytometry. Representative plots showing cardiac IFNγ+ T cells (gated on CD45+CD11bCD8+ cells) in 8-week treated mice shown in i, and quantified in j at 4 and 8 weeks. ko, Heart samples were analyzed by RT–qPCR for Ifng (k), Cxcl9 (l) or Cxcl10 (n) and by ELISA for CXCL9 (m) or CXCL10 (o). Data in aj include n = 8–10 mice per group. Data in ko include 6 mice/group randomly chosen for analysis. All data shown are mean ± s.e.m. Statistical analysis by two-way ANOVA with Sidak’s multiple comparison test (be and jo) or two-sided t-tests (g and h), exact P values are shown.
Fig. 3 |
Fig. 3 |. DR directly increases cytokine secretion and CD8+ T cell degranulation.
a,b, WT CD8+ T cells were activated using αCD3 and αCD28 for 3 days in the presence or absence of DR, then analyzed by flow cytometry. Representative plots for IFNγ staining gated on live cells shown in a and quantified in b from n = 4–5 independent T cell cultures. c, WT CD8+ T cells activated in the presence or absence of DR were analyzed for the Ifng transcript by RT–qPCR. d, Whole-heart lysate from n = 6 WT PBS- or DR-treated mice for 4 or 8 weeks and Tcra−/− mice treated for 8 weeks were analyzed for granzyme B by ELISA. e,f, WT CD8+ T cells were activated, then rested in complete T cell medium overnight before treatment for 5 h with DR in the presence of PE-αCD107a then analyzed by flow cytometry. Representative CD107a staining shown in e and quantified gated on live cells in f from n = 4 independent T cell cultures. gl, Hearts from n = 7–10 WT PBS- or DR-treated mice were digested then analyzed using flow cytometry. Representative plots (gated on CD45+CD11bCD8+ cells) shown for 8-week treated mice, CD107a staining shown in g and quantified at 4 and 8 weeks by frequency in h or total cell number per mg tissue digested in i. Granzyme B (GZMB) staining shown in j and quantified at 4 and 8 weeks by frequency in k or total cell number per mg tissue digested in l. All data shown are mean ± s.e.m. Statistical analysis by two-sided t-test (b, c and f) or two-way ANOVA with Sidak’s multiple comparison test (d and hl), exact P values are shown.
Fig. 4 |
Fig. 4 |. CD8 but not CD4 T cells drive cardiac fibrosis and systolic dysfunction in response to DR.
a, A schematic of DR treatment and antibody depletion, all data shown are from n = 6 mice. bd, Whole blood was analyzed by flow cytometry for circulating T cells, shown in b are representative plots (gated on CD45+CD11b cells) quantified for CD4 T-cells in c and CD8 T-cells in d. e,f, Echocardiography was used to measure EF and wall thickness 1 day before tissue collection. g, Whole-heart weight normalized to tibia length. h, Cardiac RNA was isolated and analyzed by RT–qPCR for β- and α-myosin. ik, mLN were digested and analyzed by flow cytometry. Representative plots and gating strategy for effector and memory T cells (gated on CD45+CD11bCD8+ cells) shown in i and quantified by total cell number for effector T-cells in j and memory T-cells in k. l,m, Formalin-fixed cardiac samples were stained with PSR, representative images shown in l with scale bars, 50 μm and quantified using ImageJ in m. np, Cardiac lysate was analyzed by western blot for collagens, with representative blots from three mice shown in n and quantified for n = 6 mice for ColI in o and Col3 in p. All data shown are mean ± s.e.m. Statistical analysis by one-way ANOVA with Tukey’s multiple comparison test, exact P values are shown.
Fig. 5 |
Fig. 5 |. DR induces antigen-specific CD8+ T cell activation required for cardiac fibrosis and systolic dysfunction.
a, A schematic of DR treatment of OTI mice and vaccination with OVA and incomplete freunds adjuvant (IFA), all data include n = 6 mice per group. b,c, Echocardiography was used to measure EF (b) and wall thickness (c) 1 day before tissue collection. d, Whole-heart weight normalized to tibia length. eg, mLN or spleens were digested and analyzed by flow cytometry. Representative plots and gating strategy for activated CD44+ T cells (gated on CD45+CD11bCD8+ cells) shown in e and quantified for spleen (f) or mLN (g). h, Hearts were digested enzymatically and mechanically and analyzed by flow cytometry for CD8+ T cells, shown as total number normalized to mass of digested tissue. il, Cardiac lysate was analyzed by western blot for collagens and cleaved caspase 3 with representative blots from n = 3 mice in i and quantification from n = 6 mice for Col1 (j), Col3 (k), or Cleaved caspase 3 (l). m,n, Formalin-fixed cardiac samples were stained with PSR, representative images shown in m with scale bars, 50 μm quantified using ImageJ in n. o,p, Formalin-fixed cardiac samples were stained with TUNEL, representative images shown in o with scale bars, 50 μm quantified using ImageJ in p. All data shown are mean ± s.e.m. Statistical analysis by one-way ANOVA with Tukey’s multiple comparison test, exact P values are shown.
Fig. 6 |
Fig. 6 |. T cell deficient mice are partially protected from DR cardiomyopathy and develop less fibrosis than WT.
Age-matched WT or Tcra−/− mice were treated with DR or PBS for 8 weeks (n = 7–8 mice per group). a,b, Echocardiography was used to measure EF (a) and wall thickness (b) 1 day before tissue collection. c, Whole-heart weight normalized to tibia length. d, Cardiac RNA was isolated and analyzed by RT–qPCR for Anp from n = 6 mice per group. e,f, Formalin-fixed cardiac samples were stained with TUNEL, representative images shown in e with scale bars, 50 μm quantified using ImageJ in f (TCR samples compared to 8-week WT from Fig. 1). g,h, Formalin-fixed cardiac samples were stained with PSR, representative images shown in g with scale bars, 50 μm quantified using ImageJ in h. i,j, Cardiac RNA was analyzed by RT–qPCR for Col1 (i) or Tgfb (j) from n = 6 mice per group. kn, Cardiac lysate was analyzed by western blot for Col1 (l), Col3 (m) and cleaved caspase 3 (n) with representative blots from n = 3 mice in k and quantification from n = 6 mice in ln. o,p, Primary CFB were treated for 16 h with DR as indicated, then fixed and stained for aSMA using immunofluorescence microscopy, representative images with scale bars, 50 μm shown in o and quantified using ImageJ in p from n = 5 independent experiments. All data shown are mean ± s.e.m. Statistical analysis by two-way ANOVA with Sidak’s multiple comparison test (an) or one-way ANOVA with Tukey’s multiple comparison test (p), exact P values are shown.
Fig. 7 |
Fig. 7 |. DR induces CFB ICAM-1 increasing CD8+ T cell adhesion and contact-dependent degranulation.
ac, WT primary CFB (n = 3–4 independent experiments) were treated for 16 h with 0.1 μg ml−1 DR then collected and analyzed for ICAM-1 and VCAM-1 transcript by RT–qPCR (a) or stained for ICAM-1 and VCAM-1 for flow cytometry analysis. Representative plots in b and quantified by mean fluorescence intensity (MFI) in c compared to unstained samples (US). d, A schematic of T cell fibroblast coculture with proposed activation mechanism for myofibroblasts (MFB). eg, WT primary CFB were pretreated with 0.1 μg ml−1 DR for 16 h where indicated and WT CD8+ (Tc1) cells were added at a ratio of 1:5 CFB:Tc1 where indicated, switched to regular media (DR washout) or included αLFA-1/αVLA-4 blocking antibodies at 20 μg ml−1 where indicated, then stained for CD8 and αSMA. Shown are representative images with scale bars, 50 μm (e). αSMA was quantified with ImageJ (f) and T cells were counted manually per high powered field (hpf) of view (g) from n = 3–5 independent experiments. h, Representative schematic of the fibroblast pretreatment strategy to induce T cell degranulation, in which fibroblasts were pretreated for 16 h with 0.1 μg ml−1 DR, washed, and then Tc1 cells were added at a ratio of of 1:5 CFB:Tc1 for 5 h in the presence of PE CD107a, then analyzed by flow cytometry. Representative plots shown in i with quantification from n = 3 independent experiments in j. kp, WT CFB were treated with recombinant granzyme B at the indicated concentrations and stained for αSMA by immunofluorescence from n = 3 independent experiments, representative images with scale bars, 50 μm in k and quantified in l. Representative western blots of granzyme B treated fibroblasts in m with quantification for Col1 (n), Col3 (o), or aSMA (p). All data shown are mean ± s.e.m. Statistical analysis by two-sided t-tests (a, c and j) or one-way ANOVA with Tukey’s multiple comparison test (f, g and l–p), exact P values are shown.
Fig. 8 |
Fig. 8 |. Canine and human patients treated with anthracyclines develop a progressive CD8+ T cell response.
ad, Whole blood was analyzed by flow cytometry from n = 36 canine patients before (pre) or after anthracycline initiation at time points listed. CD8+ T cells at 1 month posttreatment (a) or 4 months posttreatment (b), and CD4+ T cells at 1 month posttreatment (c) or 4 months posttreatment (d). ek, Whole blood was analyzed by flow cytometry from n = 5 patients before (pre) or 3 months after anthracycline initiation. Shown are representative plots for T cells (gated on CD45+CD3+) in e, quantified for CD8 T-cells in f and CD4 T-cells in g. Representative plots (gated on CD45+CD3+CD8+) for CD8+ T cell IFNγ (h) or CXCR3 expression (j) quantified for IFNγ+ T-cells in i and CXCR3+ T-cells in k. ln, The change in EF by echocardiography plotted against plasma levels of CXCL9 (l) or CXCL10 (m) measured using Somascan in patients 3 months or 6 months (n) after anthracycline initiation. All data shown are individual patients, bk show paired before/after. Statistical analysis by two-sided t-tests (ad), two-sided paired t-tests (fk) or Pearson’s correlation with r, R2 and P values shown (ln). *P ≤ 0.05, **P < 0.01 or P value shown. Patient characteristics can be found in Supplementary Tables 3 and 4.

References

    1. Chatterjee K, Zhang J, Honbo N & Karliner JS Doxorubicin cardiomyopathy. Cardiology 115, 155–162 (2010). - PMC - PubMed
    1. Nebigil CG & Désaubry L Updates in anthracycline-mediated cardiotoxicity. Front. Pharmacol 9, 1262 (2018). - PMC - PubMed
    1. Bennett P, Williamson P & Taylor R Review of canine lymphoma treated with chemotherapy—outcomes and prognostic factors. Vet. Sci 10, 342 (2023). - PMC - PubMed
    1. Henriksen PA Anthracycline cardiotoxicity: an update on mechanisms, monitoring and prevention. Heart 104, 971–977 (2018). - PubMed
    1. Brown S, Okwuosa TM, Barac A & Volgman AS The role of angiotensin-converting enzyme inhibitors and β-blockers in primary prevention of cardiac dysfunction in breast cancer patients. J. Am. Heart Assoc 9, e015327 (2020). - PMC - PubMed

MeSH terms

LinkOut - more resources