. 2024 Aug;3(8):987-1002.
doi: 10.1038/s44161-024-00512-1. Epub 2024 Jul 18.

Cardiac troponin I directly binds and inhibits mitochondrial ATP synthase with a noncanonical role in the post-ischemic heart

Affiliations

Cardiac troponin I directly binds and inhibits mitochondrial ATP synthase with a noncanonical role in the post-ischemic heart

Aly Elezaby et al. Nat Cardiovasc Res. 2024 Aug.

Abstract

Cardiac troponin I (cTnI) is a key regulator of cardiomyocyte contraction. However, its role in mitochondria is unknown. Here we show that cTnI localized to mitochondria in the heart, inhibited mitochondrial functions when stably expressed in noncardiac cells and increased the opening of the mitochondrial permeability transition pore under oxidative stress. Direct, specific and saturable binding of cTnI to F1FO-ATP synthase was demonstrated in vitro using immune-captured ATP synthase and in cells using proximity ligation assay. cTnI binding doubled ATPase activity, whereas skeletal troponin I and several human pathogenic cTnI variants associated with familial hypertrophic cardiomyopathy did not. A rationally designed peptide, P888, inhibited cTnI binding to ATP synthase, inhibited cTnI-induced increase in ATPase activity in vitro and reduced cardiac injury following transient ischemia in vivo. We suggest that cTnI-bound ATP synthase results in lower ATP levels, and releasing this interaction during cardiac ischemia-reperfusion may increase the reservoir of functional mitochondria to reduce cardiac injury.


Figures

Extended Data Figure 1.
HEK-cTnI cells have similar mitochondrial mass and decreased mitochondrial respiration. (a) Citrate synthase activity is unchanged in HEK-cTnI cells relative to HEK-GFP cells and HEK control cells; n=4. (b-c) HEK-cTnI cells have unchanged VDAC1 protein levels relative to HEK-GFP and HEK control cells by immunoblot (n=3) and by flow cytometry (n=3). (d) HEK-GFP cells have similar ATP-linked oxygen consumption to untransduced HEK control cells by Seahorse; n=10. (e) HEK-cTnI cells have similar protein levels of representative subunits of complexes I, II, IV and V of the electron transport chain; n=3. (f) Left: HEK-GFP cells have similar mitochondrial membrane potential to untransduced HEK control cells; n=8. Right: Representative figure of HEK, HEK-GFP and HEK-cTnI TMRM fluorescence by flow cytometry. (g) representative figure of HEK and HEK-cTnI MitoTracker Green fluorescence by flow cytometry.
Extended Data Figure 2.
cTnI associates with ATP synthase complex. (a) cTnI co-purifies with immune-captured ATP synthase complex by ELISA from rat heart mitochondria. Rat brain mitochondria used as “cTnI-free” negative control; n=3. (b) ATP synthase subunit d co-purifies with immunoprecipitated cTnI from rat heart mitochondria exposed to normoxia (Nor) and ischemia/reperfusion (IR). Experiment repeated three independent times. (c) Blue-Native polyacrylamide gel electrophoresis (BN-PAGE) (with 0, 2, 4, & 5 mg digitonin/mg protein from left to right) of mouse heart mitochondria shows co-localization of cTnI and ATP synthase subunit d in the ATP synthase complex. Experiment repeated three independent times.
Figure 1.
Figure 1.
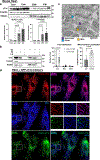
cTnI localizes to mitochondria. (a) Total, cytosolic, subsarcolemmal mitochondria (SSM)- and interfibrillar mitochondria (IFM)-enriched protein fractions were isolated from mouse hearts, and western blot was used to determine the presence of cTnI. VDAC1 was used as mitochondrial protein control and b-actin was used as a cytosolic protein control; n=3. (b) Proteinase K (PK) digestion of mitochondria and mitoplasts, generated with osmotic shock (OS), in the presence or absence of Triton-X (T-X). Experiment repeat three independent times. (c) Top: Immunogold-labeled electron micrograph of mouse heart with antibody against cTnI. Bottom: Quantification of immunogold foci localization to sarcomeric (Sarc), mitochondria (Mito) and other sites (left histogram) and the specificity of the immunogold staining in the mitochondria presented as a percentage of mitochondrial/non-sarcomeric localization; ~2X higher localization of anti-cTnI antibodies relative to control IgG (right histogram); n=9. Left: Two-way ANOVA with Sidak correction for multiple comparisons. Right: unpaired two-tailed t-test. (d) H9c2 rat cardiac myoblasts were transfected with a single cTnI construct possessing both N-terminal GFP and C-terminal mCherry tags. Images were taken for mCherry (red) on the C-terminus (top left), GFP on the N-terminus (bottom left), and mitochondria stained with Mitotracker (pseudo-color blue, middle left). Co-localization of C-terminal cTnI with mitochondria is observed (top right), but no co-localization of N-terminal cTnI is seen (bottom right), with a magnified view (middle right). Experiment repeated three independent times. All data are presented as mean +/− SD.
Figure 2.
Figure 2.
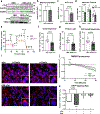
Expression of cTnI in HEK293T cells inhibits mitochondrial function. (a) HEK293T cells were engineered to stably express cTnI and compared to unmodified HEK293T cells (top). Mitochondria-enriched fraction shows association of cTnI with the mitochondrial fraction (bottom). Experiment repeated four independent times. (b) HEK cells expressing cTnI (HEK-cTnI) cells have unchanged mitochondrial mass as determined by MitoTracker Green flow cytometry (n=6), two-tailed t-test. (c) HEK-cTnI have decreased basal ATP levels as seen in a luciferase assay (n=3), two-tailed t-test. (d) HEK-cTnI cells have decreased mitochondrial membrane potential by TMRM fluorescence using flow cytometry (n=7), two-way ANOVA. HEK-cTnI cells have decreased mitochondrial oxygen consumption. (e) Representative Seahorse experiment with serial injection of oligomycin (Oligo), 2,4-dinitrophenol (DNP), antimycin and rotenone (Rot+AA) normalized per microgram of protein. Quantifications for basal respiration (f), proton leak (g), and ATP-linked respiration (h) normalized to microgram of protein; n=3, two-tailed t-test. HEK-cTnI cells have increased rate of mPTP opening as measured by rate of loss of TMRM signal after addition of 500μM H2O2. Cyclosporine A (CsA; 1μM), an inhibitor of mPTP opening, was used as control; n=3–4. (i) Representative image showing TMRM fluorescence 10 minutes and 30 minutes after addition of H2O2. Scale bar = 20μm. (j) Representative experiment showing a higher slope of loss of TMRM signal in HEK-cTnI cells relative to HEK controls; n=4. (k) Quantification of the relative change in TMRM fluorescence as measured as the slope between 10-minute and 30 minute time points. All data are presented as mean +/− SD.
Figure 3.
Figure 3.
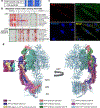
cTnI binds mitochondrial F1FO-ATP synthase. (a) Sequence homology predicted a possible inducible interaction between cTnI and ATP synthase based on the presence of a 10 amino acid stretch in subunit d, showing 80% similarity. (b) cTnI aa43–52 and ATP synthase subunit d aa2–11 are highly conserved in mammals. Portion of protein sequence shown. Red shading indicates frequency-based difference at each amino acid residue. Green box shows sequence of similarity between cTnI and ATP synthase subunit d. Analysis by constraint-based Multiple Alignment Tool (COBALT) plotted on NCBI Multiple Sequence Alignment Viewer. (c) A proximity ligation assay in H9c2 myoblasts reveals an interaction between cTnI and ATP synthase subunit d as strong punctuate signals (red foci) were observed and overlapped with mitochondria labeled with Mitotracker Deep Red (pseudocolored green). Scale bar = 20μm. Experiment repeated three independent times. (d) Best model for the molecular docking of cTnI in ATP synthase complex is shown. cTnI is shown as red surface and the proteins in ATP synthase complex interacting with cTnI (within 4.5Å distance) are shown as colored surfaces (ATP synthase subunit d in blue, ATP synthase subunit α in cyan, ATP synthase peripheral stalk-embrane subunit b in pink, ATP synthase-coupling factor 6 in green, ATP synthase subunit f in purple and ATP synthase protein 8 in gray). All other proteins in ATP synthase complex are shown as light blue ribbons. Box on the left is detailed scope showing the relative positions of short homology stretch in cTnI and ATP synthase subunit d in the model, corresponding to peptide P888 sequence (yellow); though these regions appear to be in close proximity in the model, these regions interact very weakly and don’t contribute significantly to the overall interaction of cTnI and ATP synthase.
Figure 4.
Figure 4.
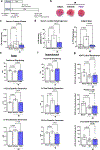
P888 modulates cTnI-ATP synthase binding and ATPase activity in vitro. (a) cTnI demonstrates a dose-dependent binding to ATP synthase by ELISA; binding is inhibited in the presence of P888 (2μM); n=3. (b) ATPase activity increases in the presence of cTnI, and P888 co-incubation prevents this effect; n=3 independent experiments conducted in 3–4 replicates each, two-way ANOVA with Sidak correction. (c) Dose-dependent inhibition by P888 of cTnI’s (2μg) effect on ATPase activity, with IC50 0.55μM: n=6 independent experiments. (d) Schematic of cTnI (top; white) with mutations at R21C, R141Q, S166F, and ΔK177 and the phospho-mimetic substitution S42/44D, IR-induced C-terminal truncated fragment of cTnI (middle; light blue), and N-terminal truncation in ssTnI (bottom; dark blue). (e) C-terminal truncation of cTnI (cTnI1–193) binds ATP synthase similar to wild-type cTnI, as does cTnI-ΔK177, whereas ssTnI, and hypertrophic cardiomyopathy variants (cTnI-R21C, cTnI-R141Q, and cTnI-S166F) do not; n=6. cTnI-S42/44D (mimetic of phosphorylated cTnI) exhibits greater maximal binding to ATP synthase than unphosphorylated cTnI. Two-way ANOVA with Sidak correction. #: p<0.001 vs cTnI 1–210. (f) C-terminal truncated cTnI (cTnI 1–193) increases ATPase activity similar to full recombinant cTnI, whereas ssTnI does not. Hypertrophic cardiomyopathy variants in cTnI differentially impact ATPase activity; n=3 independent experiments. Two-way ANOVA with Sidak correction. (g) cTnI binding to ATP synthase correlates with ATPase activity (R2=0.9); n=6. (h) Phosphomimetic cTnI-S42/44D exhibits greater binding affinity and maximal binding to ATP synthase when compared to unphosphorylated cTnI; n=4. (i) Schematic of experimental procedure: Mitochondria were isolated from mouse heart and brain and co-incubated with cTnI (4μg mitochondria:1μg cTnI), and oxygen consumption and ATP synthesis rates were measured. (j) Co-incubation of mitochondria isolated from mouse heart or brain decreases the rate of maximal ATP synthesis by luciferase assay. n=3 with 3–4 replicates each, two-tailed t-test. (k) Co-incubation of isolated mitochondria with cTnI decreases ADP-linked (state III) oxygen consumption rate in brain and heart; n=3, two-tailed t-test. Panels (d) and (i) were created with BioRender.com. All data are presented as mean +/− SD.
Figure 5.
Figure 5.
P888 treatment prevents IR-induced injury in vivo in rats. (a) Time course of in vivo myocardial IR in the presence of vehicle (TAT) or TAT-P888 treatment. (b) TAT-P888 attenuates IR-induced infarct size as measured by TTC staining, n=5 animals per group. (c) Serum creatine kinase (CK) at 1 day after IR, n=15 animals per group, two-way ANOVA with Sidak correction. (d) TAT-P888 attenuates serum lactate dehydrogenase (LDH) increase at 3 days after IR compared to vehicle, n=15 animals per group, two-way ANOVA with Sidak correction. Basal (e) and isoproterenol (f) echocardiography 3 days after IR demonstrated a decrease in systolic function, as measured by fractional shortening and an increase in LV end-systolic dimension, in vehicle-treated animals. The decrease in fractional shortening and increase in LV end-systolic dimension were prevented by treatment at time of reperfusion with TAT-P888. Non-significant trends in LV end-diastolic dimension are also shown, n=5 animals per group, two-way ANOVA with Sidak correction. (g) Mitochondrial oxygen consumption at 1 day after IR measured by Seahorse, n=15 animals per group, two-way ANOVA with Sidak correction. Panel (a) created with BioRender.com. All data are presented as mean +/− SD.
Figure 6.
Figure 6.
cTnI localizes to mitochondria, where it binds ATP synthase (peripheral stalk shown in red), decreases mitochondrial respiration and membrane potential, increases opening of the mitochondrial permeability transition pore (mPTP) in the inner mitochondrial membrane after reactive oxygen species (ROS) exposure, and increases IR injury. The peptide P888 prevents binding of cTnI to ATP synthase and decreases IR injury. Figure 6 was created with BioRender.com.

References

    1. Kolwicz SC, Purohit S & Tian R Cardiac Metabolism and its Interactions With Contraction, Growth, and Survival of Cardiomyocytes. Circ. Res 113, 603–616 (2013). - PMC - PubMed
    1. Gibbs CL Cardiac energetics. Physiol. Rev 58, 174–254 (1978). - PubMed
    1. Suga H Ventricular energetics. Physiol. Rev 70, 247–277 (1990). - PubMed
    1. Opie LH Heart Physiology: From Cell to Circulation. (Lippincott Williams & Wilkins, 2004).
    1. Katrukha IA Human cardiac troponin complex. Structure and functions. Biochem. Biokhimiia 78, 1447–1465 (2013). - PubMed

Substances

LinkOut - more resources