. 2024 Aug;3(8):1003-1016.
doi: 10.1038/s44161-024-00505-0. Epub 2024 Jul 23.

Aficamten is a small-molecule cardiac myosin inhibitor designed to treat hypertrophic cardiomyopathy

Affiliations

Aficamten is a small-molecule cardiac myosin inhibitor designed to treat hypertrophic cardiomyopathy

James J Hartman et al. Nat Cardiovasc Res. 2024 Aug.

Abstract

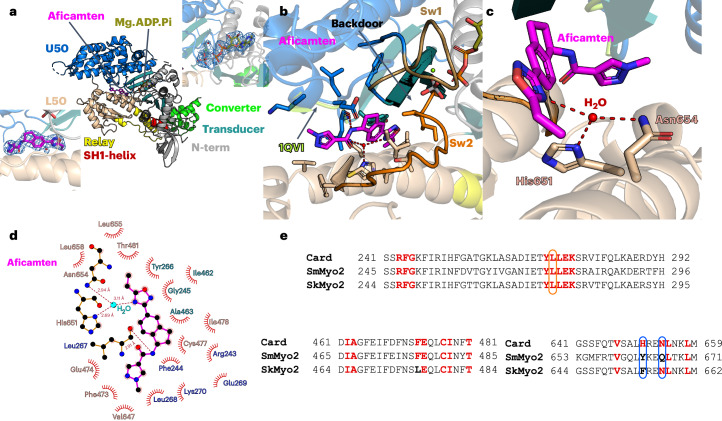
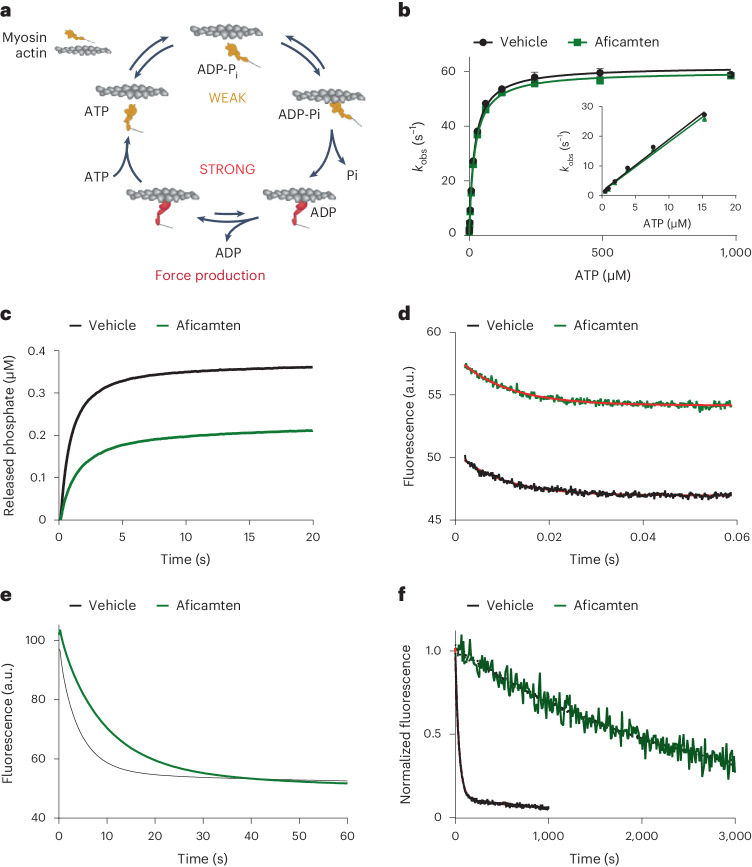
Hypertrophic cardiomyopathy (HCM) is an inherited disease of the sarcomere resulting in excessive cardiac contractility. The first-in-class cardiac myosin inhibitor, mavacamten, improves symptoms in obstructive HCM. Here we present aficamten, a selective small-molecule inhibitor of cardiac myosin that diminishes ATPase activity by strongly slowing phosphate release, stabilizing a weak actin-binding state. Binding to an allosteric site on the myosin catalytic domain distinct from mavacamten, aficamten prevents the conformational changes necessary to enter the strongly actin-bound force-generating state. In doing so, aficamten reduces the number of functional myosin heads driving sarcomere shortening. The crystal structure of aficamten bound to cardiac myosin in the pre-powerstroke state provides a basis for understanding its selectivity over smooth and fast skeletal muscle. Furthermore, in cardiac myocytes and in mice bearing the hypertrophic R403Q cardiac myosin mutation, aficamten reduces cardiac contractility. Our findings suggest aficamten holds promise as a therapy for HCM.


Conflict of interest statement

J.J.H., D.T.H., C.C., E.R.C., S.E., K.H.L., R.M., P.P., S.S.S., J.S., K.D.T., J.W., E.W., Y.W., B.P.M. and F.I.M. are, or have been, employees of and potential stockholders of Cytokinetics. All other authors declare no competing interests.

Figures

Fig. 1
Fig. 1. Aficamten is a selective small-molecule cardiac myosin inhibitor.
a, The chemical structures of the initial screening hit (CK-2172010) and aficamten. b, Inhibition of bovine cardiac myofibril ATPase activity by aficamten. Aficamten concentrations are indicated on the graph and data. Data shown are mean ± s.d. (n = 4) and were fit with a four-parameter model, equation (1). pCa = −log([free Ca2+]) control ATPase activity = 0.26 µM s−1. c, Selective inhibition of bovine cardiac and slow skeletal versus rabbit fast skeletal myofibril ATPase activity by aficamten. Myofibrils were tested at a calcium concentration producing 75% of maximal activation (pCa75). Non-myosin ATPase activity was subtracted from cardiac and slow skeletal myofibril data by subtracting the ATPase activity in the presence of a saturating concentration of blebbistatin. Data shown are mean ± s.d. (cardiac n = 17; slow skeletal n = 6; fast skeletal n = 6) and were fit with a four-parameter model, equation (1). Average control ATPase activities: 0.043 µM s−1 (cardiac), 0.055 µM s−1 (slow skeletal), 0.17 µM s−1 (fast skeletal). d, Inhibition of bovine cardiac myosin S1 (1 µM) basal ATPase activity by aficamten. Data shown are mean values ± s.d. (n = 8) and were fit with a four-parameter model. Control ATPase activity = 0.029 µM s−1. e, Selective inhibition of the actin-activated (14 µM) ATPase activity of bovine cardiac myosin S1 (0.2 µM) versus chicken gizzard SMM S1 (1 µM) by aficamten. Data shown are mean values ± s.d. (n = 4) and were fit with a four-parameter model, equation (1). Control ATPase activities: 0.29 µM s−1 (cardiac), 0.47 µM s−1 (smooth). f, Inhibition of skinned rat cardiac fiber isometric force production by aficamten. Data shown are mean values ± s.e.m. (vehicle, n = 6; 1 µM, n = 4, 10 µM, n = 3 unique skinned cardiac fibers). P values shown were corrected for multiple comparison using the Holm–Sidak method (α = 0.05). g, Aficamten, but not mavacamten, reduces myosin-enhanced blebbistatin fluorescence intensity consistent with mutually exclusive binding. Data shown are mean values ± s.d. (n = 4 technical replicates) and were fit with a four-parameter model, equation (1). Source data
Fig. 2
Fig. 2. Structure of β-cardiac myosin motor domain complexed to aficamten and Mg.ADP.Vanadate in the PPS state.
a, Overall structure with the different subdomains colored distinctly. Two insets show that both the nucleotide and the drug were rebuilt without ambiguity in the density: the upper inset displays ADP and Vanadate and the lower inset displays aficamten. In both the 2Fo-Fc electron density map is contoured at 1.0 σ of the nucleotide and the drug is shown, demonstrating that these elements have been built without ambiguity. The subdomains are colored distinctly. N-term, N-terminal subdomain. b, Aficamten targets the same pocket as blebbistatin. The side chains of the residues involved in the binding are shown as sticks. c, Zoom in on the coordination of the water involved in the binding of aficamten. The connectors switch-1 (Sw1) and switch-2 (Sw2) are colored distinctly. d, Scheme of the aficamten binding site drawn with LigPlot. e, Sequence alignment of different Homosapiens class-2 myosin heavy chains: β-cardiac myosin (Card), SMM 2 (SmMyo2), skeletal myosin 2 (SkMyo2). Positions of the residues involved in the binding of aficamten are represented in bold. If the residue is conserved, it is colored red. Non-conserved positions are colored black. Residues involved in a polar interaction are contoured in orange. Residues involved in the coordination of water are contoured in blue.
Fig. 3
Fig. 3. Mechanism of cardiac myosin inhibition by aficamten.
a, Myosin mechanochemical cycle. b, ATP binding and hydrolysis are unaffected by aficamten. Bovine cardiac myosin S1 (1 µM final concentration) was rapidly mixed with varying concentrations of ATP while monitoring myosin intrinsic tryptophan fluorescence. Aficamten was included in all solutions at 40 µM. Three to five fluorescence transients were averaged and fit to a single exponential equation (2). Data shown are mean ± s.d. (n = 3 separate experiments). Vehicle, k+H + k−H = 62 s−1, ATP binding rate = 1.7 × 106 M−1 s−1; aficamten, k+H + k−H = 60 s−1, ATP binding rate 1.7 × 106 M−1 s−1. c, Actin-activated phosphate release is slowed by aficamten. Bovine cardiac myosin S1 was rapidly mixed with ATP, aged and then rapidly mixed with actin and MDCC–PBP. Final concentrations were 0.5 µM myosin, 0.25 µM ATP, 14 µM actin and 5 µM MDCC–PBP. Aficamten was included in all solutions at 40 µM. Data shown are the average of four to six transients from a representative experiment, which was well fit to a double exponential equation (3), superimposable with the data. Aggregated data are shown in Extended Data Fig. 4 and Supplementary Table 3. d, Actin-activated ADP release is very modestly slowed by aficamten. Bovine cardiac myosin S1 was preincubated with mant-ADP and actin followed by rapid mixing with excess ATP. Final concentrations were 1 µM myosin, 0.5 µM mant-ADP, 5 µM actin and 1 mM ATP. Aficamten was included in all solutions at 40 µM. Data shown are from a single representative reaction. The red line indicates the best fit to a single exponential equation (2). Aggregated data are shown in Extended Data Fig. 5. e, Basal ADP release is modestly slowed by aficamten. Bovine cardiac myosin S1 was preincubated with mant-ADP followed by rapid mixing with excess ATP. Final concentrations were 1 µM myosin, 0.5 µM mant-ADP and 1 mM ATP. Aficamten was included in all solutions at 40 µM. Data shown are the average of four to six transients from a representative experiment, which was well fit to a single exponential equation (1), superimposable with the data. Aggregated data are shown in Extended Data Fig. 6. f, Aficamten dramatically slows single ATP turnover. Bovine cardiac myosin S1 was preincubated with mant-ATP followed by rapid mixing with excess ATP. Final concentrations were 0.5 µM myosin, 1.0 µM mant-ATP and 1 mM ATP. Aficamten was included in all solutions at 25 µM. Data shown are from a single representative reaction. The red line indicates the best fit to a double exponential equation (3) for vehicle and a single exponential equation (2) for aficamten. Aggregated data are shown in Table 2. PBP, phosphate binding protein; MDCC, 7-diethylamino-3-((((2-maleimidyl)ethyl)amino)carbonyl) coumarin. Source data
Fig. 4
Fig. 4. Aficamten reduces cardiac contractility in vitro and in vivo.
a, Aficamten (10 μM) reduces myocyte contractility without altering calcium transients. Data shown are for a single representative cell. The top graph represents myocyte contractility and bottom graph represents calcium transients (intracellular free Ca2+ measured using the radiometric indicator Fura2, where the Fura ratio = fluorescence emission at λem  510 nm when excited at λex340/380 nm, which is proportional to the free [Ca2+]). Aggregated data are shown in Table 3. b, Aficamten reduces the contractility (fractional shortening, FS) of adult rat cardiomyocytes at concentrations similar to those that inhibit myosin ATPase activity. Data shown are mean ± s.e.m. (n = 10–13 cardiomyocytes for each concentration prepared from n > 3 preparations). c, Aficamten reduces FS of healthy rats. Echocardiographic measurements of FS before (baseline, BL) and 1, 4, 8 and 24 h after single oral doses (PO) of aficamten in healthy rats. FS is shown as a percent of baseline values. Data are shown as mean ± s.e.m. (vehicle, n = 10; 2 mg kg−1; aficamten, n = 4; 0.5, 1 and 4 mg kg−1 aficamten, n = 4 per group). d, FS reduction in normal rats as a function of total plasma aficamten concentration. Rat FS concentration response curve was generated by plotting the average plasma concentration and the average FS response at each time point in the four sets of animals dosed at 0.5, 1, 2 and 4 mg kg−1 (n = 16 total data points). Values shown are mean ± s.e.m. e, Echocardiographic measurements of ejection fraction before (BL) and 2, 6, 24 and 48 h after single oral doses of aficamten in beagle dogs. LVEF is shown as a percent of baseline values. Data are shown as mean ± s.e.m. (n = 8 per dose group). f, Dog LVEF concentration response curve was generated by plotting the average total plasma concentration and the average LVEF response at each time point in dogs dosed at 0.75, 2 and 3 mg kg−1 (n = 8 per dose). Values shown are mean ± s.e.m. g, Echocardiographic measurements of FS before (BL) and 1, 4, 8 and 24 h after single oral doses of aficamten in WT and R403Q mice. FS is shown as a percent of baseline values. Data are shown as mean ± s.e.m. (0.25 mg kg−1, n = 7 per group; 0.5, 1 and 1.25 mg kg−1, n = 4 per group; 1.5 mg kg−1, n = 2 per group). h, WT and R403Q mouse concentration response curves were generated by plotting the average total plasma concentration and the average FS response at each time point at doses ranging from 0.25–1.5 mg kg−1 (WT, 15 data points; R403Q, 14 data points). Values shown are mean ± s.e.m. Source data
Extended Data Fig. 1
Extended Data Fig. 1. Effect of actin concentration on inhibition by myosin inhibitors.
Inhibition of the actin-activated ATPase activity of bovine cardiac myosin S1 (0.2 µM) by (A) aficamten, (B) mavacamten, and (C) blebbistatin. Data shown are mean values ± SD (n = 4 technical replicates). Data are fit with four-parameter dose–response curves (1) with top values fixed at 1. Control ATPase activities: 0.115 µM/sec (5 µM actin), 0.258 µM/sec (15 µM actin), 0.443 µM/sec (45 µM actin). Results of curve fitting are shown in Table S1. Source data
Extended Data Fig. 2
Extended Data Fig. 2. Fluorescence emission spectra of blebbistatin.
Fluorescence emission intensity of (-)-blebbistatin (5 µM) increases upon binding to bovine cardiac myosin S1 (1 µM) in the ADP-VO4 state. This increase is attenuated in the presence of excess aficamten (50 µM). Samples were excited at 426 nm. Source data
Extended Data Fig. 3
Extended Data Fig. 3. Detail of the Electrostatic Bond Involving the Carboxyl Group of a Conserved Leucine.
(A) L267 from β-cardiac myosin interacts with the N-H from aficamten. (B) L262 from D. discoidum Myosin II interacts with the hydroxyl group of blebbistatin (PDB code 1YV3, ref. ). (C) The same kind of interaction occurs between L270 from skeletal myosin II and the hydroxyl of MPH-220 (PDB code 6YSY, ref. ).
Extended Data Fig. 4
Extended Data Fig. 4. Effect of aficamten, blebbistatin, and mavacamten on actin-activated phosphate release.
Bovine cardiac myosin S1 was rapidly mixed with ATP, aged, and then rapidly mixed with actin and MDCC-PBP. Final concentrations after mixing: 0.5 µM myosin, 0.25 µM ATP, 14 µM actin, 5 µM MDCC-PBP. Aficamten, blebbistatin, or mavacamten were included in all solutions at 40 µM. (A) Phosphate release rate and amplitude as a function of age time in the presence of aficamten. (B) Phosphate release rate and amplitude as a function of age time in the presence of mavacamten or blebbistatin. (C) Representative phosphate release reaction with 2 second age time. (D) Representative phosphate release reaction with 30 second age time. Data were best fit to the sum of two exponentials (3), with the exception of reactions containing mavacamten which were well fit with a single exponential (2), due to small amounts of ATP present in the actin solutions. Note that the amplitude of the fast rate of Pi release declines at longer age times under control conditions, due to loss of phosphate during the ageing period prior to mixing with actin. Data shown is the average of four to six transients from a representative experiment. (n = 5 technical replicates) Aggregated data are shown in Table S3, S4. Source data
Extended Data Fig. 5
Extended Data Fig. 5. Rate of actin-activated mantADP release from bovine cardiac myosin S1 (1 µM) in the absence and presence of 40 µM aficamten.
Data shown are mean +/- SD (n = 16 technical replicates from n = 4 samples). Source data
Extended Data Fig. 6
Extended Data Fig. 6. Rate of basal mantADP release from bovine cardiac myosin S1 (1 µM) in the absence and presence of 40 µM aficamten.
Data shown are mean +/- SD (N = 12 technical replicates from n = 3 samples). Source data
Extended Data Fig. 7
Extended Data Fig. 7. Time course of single nucleotide turnover by bovine cardiac HMM (0.5 µM) in the absence (black) and presence (green) of 25 µM aficamten.
Single representative experiment is shown. The fitted lines represent the best fit to a double exponential (3) for vehicle and single exponential (2) for aficamten. Pooled data is shown in Table S5. Source data
Extended Data Fig. 8
Extended Data Fig. 8. Inhibition of the rate of actin filament sliding by aficamten.
Results shown are mean +/- SD (n=ten filaments from a single myosin prep) under each condition. All reactions contained 2% DMSO. Movies of actin filament sliding included as Supplementary Videos 1-4. Source data
Extended Data Fig. 9
Extended Data Fig. 9. Effect of Aficamten (10 µM) on Simultaneous Fractional Shortening (A) and Calcium Transient Measurements (B–D) in Adult Rat Ventricular Cardiomyocytes.
Results from individual cardiomyocytes are shown (n = 30 cells from n = 8 preparations). Tabulated data is shown in Table 3. Source data

References

    1. Maron, B. J. et al. Prevalence of hypertrophic cardiomyopathy in a general population of young adults: echocardiographic analysis of 4111 subjects in the CARDIA study. Circulation92, 785–789 (1995). 10.1161/01.CIR.92.4.785 - DOI - PubMed
    1. Semsarian, C., Ingles, J., Maron, M. S. & Maron, B. J. New perspectives on the prevalence of hypertrophic cardiomyopathy. J. Am. College Cardiol.65, 1249–1254 (2015). 10.1016/j.jacc.2015.01.019 - DOI - PubMed
    1. Maron, M. S. et al. Contemporary natural history and management of nonobstructive hypertrophic cardiomyopathy. J. Am. College Card.67, 1399–1409 (2016). 10.1016/j.jacc.2016.01.023 - DOI - PubMed
    1. Husser, D. et al. Prevalence of clinically apparent hypertrophic cardiomyopathy in Germany: an analysis of over 5 million patients. PLoS ONE13, e0196612 (2018). 10.1371/journal.pone.0196612 - DOI - PMC - PubMed
    1. Magnusson, P., Palm, A., Branden, E. & Mörner, S. Misclassification of hypertrophic cardiomyopathy: validation of diagnostic codes. Clin. Epidemiol.9, 403–410 (2017). 10.2147/CLEP.S139300 - DOI - PMC - PubMed

MeSH terms