. 2023 Sep;2(9):819-834.
doi: 10.1038/s44161-023-00322-x. Epub 2023 Sep 4.

Cell-intrinsic effects of clonal hematopoiesis in heart failure

Affiliations

Cell-intrinsic effects of clonal hematopoiesis in heart failure

Wesley T Abplanalp et al. Nat Cardiovasc Res. 2023 Sep.

Abstract

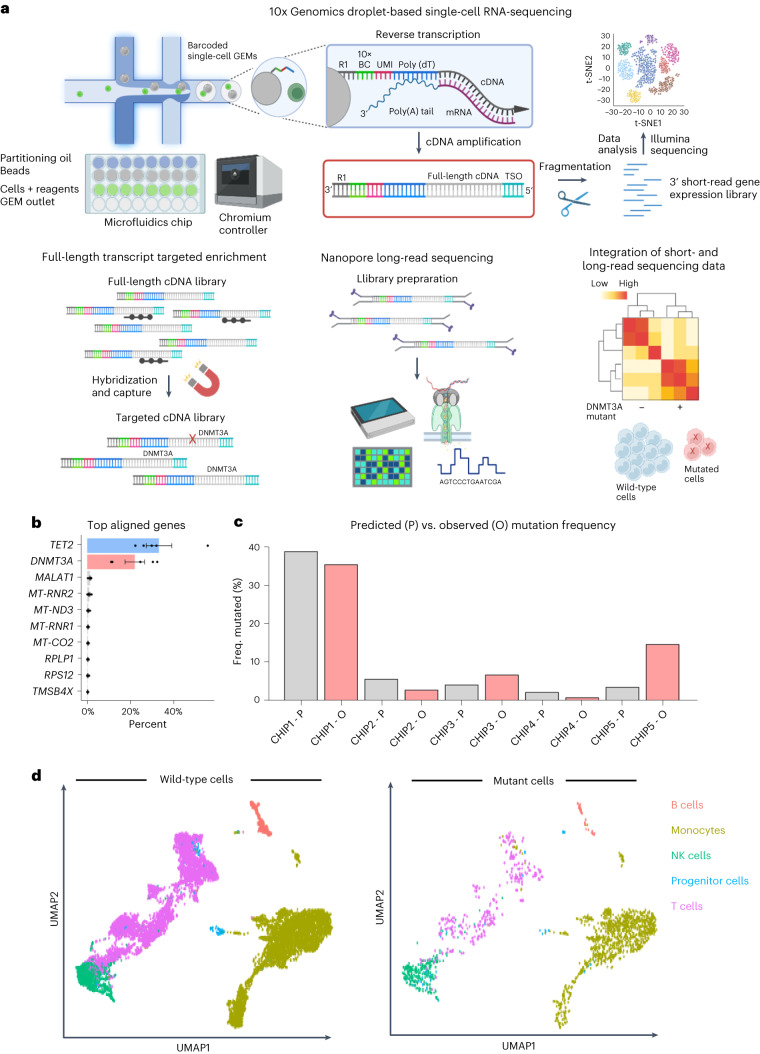
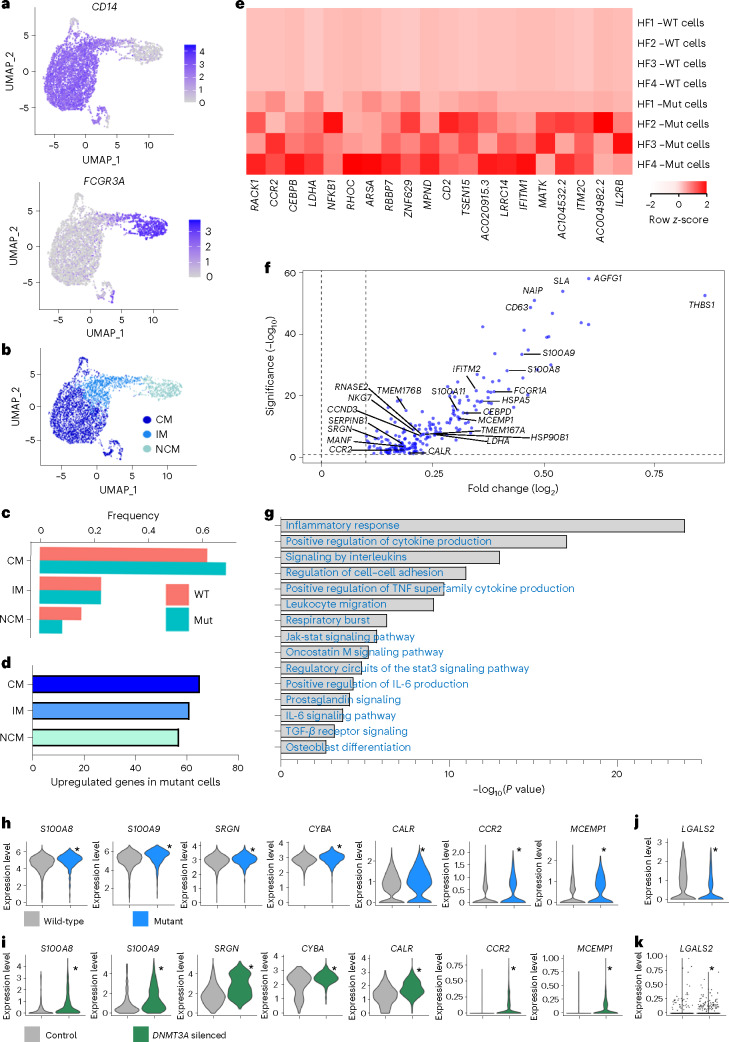
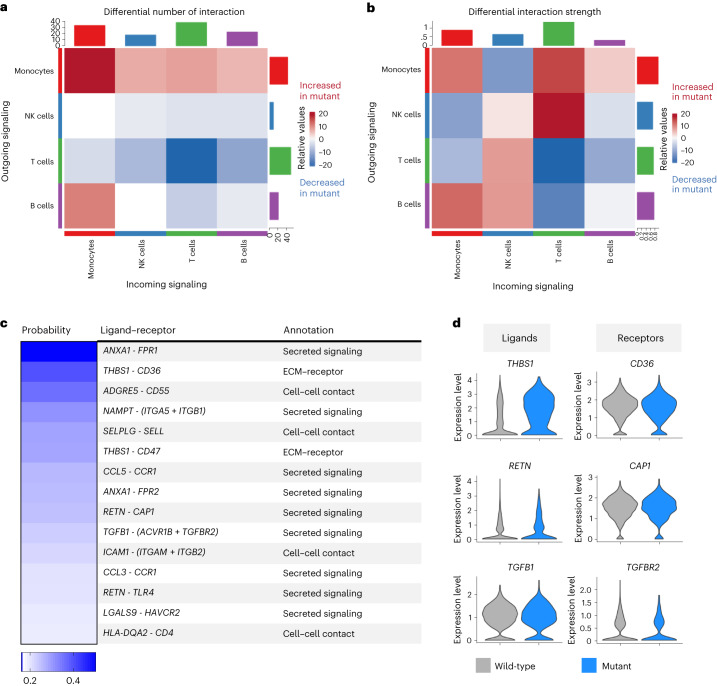
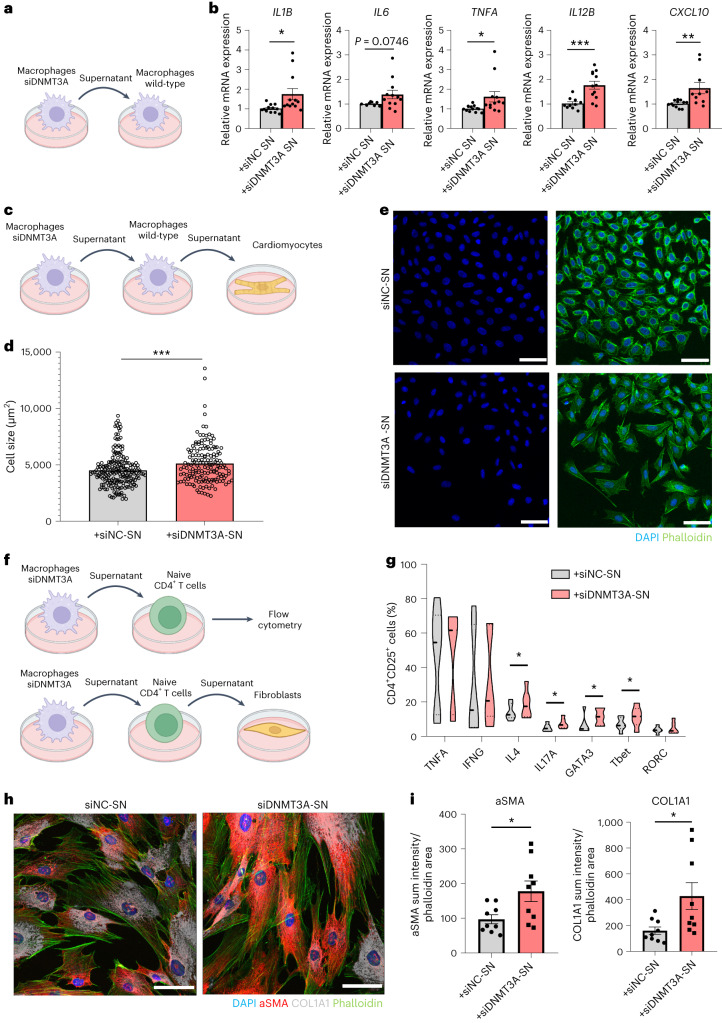
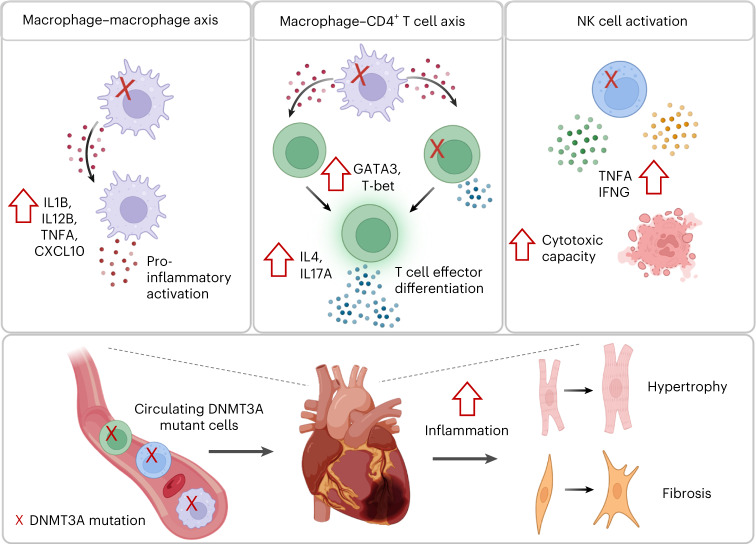
Clonal hematopoiesis of indeterminate potential (CHIP) is caused by somatic mutations in hematopoietic stem cells and associates with worse prognosis in patients with heart failure. Patients harboring CHIP mutations show enhanced inflammation. However, whether these signatures are derived from the relatively low number of cells harboring mutations or are indicators of systemic pro-inflammatory activation that is associated with CHIP is unclear. Here we assess the cell-intrinsic effects of CHIP mutant cells in patients with heart failure. Using an improved single-cell sequencing pipeline (MutDetect-Seq), we show that DNMT3A mutant monocytes, CD4+ T cells and NK cells exhibit altered gene expression profiles. While monocytes showed increased genes associated with inflammation and phagocytosis, T cells and NK cells present increased activation signatures and effector functions. Increased paracrine signaling pathways are predicted and validated between mutant and wild-type monocytes and T cells, which amplify inflammatory circuits. Altogether, these data provide novel insights into how CHIP might promote a worse prognosis in patients with heart failure.


Conflict of interest statement

A.M.Z. is an unpaid consultant for TenSixteen Bio. All remaining authors declare no competing interests.

Figures

Fig. 1
Fig. 1. Single-cell targeted long-read sequencing to detect CH somatic mutations in individual cells.
a, The workflow for targeted long-read sequencing with single-cell resolution is composed of three methodological techniques and bioinformatic data analysis. During scRNA-seq, single cells are partitioned in barcoded gel beads-in-emulsion (GEMs) in which reverse transcription takes place. The first-strand cDNA is purified and amplified, producing the full-length cDNA library. For single-cell 3′ gene expression profiling, a fraction of the cDNA library is fragmented and processed for Illumina short-read sequencing. Additionally, the full-length cDNA library undergoes targeted enrichment by hybridization and capture, followed by Nanopore long-read sequencing. Bioinformatic integration of short-read and long-read sequencing data identifies mutations in targeted transcripts that are linked to gene expression profiles of individual cells. b, Exome alignment of long-read sequencing data with top aligned genes and relative on-target percentages (n = 5 patients). c, Frequency of mutated cells by predicted prior targeted DNA sequencing of DNMT3A versus observed mutation frequency in single-cell sequencing analysis. d, UMAP of annotated wild-type and mutated single cells with coverage at relative mutation sites. Data show means of each processed library ± s.e.m. (b). t-SNE, t-distributed stochastic neighbor embedding.
Fig. 2
Fig. 2. DNMT3A mutant monocytes show a pronounced pro-inflammatory phenotype.
a,b, Relative expression of CD14 and FCGR3A (a) for identification of monocyte subclasses (shown in b). c, Distribution of mutated cells compared to wild-type cells by class. d, Number of upregulated genes in DNMT3A mutant cells versus wild-type cells in different monocyte classes in pooled analysis (downsampled for comparative analysis to NCM cell count, n = 1,006 cells per group). e, Paired analysis of upregulated genes in mutated versus wild-type cells from monocytes in heat map. f,g, Upregulated genes in mutant versus wild-type CMs by volcano plot with select significantly called GO terms. h,i, Select upregulated genes in mutant monocytes (h) and validated in vitro by scRNA-seq of THP1 macrophages upon DNMT3A silencing (i) (n = 644 siDNMT3A non-reponsive cells, n = 387 siDNMT3A reponsive cells). j,k, Violin plots of downregulated gene LGALS2 in mutant monocytes (j) and validated in vitro in scRNA-seq of THP1 macrophages (k). ad,f,g,h,j: n = 5 for pooled analysis; e: n = 4 when number of CMs per patient n < 5 cells. CM, classical monocyte; IM, intermediate monocyte; Mut, mutant cell; NCM, non-classical monocyte; WT, wild-type cell. a,b: 7,041 monocytes (total): 4,435 CMs, 1,600 IMs and 1,006 NCMs; c: 3,614 WT CMs and 821 mutant CMs; 1,328 WT IMs and 272 mutant IMs; and 906 WT NCMs and 100 mutant NCMs. (Significance was determined for fk by two-sided t-test, with adjusted P < 0.05; in hk, significance is denoted by *).
Fig. 3
Fig. 3. Role of DNMT3A mutations in CD4+ and CD8+ T cells.
a, UMAP of CD4+ T cells with coverage at mutation site locations. b, Violin plot of Il17RA in CD4+ T cell subsets. c, Feature plots showing relative expression of activation markers and T helper subset markers. d, Relative abundance of T cell subsets by mutation status. e, Proportion of CD4+ naive T cells in wild-type and mutant cells by patient. f, Upregulated genes in mutant CD4+ T cells. g, UMAP of CD8+ T cells with coverage at the mutation site. h, Heat map of genes identifying CD8+ T cell subsets. i, Feature plots showing relative expression of activation markers. j, Relative abundance of CD8+ T cell subsets by mutation status. k,l, Genes upregulated (k) and downregulated (l) in CD8+ T cells. ad,f: n = 2258 wild-type cells and n = 125 mutant cells. e: n = 887 wild-type cells and n = 34 mutant cells. gl: n = 3,469 wild-type cells and n = 289 mutant cells. e: P value was determined by two sided t-test. Significance was determined for f,k,l by two-sided t-test, with adjusted P < 0.05, with significance denoted by *. For e: data show means of each patient sample ± s.e.m. CTL, cytotoxic like; Mut, mutant; TCM, T central memory; TEM, T effector memory; WT, wild-type.
Fig. 4
Fig. 4. DNMT3A silencing promotes an effector phenotype of CD4+ T cells and NK cells.
a. DNMT3A expression level after siRNA silencing in CD4+ T cells (n = 6 donors) 3 d after siRNA-mediated silencing, P = 0.0005. b, Experimental procedure to analyze DNMT3A in CD4+ T cells. c, Heat map showing relative induction of activation markers in Th0 and Th1/Th2/Th17-polarized CD4+ T cells after DNMT3A silencing (n = 6 donors) relative to donor-matched siRNA control (siNC) values. d, Mean (geometric) fluorescence intensity (MFI) values of activation markers in DNMT3A-silenced and Th2-polarized CD4+ T cells (n = 6 donors), P = 0.0463 for IL-4. e, Representative flow cytometry plots (top) and histograms (bottom) of IL-4 in DNMT3A-silenced and Th2-polarized CD4+ T cells. f, Scheme of NK cell readouts to address effects of DNMT3A silencing. g, DNMT3A expression level after siRNA silencing in NKL cells (n = 5 biologically independent samples, two independent experiments), P = 0.0232. h, Flow cytometry analysis of CD56, TNFA and IFNG in DNMT3A-silenced NKL cells (n = 6 biologically independent samples, three independent experiments), P = 0.0032, 0.0009 and 0.0029 for CD56, TNFA and IFNG, respectively. i, Representative flow cytometry plots (left) and histograms (right) of TNFA and IFNG in DNMT3A-silenced NKL cells. j, Fold change of 7-ADD+ HUVECs after co-culture with DNMT3A-silenced NKL cells compared to siNC NKL (n = 12 biologically independent samples, four independent experiments), P = 0.0028. Data show means ± s.e.m. (a,g,h) or medians (c,d). Statistical significance was assessed by two-tailed unpaired (a,g,j) or paired (d,h) t-test (*P < 0.05, **P < 0.01, ***P < 0.001). Source data
Fig. 5
Fig. 5. Interactions between immune cells with and without DNMT3A mutations.
a,b, Heat map of outgoing versus incoming communication signal numbers (a) and strengths (b) among different cell types colored by relative interaction of mutant cells (red: increased interaction in mutant cells; blue: decreased interaction in mutant cells). c, Predicted monocyte–monocyte interactions sorted by highest interaction probability showing ligand–receptor pairs from mutant cells, type of signaling and evidence for the annotation. d, Relative expression of ligand and receptor in mutant and wild-type cells, respectively. ECM, extracellular matrix.
Fig. 6
Fig. 6. DNMT3A-silenced macrophages activate wild-type immune cells and cardiac cells by paracrine signaling.
a, Experimental procedure to analyze capacity of DNMT3A-silenced macrophages to activate wild-type macrophages. b, Expression of pro-inflammatory markers in human primary macrophages after indirect co-culture with DNMT3A-silenced macrophages (n = 12 biologically independent samples except for IL6 in siNC, n = 9, for IL12B in siNC and for CXCL10 in siDNMT3A, n = 10, four donors), P = 0.0193, 0.0339, 0.0008 and 0.0077 for IL1B, TNFA, IL12B and CXCL10, respectively. c, Visualization of procedure to analyze indirect activation of cardiomyocytes by DNMT3A-silenced macrophages via wild-type macrophages. d, Immunofluorescence quantification of cardiomyocyte cell size after treatment with supernatant from THP1-derived macrophages indirectly co-cultured with DNMT3A-silenced macrophages (n = 203 and 156 biologically independent cells for siNC and siDNMT3A, four independent experiments), P = 0.0007. e, Representative immunofluorescence analysis of cardiomyocytes stained with DAPI (blue) and phalloidin (green) to quantify hypertrophic effects (scale bar, 50 µm). f, Experimental procedure to analyze capacity of DNMT3A-silenced macrophages to activate wild-type T cells (top) and cardiac fibroblasts (bottom). g, Flow cytometry analysis of naive CD4+ T cells after indirect co-culture with DNMT3A-silenced human macrophages (n = 6 donors), P = 0.0370, 0.0480, 0.0280 and 0.0433 for IL4, IL17, GATA3 and T-bet, respectively. h, Representative immunofluorescence analysis of cardiac fibroblasts after treatment with supernatant from CD4+ T cells indirectly co-cultured with DNMT3A-silenced human macrophages. DAPI (blue), phalloidin (green), collagen type I (gray) and αSMA (red) are stained (scale bar, 50 µm). i, Immunofluorescence quantification of COL1A1 and aSMA in cardiac fibroblasts (n = 9 biologically independent samples, three independent experiments), P = 0.0242 and 0.0255 for αSMA and COL1A1. Data show means ± s.e.m. (b,d,i) or medians (g). Statistical significance was assessed by two-tailed unpaired (b,i) or paired (g) t-test and two-tailed Mann–Whitney test (d) (*P < 0.05, **P < 0.01, ***P < 0.001). Source data
Fig. 7
Fig. 7. Crosstalk between immune cells with and without DNMT3A mutations amplifies inflammation contributing to cardiac dysfunction.
Circulating blood cells are recruited to the heart after myocardial infarction. DNMT3A mutant macrophages promote pro-inflammatory activation of wild-type macrophages (macrophage–macrophage axis) and effector differentiation of CD4+ T cells (macrophage–CD4+ T cell axis). DNMT3A mutant NK cells produce elevated levels of pro-inflammatory cytokines and show increased cytotoxic capacity. Both intrinsic activation of immune cells by DNMT3A mutations and indirect activation of wild-type cells by DNMT3A mutant macrophages promote progression of inflammation causing hypertophy and fibrosis, finally resulting in cardiac dysfunction.
Extended Data Fig. 1
Extended Data Fig. 1. Schematic overview of experimental procedures for single cell targeted long-read sequencing and quality control results.
a. Detailed workflow of 10X Genomics Single Cell 3‘ gene expression protocol combined with targeted enrichment of full-length transcripts by hybridization and capture and Nanopore long-read sequencing. b. Enrichment of targeted transcripts by single and double capture approach (n = 6 patients except for TRAC n = 4) relative to cDNA input. The double capture improves the enrichment of targets by a factor of 10 (from 103- to 104-fold) compared to the single capture and more efficiently depletes non-target transcripts. Initial test experiment of single capture (n = 1 patient) is shown. c. Representative Agilent Bioanalyzer traces of cDNA libraries before and after targeted enrichment. The amplified full-length cDNA and the post-capture targeted cDNA library were analyzed on an Agilent High Sensitivity DNA Chip. The gel (left) and cDNA profiles (right) suggest the presence of an enriched fraction after two rounds of hybridization and capture compared to the input cDNA library. Panel B: error bars ± SD shown.
Extended Data Fig. 2
Extended Data Fig. 2. Alignment of long-reads to CHIP gene and mutation locations.
a. Map of exons and introns for the DNMT3A gene (upper panel). Distribution of reads from long read sequencing along the DNMT3A gene with non-synonymous mutation location indicated by red vertical line (lower panel). b. Validation of detection of somatic mutations in TET2 for a known carrier by MutDetect-seq.
Extended Data Fig. 3
Extended Data Fig. 3. Proportion of cells captured in scRNA-seq and regulated genes.
a. Proportion of reads mapped to target genes in long read sequencing. b. Expression of cell type specific markers shown in Featureplots. c. Relative abundance of cells with coverage at patient-respective DNMT3A-mutation sites. d. Enrichment plot of mutated cells compared to wild type cell with distribution by class (each dot represents an individual sample, with the fill pattern of the dot representing a specific sample across the different cell types). e. Neighborhood distribution analysis by Milo. The Nodes represent the detected neighborhoods by MILO, which are colored by their log fold change between mutated and WT samples. Non-differential abundance neighborhoods (FDR 10%) are colored white, and sizes correspond to the number of cells in a neighborhood. Number of cells shared between adjacent neighborhoods are shown by the graph edges. The node position is set by the position of the neighborhood defining cells in the UMAP representation (left). f/g. Number of upregulated genes in DNMT3A mutant cells versus wild type cells by immune cell class (f) using all cells and (g) when down-sampling to the number of NK cells (that is 1599 cells per cell type). (Panels a-g: n = 5 for relative mutation analysis and pooled differential gene expression analysis. Panel d: data show means of each processed library ± SEM).
Extended Data Fig. 4
Extended Data Fig. 4. Secondary monocyte class confirmation markers for annotation.
a-c. Violin plots of common monocyte subclass maker genes for (a) classical monocytes, (b) intermediate monocytes and (c) non-classical monocytes confirming monocyte annotation. d. Heatmap of unbiased monocyte subclass maker regulated genes. e. Number of upregulated genes in DNMT3A mutant cells versus wild type cells in different monocyte classes in pooled analysis. f. Novel DNMT3A-mutant associated gene regulation differentially are called from parent GO term associated with immune processes and inflammation. (CM: classical monocytes; IM: intermediate monocytes; NCM: non-classical monocytes). (Significance denoted by * and reflects adj. p-value < 0.05).
Extended Data Fig. 5
Extended Data Fig. 5. Regulated genes in DNMT3A mutant monocytes and DNMT3A-silenced THP1 macrophages.
a. Violin plots of significantly upregulated genes in mutant vs. wild type cells in monocytes of patients. b. Violin plots of significantly upregulated genes in responsive DNMT3A silenced THP1 cells. c. Violin plots of significantly downregulated genes in mutant vs. wild type cells in monocytes of patients. (Panels a/c: n = 5 for pooled analysis. Panels b: n = 644 siDNMT3A non-reponsive cells, n = 387 siDNMT3A responsive cells. (Significance denoted by * and reflects adj. p-value < 0.05).
Extended Data Fig. 6
Extended Data Fig. 6. Naive CD4 + T cell isolation and T cell gating strategies.
a. Enrichment of naive CD4 + T (lower panel) cells from PBMCs (upper panel). Naive CD4+ T cells express CD45RA and CCR7. b. Identification of T helper cell markers in CD4 + CD25+ T cells differentiated from naive CD4+ T cells. Arrows indicate sequential gates.
Extended Data Fig. 7
Extended Data Fig. 7. NK cell gating strategies.
a. Detection of CD56, TNFA and IFNG in NKL cells. b. NK cell cytotoxicity assay. CFSE-stained HUVEC lysed by NK cells are identified as CFSE + 7-ADD+ cells. Arrows indicate sequential gates.
Extended Data Fig. 8
Extended Data Fig. 8. Changes in signaling by DNMT3A mutation presence.
a. Interaction strength between wild type and DNMT3A mutant monocytes. Overall interaction strength is shown b. Differentially regulated pathways for DNMT3A mutant vs. WT cells. c. DNMT3A expresssion after DNMT3A silencing in human macrophages (n = 11 biologically independent samples, 4 donors), P = 1,63 × 10−10 (left) and in THP1-derived macrophages (n = 3 independent experiments), P = 9,59 × 10−6 (right). Means ± SEM is shown. Statistical significance was determined by two-tailed unpaired t-test. (**** P < 0.0001). Source data

References

    1. Steensma, D. P. et al. Clonal hematopoiesis of indeterminate potential and its distinction from myelodysplastic syndromes. Blood126, 9–16 (2015). 10.1182/blood-2015-03-631747 - DOI - PMC - PubMed
    1. Nam, A. S. et al. Single-cell multi-omics of human clonal hematopoiesis reveals that DNMT3A R882 mutations perturb early progenitor states through selective hypomethylation. Nat. Genet.54, 1514–1526 (2022). 10.1038/s41588-022-01179-9 - DOI - PMC - PubMed
    1. Jaiswal, S. et al. Age-related clonal hematopoiesis associated with adverse outcomes. N. Engl. J. Med.371, 2488–2498 (2014). 10.1056/NEJMoa1408617 - DOI - PMC - PubMed
    1. Dorsheimer, L. et al. Association of mutations contributing to clonal hematopoiesis with prognosis in chronic ischemic heart failure. JAMA Cardiol.4, 25–33 (2019). 10.1001/jamacardio.2018.3965 - DOI - PMC - PubMed
    1. Pascual-Figal, D. A. et al. Clonal hematopoiesis and risk of progression of heart failure with reduced left ventricular ejection fraction. J. Am. Coll. Cardiol.77, 1747–1759 (2021). 10.1016/j.jacc.2021.02.028 - DOI - PubMed

MeSH terms

Substances