. 2023 Nov;2(11):991-1002.
doi: 10.1038/s44161-023-00348-1. Epub 2023 Oct 26.

Titin governs myocardial passive stiffness with major support from microtubules and actin and the extracellular matrix

Affiliations

Titin governs myocardial passive stiffness with major support from microtubules and actin and the extracellular matrix

Christine M Loescher et al. Nat Cardiovasc Res. 2023 Nov.

Abstract

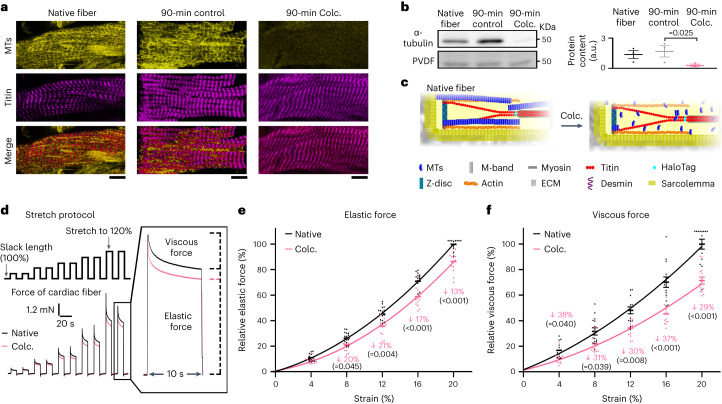
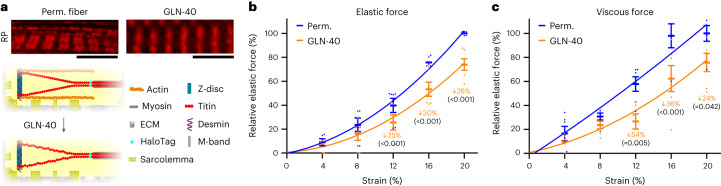
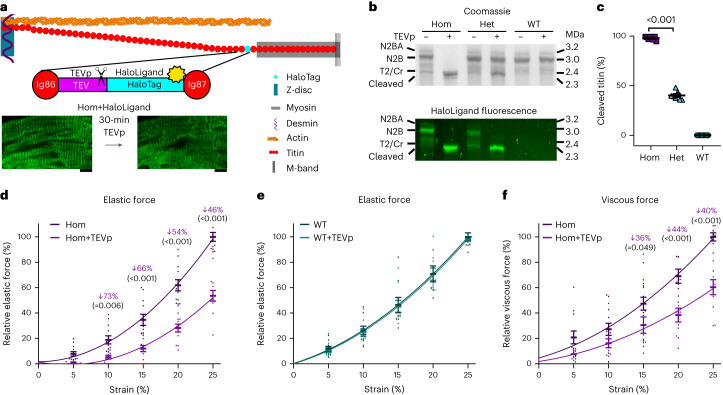
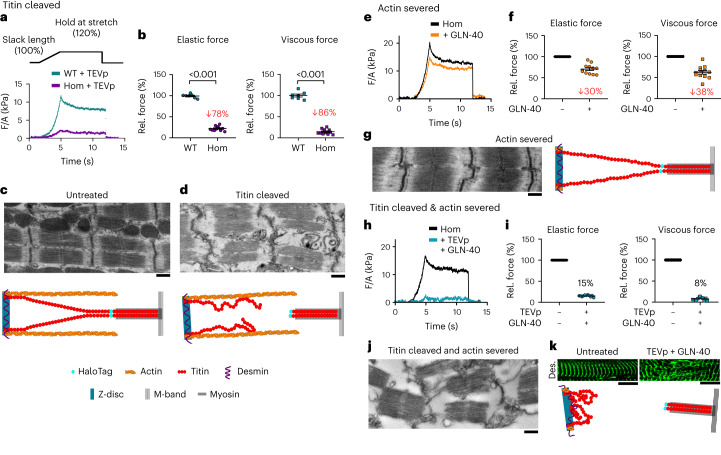
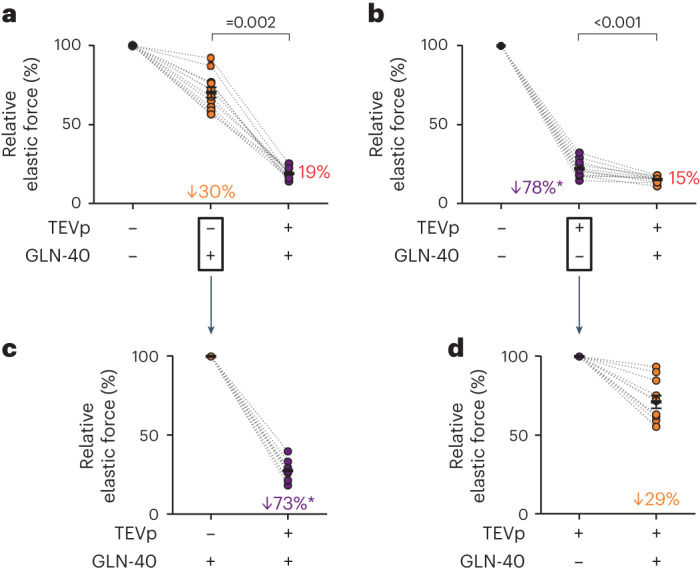
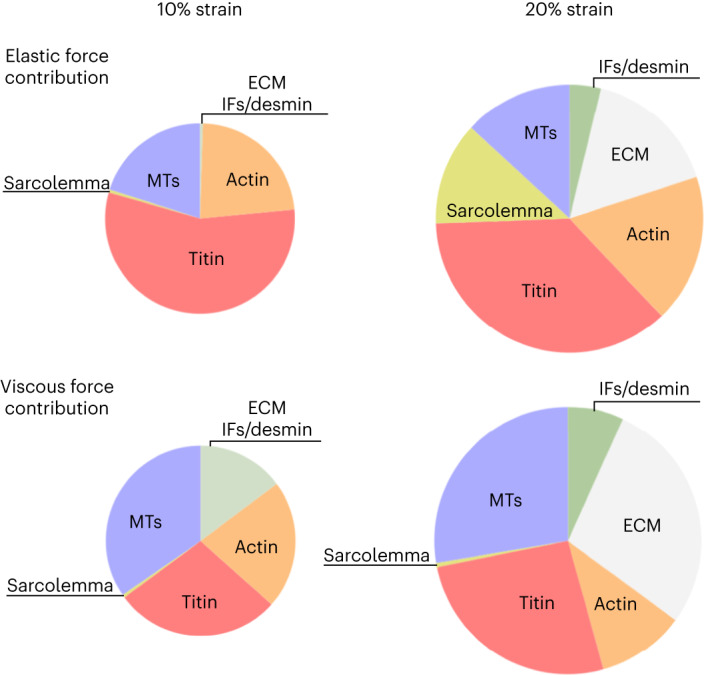
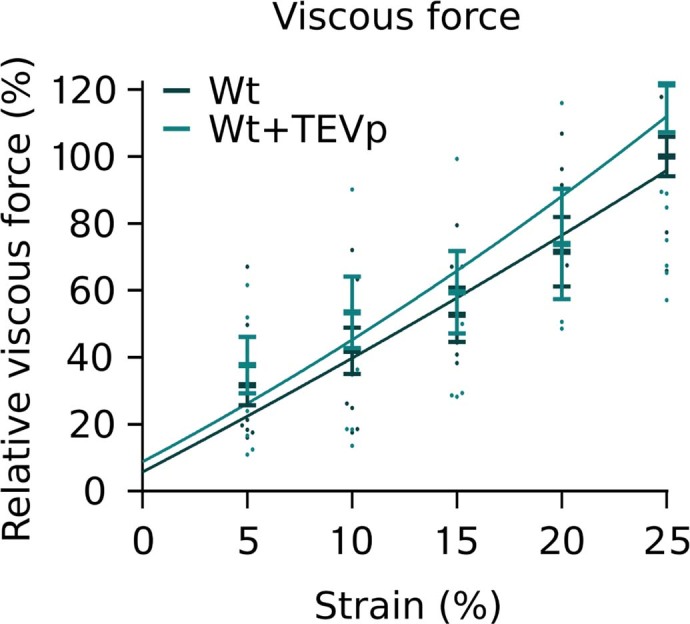
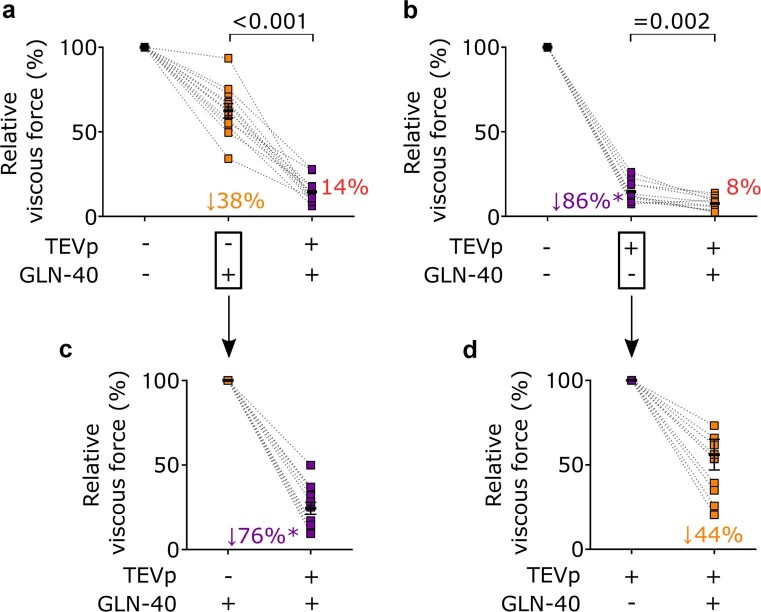
Myocardial passive stiffness is crucial for the heart's pump function and is determined by mechanical elements, including the extracellular matrix and cytoskeletal filaments; however, their individual contributions are controversially discussed and difficult to quantify. In this study, we targeted the cytoskeletal filaments in a mouse model, which enables the specific, acute and complete cleavage of the sarcomeric titin springs. We show in vitro that each cytoskeletal filament's stiffness contribution varies depending on whether the elastic or the viscous forces are considered and on strain level. Titin governs myocardial elastic forces, with the largest contribution provided at both low and high strain. Viscous force contributions are more uniformly distributed among the microtubules, titin and actin. The extracellular matrix contributes at high strain. The remaining forces after total target element disruption are likely derived from desmin filaments. Our findings answer longstanding questions about cardiac mechanical architecture and allow better targeting of passive myocardial stiffness in heart failure.


Conflict of interest statement

The authors declare no competing interests.

Figures

Fig. 1
Fig. 1. MT network structure and passive force contributions in cardiac LV fiber bundles.
a, Confocal images of native cardiac fiber bundles fixed immediately after isolation, perfused in NT buffer for 90 min as a control or treated with 30 µM colchicine (Colc.) for 90 min. The MTs were stained with anti-α-tubulin (top; secondary antibody, Alexa Fluor 488-conjugated IgG) and titin with α-TTN5 (middle; secondary antibody, Alexa Fluor Cy3-conjugated IgG); a merge image was added (bottom). Scale bars, 10 µm. Similar findings were obtained from N = 3 mice per group from n = 30 images. b, Matched samples from a were also used to detect the polymerized fraction of the MTs for western blot against α-tubulin with Coomassie staining of the PVDF membrane used as loading control, for quantification (n = 3). c, Pictographic representation of the Colc. treatment effect. d, Stretch protocol performed on cardiac fiber bundles and example traces from a cardiac fiber bundle measured under native conditions and after a 90-min incubation with 30 µM Colc. Inset is an enlargement of the 20% strain trace indicating the passive force components analyzed (elastic and viscous). Elastic (e) and viscous (f) forces under native conditions followed by Colc. treatment (N = 7 and n = 14). Forces are relative to the highest elastic/viscous force measured at 20% strain under native conditions. The significant force reduction after Colc. for a given strain is stated (pink values). All data are mean ± s.e.m. N refers to the number of animals used, and n refers to the number of fibers measured (b) or the number of measurements made for each strain level, including the two technical replicates measured for each cardiac fiber bundle (e,f). Significance (P values stated in black) was determined using a Kruskal–Wallis test and Dunn’s test (b) or two-way repeated-measures ANOVA followed by Sidak’s multiple comparisons test (e,f). Curves were fitted with a second-order polynomial (e,f). Source data
Fig. 2
Fig. 2. Sarcolemma constitution and passive force contribution in cardiac LV fiber bundles.
a, Confocal images of an LV fiber bundle area in native state and after permeabilization for 30 min with Triton X-100. Sarcolemma was stained with wheat germ agglutinin, MTs with anti-α-tubulin (secondary antibody, Alexa Fluor 488-conjugated IgG), titin with anti-HaloTag (secondary antibody, Alexa Fluor 647-conjugated IgG) and merge (bottom). Scale bars, 10 µm. Similar findings were obtained from N = 5 mice per group from n = 40 images. Elastic (b) and viscous (c) forces of native cardiac fiber bundles (Native) and then permeabilized for 30 min with Triton X-100 (Perm., N = 5, n = 10). Elastic (d) and viscous (e) forces after colchicine (Colc.) treatment first and then 30-min permeabilization (Perm.) with Triton X-100 (N = 7, n = 14). Forces are relative to the mean elastic and viscous forces measured at 20% strain in native fiber bundles (b,c) or after Colc. treatment (d,e). The significant force reduction after Perm. for a given strain is stated (blue values). Data are mean ± s.e.m. N refers to the number of animals used, and n refers to the number of measurements made for each strain level, including the two technical replicates measured for each cardiac fiber bundle. Significance was determined using a two-way repeated-measures ANOVA followed by Sidak’s multiple comparisons test (P values stated in black). Curves were fitted with a second-order polynomial. Source data
Fig. 3
Fig. 3. Actin passive force contribution in cardiac LV fiber bundles.
a, Confocal images of a permeabilized (Perm.) fiber bundle area stained with RP before and after actin extraction with gelsolin (GLN-40, top) and cartoons of the treatment effect (middle and bottom). Scale bars, 5 µm. Similar findings were obtained from N = 2 mice from n = 10 images. Elastic (b) and viscous (c) forces of Perm. cardiac fiber bundles before and after actin severing with GLN-40 (N = 3, n = 6). Forces are relative to the highest elastic and viscous forces measured at 20% strain of the Perm. fiber bundle before actin extraction. The significant force reduction after GLN-40 versus Perm. for a given strain is stated (orange values). Data are mean ± s.e.m. N refers to the number of animals used, and n refers to the number of measurements made for each strain level, including the two technical replicates measured for each cardiac fiber bundle. Significance was determined using a two-way repeated-measures ANOVA followed by Sidak’s multiple comparisons test (P values stated in black). Curves were fitted with a second-order polynomial. Source data
Fig. 4
Fig. 4. Specific titin cleavage in the TC-Halo mouse model and the contribution of titin to passive forces in cardiac LV fiber bundles.
a, Schematic of the HaloTag-TEVp recognition cassette within titin in the TC-Halo mouse model. Confocal images show HaloTag labeling with Alexa Fluor 488-conjugated HaloLigand before and after titin cleavage on the same cardiomyocyte sample. Scale bar, 10 µm. Similar findings were obtained from N = 3 mice per group from n = 10 images. b, Coomassie stain of a loose titin protein gel showing the effects of TEVp treatment on cardiac titin in homozygous (Hom), heterozygous (Het) and WT LV tissue samples and the same gel detecting the HaloTag labeling with HaloLigand-Alexa Fluor 488. Samples were obtained from N = 4 mice for each genotype, and n = 8 is the number of lanes analyzed for each group. c, Quantification of cardiac titin cleavage on Coomassie-stained gels (n = 8). d, Elastic forces before and after 10-min TEVp treatment in Hom (N = 8, n = 12) cardiac fiber bundles. e, Elastic forces in WT fiber bundles (N = 6, n = 9) under the same treatment conditions. f, Viscous force changes in Hom fibers under the same treatment conditions. Forces relative to an initial 30% strain before TEVp incubation with the mean of the 25% strain set to 100%. Data are mean ± s.e.m. N refers to the number of animals used, and n refers to the number of technical replicates on a gel (c) or individual cardiac fiber bundles measured (df). Curves were fitted with a second-order polynomial. The significant force reduction after TEVp versus Hom control for a given strain is stated (purple values). Significance was determined using an unpaired t-test (c) or two-way repeated-measures ANOVA followed by Sidak’s multiple comparisons test (df). P values are in black. N2BA, N2B and Cr (Cronos) are titin isoforms, and T2 is a proteolytic titin fragment. ‘Cleaved’, A-band titin part after TEVp. Source data
Fig. 5
Fig. 5. Passive force of single cardiomyocytes and sarcomere ultrastructure before/after titin cleavage and/or actin severing.
a, Stretch protocol and raw force traces (force (F) normalized to cross-sectional area (A)) from Hom and WT permeabilized cardiomyocytes after TEVp treatment. b, Elastic and viscous forces at a 20% strain measured in permeabilized Hom (N = 5, n = 11) and WT (N = 4, n = 7) cardiomyocytes after TEVp incubation (relative to pre-TEVp treatment). c,d, Representative electron micrographs of Hom TC-Halo sarcomeres and cartoons of untreated Hom (half-) sarcomere (c) and Hom (half-) sarcomere after titin cleavage with TEVp (d). Raw force/cross-sectional area (F/A) traces from a Hom cardiomyocyte (e) and mean relative elastic and viscous forces (N = 5, n = 12) before and after actin severing with gelsolin (GLN-40) (f). g, Representative electron micrograph of Hom sample after actin severing with GLN-40 (left) and cartoon of half-sarcomere depicting the GLN-40 treatment effect (right). h, Raw force/cross-sectional area (F/A) of a Hom cardiomyocyte before/after both actin severing and titin cleavage. i, Elastic and viscous forces remaining after actin severing and titin cleavage (probably desmin based, N = 5, n = 11). j, Representative electron micrograph of Hom sarcomeres after titin cleavage and actin severing. k, Desmin immunofluorescence staining (secondary antibody, Alexa Fluor 488-conjugated IgG) of an untreated sample and after titin cleavage+actin severing, with representative cartoon depicting the treatment effect. Scale bars, 10 µm. Data are mean ± s.e.m. N refers to the number of animals used, and n refers to the number of individual cardiomyocytes measured. For electron micrographs, similar images were obtained from N = 3–5 mice per group from n = 35 images. Significance was determined using two-tailed unpaired t-test. Scale bars for all electron micrographs, 500 nm. Source data
Fig. 6
Fig. 6. Actin and titin interdependence for elastic passive force contributions in cardiomyocytes.
ad, Elastic forces after first actin severing and then titin cleavage (N = 5, n = 12) (a) or first titin cleavage and then actin severing (N = 5, n = 11) (b) in permeabilized Hom cardiomyocytes. Titin cleavage relative to the previous actin severing (c) and actin severing relative to the previous titin cleavage (d) (as seen in a and b, respectively). Data are expressed as mean ± s.e.m. N refers to the number of animals used, and n refers to the number of individual cardiomyocytes measured. Orange, purple and red values are comparable actin, titin and IFs/desmin contributions, respectively. Dotted lines indicate the same sample measured after consecutive treatments. Comparisons and significance were determined using a two-tailed paired t-test. * indicates a significant difference. Further statistics can be found in Supplementary Table 1. Source data
Fig. 7
Fig. 7. Relative passive force contributions of the major myocardial structural elements.
Elastic (top) and viscous (bottom) force contributions of titin, MTs, sarcolemma, ECM, actin and IFs/desmin at low (left) and high (right) strain. Values can be found in Supplementary Table 2. Source data
Extended Data Fig. 1
Extended Data Fig. 1. Passive forces after 90-min incubation with DMSO.
(a) Elastic and (b) viscous forces under native conditions followed by a 90-min DMSO control incubation. Forces are relative to the elastic and viscous forces measured at 20% strain under native conditions. Data expressed as mean ± SEM, N = 5, n = 10. N refers to the number of animals used and n refers to the number of measurements made for each strain level including the two technical replicates measured for each cardiac fiber bundle. No important differences were found using a 2-way repeated measures ANOVA followed by a Sidak’s multiple comparisons test. Curves fitted with a 2nd order polynomial. Source data
Extended Data Fig. 2
Extended Data Fig. 2. Transitioning between different solution compositions can contribute to passive forces.
The removal of the sarcolemma required consideration for the movement between an extracellular (Na+ rich) environment to an intracellular environment (K+ rich) and differing Ca2+ conditions. Additional care needed to be taken to ensure passive force was not generated through the solution transitions alone. Numerous solution transitions were tested to determine how to move from the extracellular normal Tyrode’s (NT) solution to the intracellular relaxing solution (RS) and stay within the acceptable ±5% passive force change limit (dashed lines). Final solution transitions used are marked in red, data expressed as mean ± SEM, n is the number of technical replicates (n = 3 for solution transitions 1-3 and 3-5, n = 4 for solution transitions 2-5 and 4-5, n = 5 for solution transitions 1-2, 2-3 and 3-4, and n = 8 for solution transition 1-5). Solution 1- NT (140 mM NaCl, 0.5 mM MgCl2, 0.33 mM NaH2PO4, 5 mM HEPES, 5.5 mM glucose, 5 mM KCl, adjusted to pH 7.4 with NaOH). Solution 2- NT with 1 mM EGTA added. Solution 3- Sodium based RS (170 mM Na-Propionate, 20 mM MOPS, 2.5 mM Mg-Acetate, 5 mM K2EGTA, 2.5 mM ATP, 14.5 mM creatine phosphate, 1x working concentration of protease inhibitor cocktail (Promega: G6521), pH 7.0 at 0 °C. Solution 4- Sodium based RS with an additional 0.5 % Triton X-100. Solution 5- potassium-based RS (170 mM K-Propionate instead of Na-Propionate). Source data
Extended Data Fig. 3
Extended Data Fig. 3. Confirmation of the TC-Halo cassette distribution and complete severing of titin with TEVp.
(a) Confocal images of HaloTag labeling within mutant titin using anti-HaloTag and anti-α-actinin (secondary antibodies were Alexa Cy3-conjugated IgG and Alexa488-conjugated IgG, respectively), with associated quantification (right; mean ± SEM, n = 20), in homozygous (Hom), heterozygous (Het) and wildtype (Wt) TC-Halo mice. Scale bars, 10 µm. (b) Immunoelectron micrographs of anti-HaloTag (secondary antibody was nanogold-conjugated IgG) in Hom, Het and Wt TC-Halo mice, with associated quantification (right; mean ± SEM, n = 6). Scale bars, 500 nm. (c) Detection of the severed titin I-band fragment(s) with the I20-22 antibody and the A-band fragment with the MIR antibody, and accompanying PVDF stains (indicating protein load). Hom TC-Halo heart was used. Samples from titin gels came from N = 3 mice and n = 6 samples were run showing similar results. Significance was determined using a 1-way ANOVA followed by Tukey’s multiple comparisons test. n is the number of images analyzed. Source data
Extended Data Fig. 4
Extended Data Fig. 4. Cold storage of cardiac left ventricular (LV) fiber bundles in glycerol removes the sarcolemma and microtubule network.
LV fiber bundles were pre-permeabilized by storage in a 50:50 rigor:glycerol solution at -20 °C for a minimum of 3 months. Sarcolemma stained with wheat germ agglutinin (WGA-555), microtubules (MTs) with anti-α-tubulin and titin with anti-HaloTag; secondary antibodies were Alexa488-conjugated IgG and Alexa 647-conjugated IgG, respectively. Scale bars, 10 µm. Similar findings were obtained from N = 3 mice per group from n = 30 images. Source data
Extended Data Fig. 5
Extended Data Fig. 5. Viscous passive forces in Wildtype (Wt) cardiac left ventricular (LV) fiber bundles.
Viscous forces before and after 10-min TEVp treatment in Wt (N = 6, n = 9) cardiac LV fiber bundles. Forces relative to an initial 30% strain before TEVp incubation with the mean of the 25% strain set to 100%. Data are mean ± SEM. N is the number of animals used and n is the number of cardiac fiber bundles measured. Curves fitted with a 2nd order polynomial. Source data
Extended Data Fig. 6
Extended Data Fig. 6. Desmin and titin staining after titin cleavage and actin severing.
Confocal images of glycerol-stored homozygous (Hom) Titin-Cleavage-Halomouse left ventricular fiber bundles untreated (top) and treated with TEVp to cleave titin and gelsolin (GLN-40) to sever actin (bottom). Anti-desmin and anti-TTN-Z antibodies used; secondary antibodies were Alexa488-conjugated IgG and Alexa Cy3-conjugated IgG, respectively. Scale bars, 10 µm. Similar findings were obtained from N = 4 mice per group from n = 40 images. Source data
Extended Data Fig. 7
Extended Data Fig. 7. Actin and titin interdependence for passive viscous force contributions in cardiomyocytes.
(a) Viscous forces after first actin severing and then titin cleavage (N = 5, n = 12) or (b) first titin cleavage then actin severing (N = 5, n = 11) in permeabilized Hom cardiomyocytes. (c) Titin cleavage relative to the previous actin severing and (d) Actin severing relative to the previous titin cleavage (as seen in a and b, respectively). Data expressed as mean ± SEM. N is the number of animals and n is the number of cardiomyocytes measured. + symbols highlight the treatment of interest at each step. Orange, purple and red values are comparable actin, titin and IFs/desmin contributions, respectively. Comparisons and significance were determined using a 2-tailed Student’s t-test. *indicates a significant difference. Source data

References

    1. Kawai, M. & Jin, J. P. Mechanisms of Frank–Starling law of the heart and stretch activation in striated muscles may have a common molecular origin. J. Muscle Res. Cell Motil.42, 355–366 (2021). 10.1007/s10974-020-09595-2 - DOI - PMC - PubMed
    1. van Heerebeek, L. et al. Myocardial structure and function differ in systolic and diastolic heart failure. Circulation113, 966–1973 (2006). - PubMed
    1. Lizardi, J. C. V. et al. A guide for assessment of myocardial stiffness in health and disease. Nat Cardiovasc Res.1, 8–22 (2022). 10.1038/s44161-021-00007-3 - DOI - PubMed
    1. Hinderer, S. & Schenke-Layland, K. Cardiac fibrosis—a short review of causes and therapeutic strategies. Adv. Drug Deliv. Rev.146, 77–82 (2019). 10.1016/j.addr.2019.05.011 - DOI - PubMed
    1. Caporizzo, M. A., Chen, C. Y. & Prosser, B. L. Cardiac microtubules in health and heart disease. Exp. Biol. Med.244, 1255–1272 (2019).10.1177/1535370219868960 - DOI - PMC - PubMed

LinkOut - more resources