Randomized Controlled Trial
. 2023 Nov;2(11):1032-1043.
doi: 10.1038/s44161-023-00352-5. Epub 2023 Oct 26.

Empagliflozin effects on iron metabolism as a possible mechanism for improved clinical outcomes in non-diabetic patients with systolic heart failure

Affiliations
Randomized Controlled Trial

Empagliflozin effects on iron metabolism as a possible mechanism for improved clinical outcomes in non-diabetic patients with systolic heart failure

Christiane E Angermann et al. Nat Cardiovasc Res. 2023 Nov.

Abstract

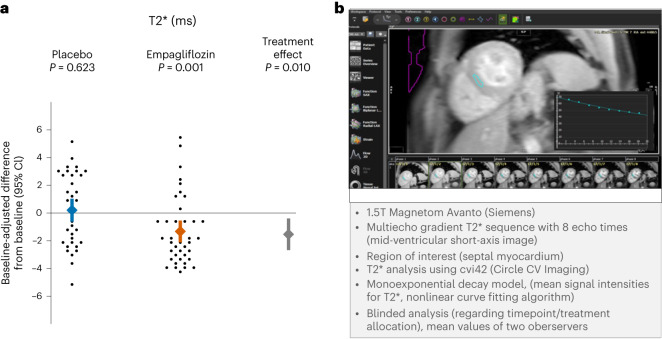
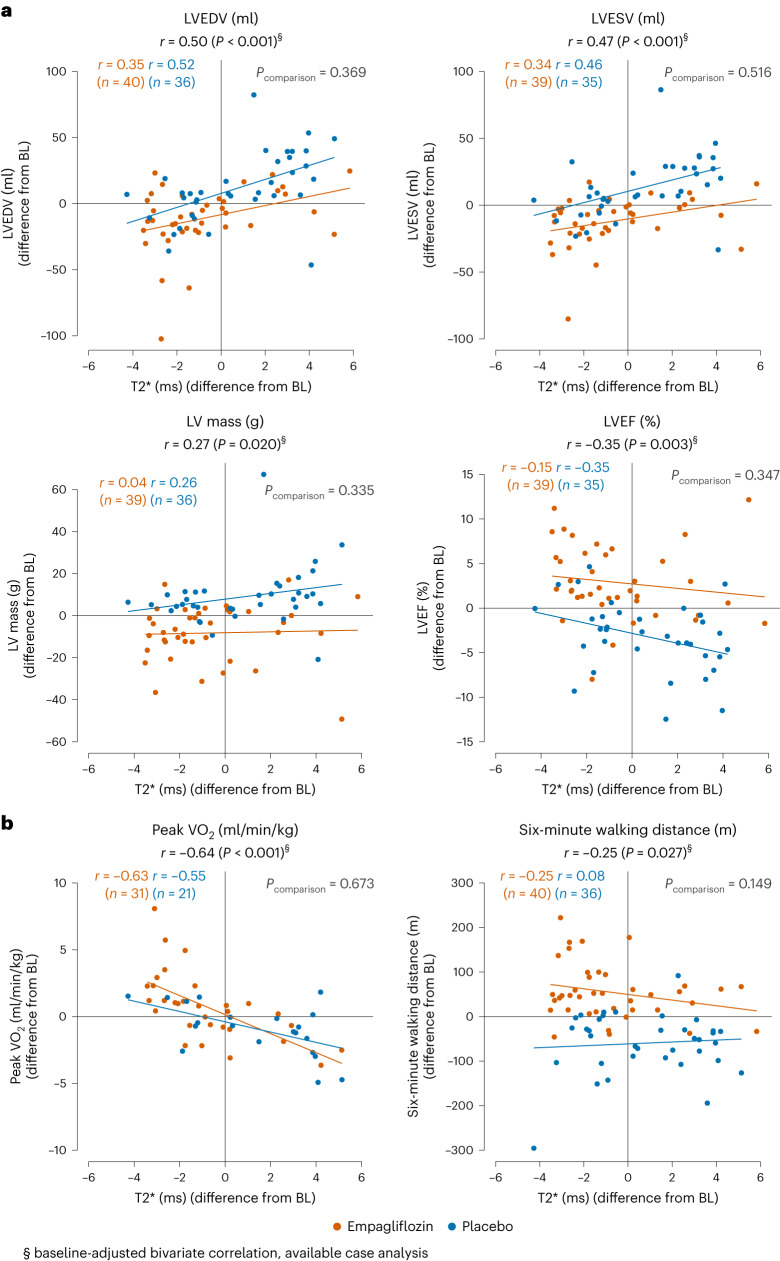
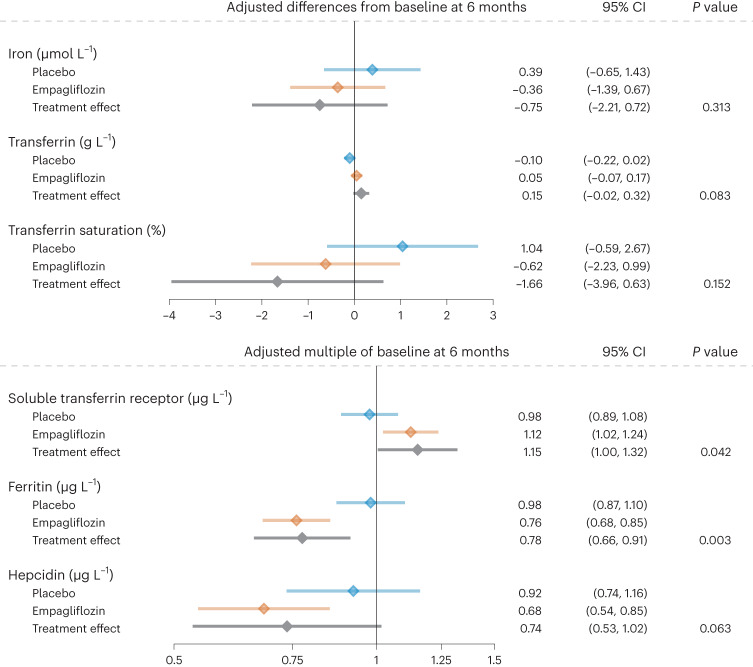
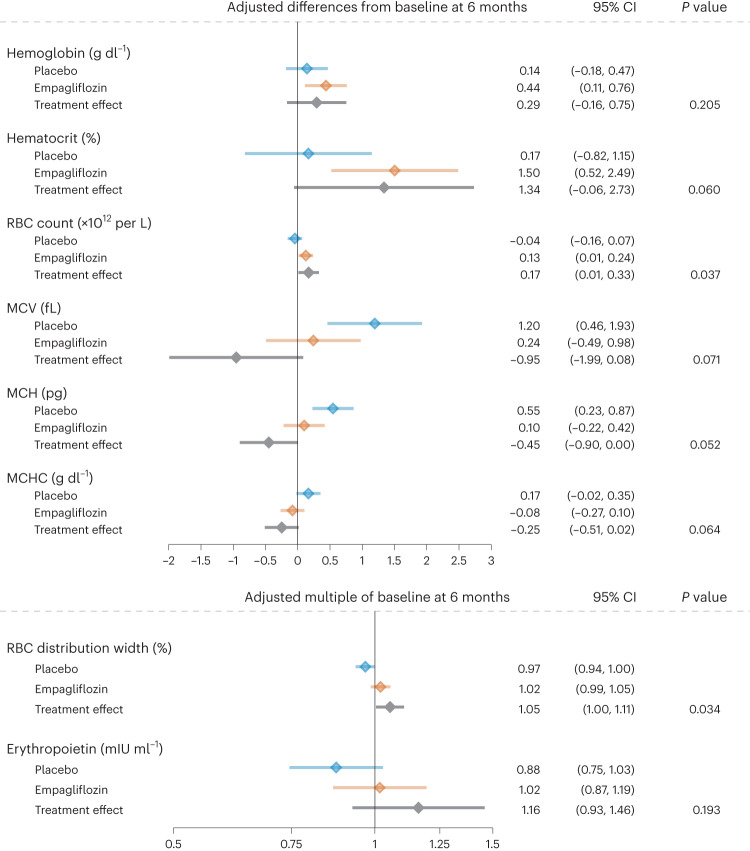
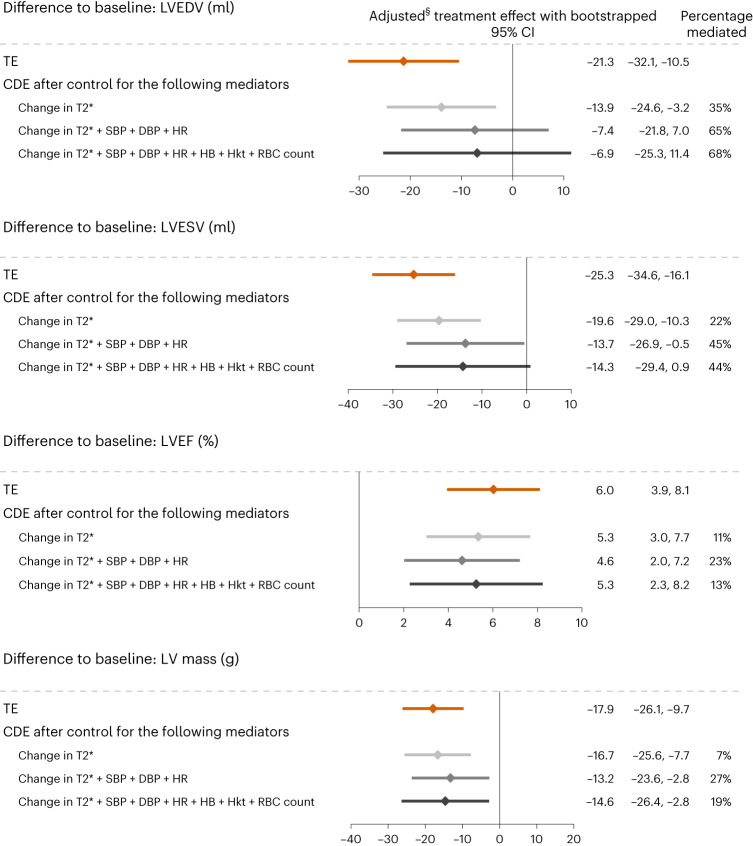
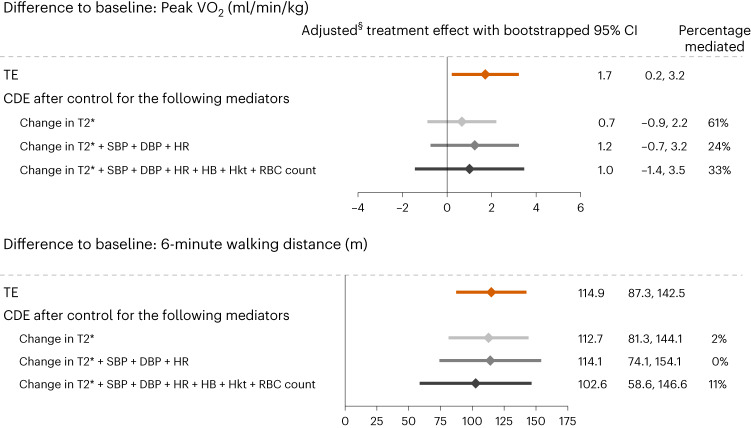
Sodium-glucose co-transporter-2 (SGLT2) inhibitors improve clinical outcomes in patients with heart failure (HF), but mechanisms of action are incompletely understood. In the EMPA-TROPISM trial, empagliflozin reversed cardiac remodeling and increased physical capacity in stable non-diabetic patients with systolic HF. Here we explore, post hoc, whether treatment effects in this cohort, comprising patients who had a high prevalence of iron deficiency, were related to iron metabolism. Myocardial iron content estimated by cardiac magnetic resonance T2* quantification increased after initiation of empagliflozin but not placebo (treatment effect: P = 0.01). T2* changes significantly correlated with changes in left ventricular volumes, mass and ejection fraction, peak oxygen consumption and 6-minute walking distance; concomitant changes in red blood cell indices were consistent with augmented hematopoiesis. Exploratory causal mediation analysis findings indicated that changes in myocardial iron content after treatment with empagliflozin may be an important mechanism to explain its beneficial clinical effects in patients with HF.ClinicalTrials.gov: NCT03485222 .


Conflict of interest statement

C.E.A. reports grant support, personal fees and/or non-financial support from Abbott, AstraZeneca, Boehringer Ingelheim and Eli Lilly, Medtronic, Novo Nordisk, Novartis, ResMed, Thermo Fisher Scientific and Vifor, all outside of the submitted work. C.G.S.-G. reports grant support from Merck, outside of the submitted work. C.M. reports personal fees from Amgen, Abbott, AstraZeneca, Berlin Chemie, Boehringer Ingelheim and Eli Lilly, Bristol-Myers Squibb, Edwards, Novartis, Novo Nordisk, Pharmacosmos and Servier, all outside of the submitted work. T.Z. reports previous funding from Vifor for research-related biobanking, outside of the submitted work. S.F. reports personal fees from Amgen Europe, AstraZeneca, Bayer Vital, Boehringer Ingelheim, Bristol-Myers Squibb, Daiichi Sankyo, Merck Sharp & Dohme, Novartis, Pfizer, Sanofi, Servier and Vifor, all outside of the submitted work. G.E. reports personal fees and/or grant support from Abbott, Bayer, Boehringer Ingelheim and Eli Lilly, Novartis, ResMed and Vifor, all outside of the submitted work. J.J.B. reports grant support by Boehringer Ingelheim and Eli Lilly. All other authors declare no competing interests.

Figures

Fig. 1
Fig. 1. Estimation of myocardial iron content using CMR T2* mapping.
a, Baseline-adjusted intra-group changes with 95% CI in myocardial T2* from baseline to 6-month follow-up in patients treated with empagliflozin (40 patients) versus placebo (36 patients). Estimated using a baseline-adjusted linear regression model with a two-sided significance level of 0.05, without correction for multiplicity. Results show a significant treatment effect due to a decline of myocardial T2* values in patients treated with empagliflozin. b, Mapping technology to quantify parametric T2* as a surrogate marker of myocardial iron content, with lower values suggesting higher myocardial iron content. See text for further details. CV, cardiovascular; ROI, region of interest. Source data
Fig. 2
Fig. 2. Group-specific correlations and regression lines of changes in T2* and changes in measures of LV remodeling and exercise capacity at 6-month follow-up.
a,b, Group-specific correlations and regression lines of changes in T2* and changes in measures of LV remodeling (a) and exercise capacity (b) at 6-month follow-up. Pearson correlation coefficients are presented for both study groups and compared for equal correlations using the Jennrich test. In case of a non-significant test, the Pearson correlation coefficient over all patients is given. Results show significant correlations between the changes across study groups. BL, baseline. Source data
Fig. 3
Fig. 3. Effect of 6 months’ treatment with empagliflozin versus placebo on laboratory markers of iron status and hepcidin and resulting treatment effects.
Data are presented as baseline-adjusted mean differences from baseline with 95% CI, estimated using baseline-adjusted linear regression models for each endpoint with a two-sided significance level of 0.05 and without correction for multiplicity. All analyses are based on data from 80 patients. Source data
Fig. 4
Fig. 4. Effects of 6 months’ treatment with empagliflozin versus placebo on RBC indices, hematocrit and erythropoietin and resulting treatment effects.
Data are presented as baseline-adjusted mean difference from baseline with 95% CI, estimated using baseline-adjusted linear regression models for each endpoint with a two-sided significance level of 0.05 and without correction for multiplicity. All analyses are based on data from 80 patients. Source data
Fig. 5
Fig. 5. Stepwise multivariable CMAs for the treatment effects on changes in measures of LV structure and function.
For each outcome, baseline-adjusted treatment effects with 95% bootstrapped CIs are presented as TE and CDE. The CDE describes the residual treatment effect after controlling for the mediated treatment effect. Shifts in the treatment effect illustrate the contributions mediated with stepwise addition of the three clusters of mediators. All analyses are based on data from 80 patients. DBP, diastolic blood pressure; Hb, hemoglobin; Hkt, hematocrit; HR, heart rate; SBP, systolic blood pressure. Source data
Fig. 6
Fig. 6. Stepwise multivariable CMAs for the treatment effects on changes in measures of physical capacity.
Methods for this analysis are as reported in the Fig. 5 caption. DBP, diastolic blood pressure; Hb, hemoglobin; Hkt, hematocrit; HR, heart rate; SBP, systolic blood pressure. Source data
Extended Data Fig. 1
Extended Data Fig. 1. Agreement in assessment of myocardial T2* between two investigators.
Shown are interobserver reliabilities of the assessments at baseline (left) and at the 6-month follow-up (right). Each time, the line of identity (y = x) and the range of the 20% deviation of agreement are displayed. Assessments outside this range are shown in red. CI, confidence interval. Source data
Extended Data Fig. 2
Extended Data Fig. 2. Agreement between duplicate measurements of iron variables, hepcidin and erythropoietin.
Shown are intraclass reliabilities of duplicate measurements at baseline (left) and at the 6-month follow-up (right). Each time, the line of identity (y = x) and the range of the 20% deviation of agreement are displayed. Values outside this range are shown in red. The range of intra-class reliabilities is between 0.97 and 1.00. Source data
Extended Data Fig. 3
Extended Data Fig. 3. Sequence of analyses applied to EMPA-TROPISM data.
Boxes on the left-hand side of the figure show the sequence of analyses performed in the EMPA-TROPISM dataset. In the primary analysis of trial data (top box), the effects of empagliflozin versus placebo on LVEDV, LVESV, LVEF, LV mass, peak VO2 and 6-MWD were determined. In the post-hoc EMPATROPISM-FE substudy (middle box), we first evaluated the effects of study treatments (empagliflozin and placebo) on myocardial T2*, vital signs (systolic and diastolic blood pressure and heart rate), laboratory markers of iron status and hepcidin, and indices of red blood cells, hematocrit and erythropoietin. Exploratory mediation analysis (bottom box) was added to determine the proportion of the observed treatment effects that could be attributed to treatment-induced changes in the parameters evaluated in EMPATROPISM-FE. The right part of the figure provides more detailed information on the CMA methodology. CMAs were performed for each of the listed potential mediators and EMPA-TROPISM outcomes. Multiple adjustment of the CMAs was performed by including the listed potential mediator-outcome confounders. LVEDV, left ventricular end-diastolic volume; LVESV, left ventricular end-systolic volume; LVEF, left ventricular ejection fraction; LV mass, left ventricular mass; peak VO2, peak oxygen consumption; 6-MWD, 6-minute walking distance; CMA, causal mediation analysis.

References

    1. Butler, J. et al. Effect of empagliflozin in patients with heart failure across the spectrum of left ventricular ejection fraction. Eur. Heart J.43, 416–426 (2022). 10.1093/eurheartj/ehab798 - DOI - PMC - PubMed
    1. Jhund, P. S. et al. Dapagliflozin across the range of ejection fraction in patients with heart failure: a patient-level, pooled meta-analysis of DAPA-HF and DELIVER. Nat. Med.28, 1956–1964 (2022). 10.1038/s41591-022-01971-4 - DOI - PMC - PubMed
    1. Zelniker, T. A. et al. SGLT2 inhibitors for primary and secondary prevention of cardiovascular and renal outcomes in type 2 diabetes: a systematic review and meta-analysis of cardiovascular outcome trials. Lancet393, 31–39 (2019). 10.1016/S0140-6736(18)32590-X - DOI - PubMed
    1. Lopaschuk, G. D. & Verma, S. Mechanisms of cardiovascular benefits of sodium glucose co-transporter 2 (SGLT2) inhibitors: a state-of-the-art review. JACC Basic Transl. Sci.5, 632–644 (2020). 10.1016/j.jacbts.2020.02.004 - DOI - PMC - PubMed
    1. Packer, M. Critical reanalysis of the mechanisms underlying the cardiorenal benefits of SGLT2 inhibitors and reaffirmation of the nutrient deprivation signaling/autophagy hypothesis. Circulation146, 1383–1405 (2022). 10.1161/CIRCULATIONAHA.122.061732 - DOI - PMC - PubMed

Publication types

MeSH terms

Associated data