. 2024 Mar;3(3):301-316.
doi: 10.1038/s44161-024-00432-0. Epub 2024 Feb 19.

Bone morphogenic protein-4 availability in the cardiac microenvironment controls inflammation and fibrosis in autoimmune myocarditis

Affiliations

Bone morphogenic protein-4 availability in the cardiac microenvironment controls inflammation and fibrosis in autoimmune myocarditis

Christian Perez-Shibayama et al. Nat Cardiovasc Res. 2024 Mar.

Abstract

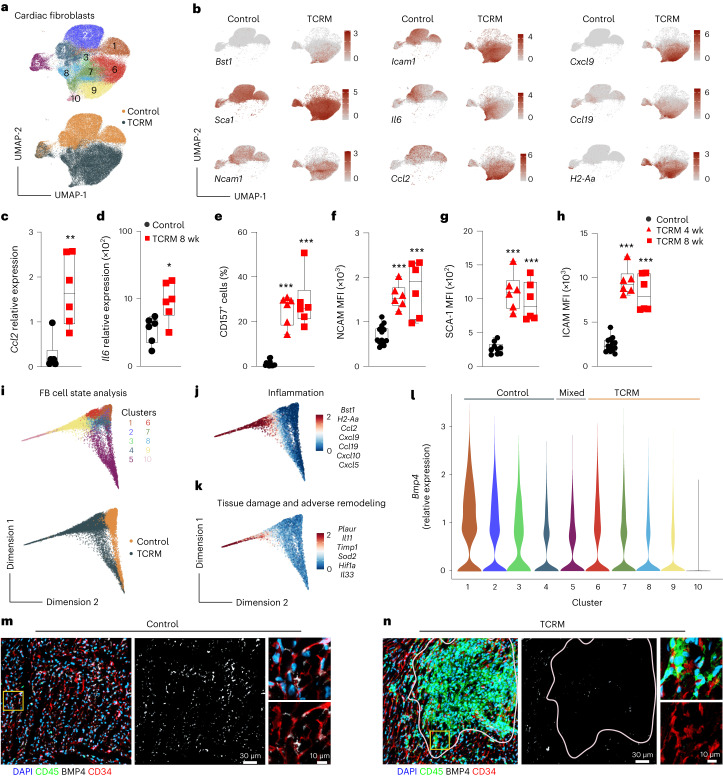
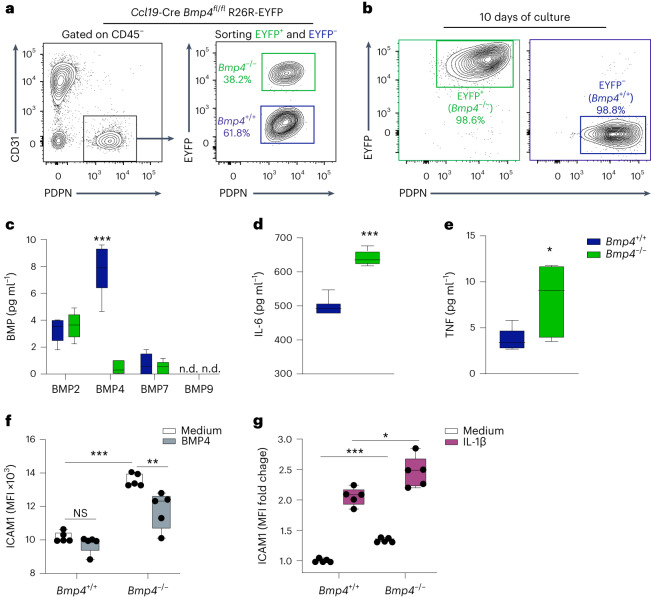
Myocarditis is an inflammatory heart disease that leads to loss of cardiomyocytes and frequently precipitates fibrotic remodeling of the myocardium, culminating in heart failure. However, the molecular mechanisms underlying immune cell control and maintenance of tissue integrity in the inflamed cardiac microenvironment remain elusive. In this study, we found that bone morphogenic protein-4 (BMP4) gradients maintain cardiac tissue homeostasis by single-cell transcriptomics analyses of inflamed murine and human myocardial tissues. Cardiac BMP pathway dysregulation was reflected by reduced BMP4 serum concentration in patients with myocarditis. Restoration of BMP signaling by antibody-mediated neutralization of the BMP inhibitors gremlin-1 and gremlin-2 ameliorated T cell-induced myocardial inflammation in mice. Moreover, progression to inflammatory cardiomyopathy was blocked through the reduction of fibrotic remodeling and preservation of cardiomyocyte integrity. These results unveil the BMP4-gremlin axis as a druggable pathway for the treatment of myocardial inflammation, limiting the severe sequelae of cardiac fibrosis and heart failure.


Conflict of interest statement

C.P.-S., C.G.-C., H.-W.C., L.O. and B.L. are founders and C.P.-S., C.G.-C., H.-W.C., L.O., L.T.C. and B.L. are shareholders of Stromal Therapeutics. L.T.C., L.O. and B.L. are members of the board of Stromal Therapeutics. C.P.-S., C.G.-C., L.O. and B.L. are listed as inventors on patent WO 2022/084400 A1. All other authors declare no competing interests.

Figures

Fig. 1
Fig. 1. Cellular interactions in autoimmune myocarditis.
ac, Enumeration of heart-infiltrating CD45+ cells (a), MYH6-specific (Vα2+ Vβ8+CD4+) T cells (b) and CD11b+ myeloid cells (c) from 4-week-old and 8-week-old TCRM or control (Ctrl) mice. d, Histopathological disease severity in control and TCRM mice. e, Representative confocal microscopy images showing CD4+ and CD11b+ cells and COL1 deposition in hearts from 8-week-old control and TCRM mice. Boxed areas in left panels denote magnified area in right panels (n = 4). fk, scRNA-seq and snRNA-seq analysis from total cardiac cells from age-matched and sex-matched control and TCRM mice. f, UMAP representation showing 16 cell populations in the heart of control and TCRM mice. g, Significantly enriched pathways according to GO enrichment analysis based on differentially expressed genes between total cardiac cells from control and TCRM mice. h, Scatter plot indicating incoming and outgoing interaction strengths of individual cell subsets based on network centrality measures on the aggregated cell–cell communication network. Dot size reflects interaction count. i, Top significantly enriched ligand–receptor pairs grouped according to functional similarity. Numbers in brackets indicate the quantity of receptor pairs within a functional group. j, UMAP projection showing the expression of the indicated genes. k, Dot plot depicting the average expression of the indicated BMP pathway-related genes in cardiac cells. l, Quantification of BMP4 protein in heart homogenates by ELISA. scRNA-seq/snRNA-seq data represent a total of 28,913 cells per nuclei from control (n = 6) and TCRM (n = 6) mice. Pooled data from 2–3 independent experiments with n = 7, 8 and 8 mice per group (ac), n = 8, 8 and 9 mice per group (d) or n = 6 mice per group (l). Representative sections from one out of five control or TCRM mice (c). Dots represent values from individual mice; box and whiskers show minimum to maximum, mean ± interquartile range (ad and l). CM, cardiomyocytes; EC, endothelial cells; FB, fibroblasts; Mono, monocytes; Mph, macrophages; NK cells, natural killer cells; PVC, perivascular cells; Ts, T cells; wk, weeks. Source data
Fig. 2
Fig. 2. Cardiac fibroblast-mediated regulation of BMP4 availability in the inflamed myocardium.
a,b,il, sc-RNA-seq analysis of sorted CD45PDPN+CD31 cardiac fibroblasts isolated from 4-week-old and 8-week-old control or TCRM mice. a, UMAP representation showing 10 cell clusters depicting cardiac fibroblast heterogeneity (top) and condition (bottom). b, Projection of the indicated gene expression on cardiac fibroblast UMAP plot from control and TCRM mice. c,d, Ccl2 (c) and Il6 (d) mRNA expression in sorted cardiac fibroblasts of 8-week-old control or TCRM mice. eh, Multi-parametric flow cytometric analysis of surface expression of CD157 (e), NCAM (f), SCA-1 (g) and ICAM1 (h) by cardiac fibroblasts from control or TCRM mice. MFI of the indicated activation markers in CD45PDPN+CD31 cardiac fibroblasts. Dots represent values from individual mice;box plots as in Fig. 1. i, Diffusion map representation based on gene expression in cardiac fibroblasts colored according to heterogeneity (top) and origin (bottom). j,k, Projection of the indicated gene signatures onto diffusion maps. l, Expression profile of Bmp4 in cardiac fibroblast subsets shown as violin plots. m,n, Representative confocal microscopy analysis of hearts from control (m) and TCRM (n) mice using the indicated markers. Single-cell transcriptomics data represent a total of 65,545 cardiac fibroblasts from control (n = 4) and TCRM (n = 5) mice. Pooled data from 2–3 independent experiments with n = 6 mice per group (c) or n = 9, 6 and 6 mice per group (dh). Representative sections from one out of five control or TCRM mice (m,n). Statistical analysis was performed using two-tailed Student’s t-test (c,d) or one-way ANOVA with Tukey’s multiple comparisons test (eh) with *P < 0.05, **P < 0.01 and ***P < 0.001. Source data
Fig. 3
Fig. 3. BMP4 regulation of cardiac fibroblasts.
Cardiac fibroblasts were isolated from hearts of 8-week-old Ccl19-Cre R26R-EYFP mice. a, Representative dot plots showing the gating strategy for FACS of PDPN+CD31, Bmp4-deficient (EYFP+) and Bmp4-proficient (EYFP) cardic fibroblasts. b, Purity of Bmp4-deficient (EYFP+) and Bmp4-proficient (EYFP) cardiac fibroblasts after 10 d of culture. Representative dot plots from three independent isolations. c, Production of the indicated BMPs by Bmp4−/− (EYFP+) or Bmp4+/+ (EYFP) fibroblasts. d,e, Production of the cytokines IL-6 (d) and TNF (e) by Bmp4−/− (EYFP+) or Bmp4+/+ (EYFP) fibroblasts after 24 h of culture (n = 5; pooled data from independent wells from two independent experiments). f,g, Expression of ICAM1 by Bmp4−/− (EYFP+) or Bmp4+/+ (EYFP) fibroblasts after exposure to medium or BMP4 (10 ng ml−1) (f) or IL-1β (1 ng ml−1) (g) as assessed by flow cytometry with MFI of ICAM1 in f and MFI fold change relative to ICAM1 expression by untreated Bmp4+/+ fibroblasts in g. Dots represent values from individual wells; pooled data of two independent experiments (n = 5). All box plots as in Fig. 1. Statistical analysis was performed using Student’s t-test (ce) or one-way ANOVA with Dunnett’s multiple comparison test (f,g) with *P < 0.05, **P < 0.01 and ***P < 0.001. FACS, fluorescence-activated cell sorting. Source data
Fig. 4
Fig. 4. Therapeutic treatment of acute myocarditis in TCRM mice with anti-GREM 1/2 monoclonal antibody (14-D10-2).
a, Schematic representation of the experimental design. b, Enumeration of CD45+ heart-infiltrating cells in 8-week-old TCRM mice treated with IgG2b isotype control or GREM1/2-neutralizing antibody (14-D10-2) using flow cytometry. c, Representative confocal microscopy images showing collagen deposition and immune infiltrates in the hearts of TCRM mice treated with isotype or 14-D10-2 antibodies. d,e, Flow cytometry-based enumeration (d) and functional characterization (e) of MYH6-specific, Vα2+Vβ8+CD4+ T cells with representative dot plots (left) and quantification of cytokine-producing MYH6-specific T cells (right). fh, Flow cytometric enumeration of CD11b+Ly6C+CCR2+ inflammatory monocytes (f), CD11b+Ly6CintLy6G+ neutrophils (g) and CD11b+CD64+MHCIIhi activated macrophages (h). i, MFI of CD86 expression on CD11b+CD64+MHCIIhi activated macrophages. j, Tnf mRNA expression by sorted CD11b+Ly6G myeloid cells. k, IL-1β protein concentration in cardiac homogenates. l, Fraction of CD157+SCA1+ cells of CD45PDPN+CD31 cardiac fibroblasts. m, MFI of the indicated activation markers by CD45PDPN+CD31 cardiac fibroblasts. n, Representative confocal microscopy images showing BMP4 production by CD34+ fibroblasts in inflamed hearts of isotype antibody-treated TCRM mice and restoration of BMP4 production by 14-D10-2 antibody treatment. o, Quantification of BMP4 protein in heart homogenates by ELISA. Box plots as in Fig.1; pooled data from three independent experiments with n = 6 (control) or n = 9 (TCRM) mice per group (b,dm,o). Representative sections from one out of five control or TCRM mice (c,n). Statistical analysis was performed using Student’s t-test with *P < 0.05, **P < 0.01 and ***P < 0.001. Source data
Fig. 5
Fig. 5. Long-term effects of GREM1/2 blockade.
a, Survival of TCRM mice after treatment with GREM1/2-neutralizing antibody (14-D10-2) or IgG2b isotype control antibody. bd, Cardiac gross pathology (b), representative H&E-stained heart sections (c) and histopathological disease severity (d) of 20-week-old TCRM mice subjected to the indicated treatment (n = 9 and 10 mice per group). e, Dot plots depicting the average expression of the indicated genes in total cardiac cells (top) and cardiac fibroblasts (FB; bottom) of 12-week-old TCRM mice treated with the indicated antibodies. f, Top significantly enriched pathways according to GO enrichment analysis based on differentially expressed genes in all cardiac cells from TCRM mice treated with control or GREM1/2-neutralizing antibodies. g,h, Representative images of picrosirius red-stained heart sections (representative image from eight mice per group) (g) and quantification of collagen network size (h) from 12-week-old TCRM mice treated with control or GREM1/2-neutralizing antibodies (n = 8 mice per group from three independent experiments). i, Ejection fraction (EF) as determined by echocardiography in 8-week-old TCRM mice treated with 14-D10-2 or isotype antibody between week 4 and week 8. Numbers indicate fraction of mice developing heart failure before the end of the treatment period; box plots as in Fig. 1 (n = 18 and 21 mice per group). scRNA-seq and snRNA-seq data represent a total of 27,160 cells per nuclei from control (n = 4) and TCRM (n = 4) mice (e,f). Statistical analysis was performed using Mann–Whitney U-test (d,h,i) with **P < 0.01 and ***P < 0.001. ROS, reactive oxygen species. Source data
Fig. 6
Fig. 6. Regulation of BMP4 expression in human myocardial inflammatory disease.
ak, snRNA-seq from left or right ventricular EMBs from patients with acute myocarditis (AM) (n = 5), inflammatory cardiomyopathy (ICM) (n = 8), dilated cardiomyopathy (DCM) (n = 3) or undergoing heart transplantation (HTx) (n = 7). a,b, UMAP representation (a) and abundance of cardiac cell populations (b) in individual patients. ce, Frequencies of T cells (c), inflammatory macrophages (d) and cardiomyocytes (e) in patients stratified according to high (>6%, T cellHigh, n = 7), intermediate (3–6%, T cellInt, n = 9) and low (<3%, T cellLow, n = 7) proportions of heart-infiltrating T cells. Dots indicate individual patients; bars indicate geometric means. f, Correlation between T cells and inflammatory macrophages (left) and T cells and resident macrophages (right). g, Heat maps showing average gene expression of the indicated, differentially expressed genes grouped by function in T cells, macrophages and cardiomyocytes. h, Significantly enriched pathways according to GO enrichment analysis based on differentially expressed genes between cardiac fibroblasts from T cellLow and T cellHigh cardiac biopsies. i, Average BMP4 gene expression in cardiac fibroblast. Dots indicate values of individual patients; box plots as in Fig. 1. j, ELISA-based quantification of BMP4 concentration in serum from healthy donors or patients with biopsy-confirmed and/or cardiac MRI-confirmed acute myocarditis. Dots indicate values of individual patients; data are mean ± s.e.m. k, ROC curve of BMP4 serum concentrations of patients with acute myocarditis and healthy controls. snRNA-seq data represent a total of 44,114 nuclei, two biopsies per patient (n = 23 patients). Statistical analysis was performed using one-way ANOVA with Dunnett’s post test (ce), Benjamini, Krieger and Yekutieli post test (i) or Mann–Whitney U-test (k) with **P < 0.01 and ***P < 0.001. Simple linear regression test was used in f. CI, confidence interval; LEC, lymphatic endothelial cells; NC, neural cells; SMC, smooth muscle cells. Source data
Extended Data Fig. 1
(a) Gating strategy for flow cytometric characterization of MYH6-specific cardiac T cells expressing the Vα2 and Vβ8 TCR chains. (b) Gating strategy for flow cytometric characterization of heart-infiltrating myeloid cells (upper panel) with colored frames indicating specific monocyte/macrophage populations analyzed in TCRM and transgene-negative littermate control mice at the age of 4 and 8 weeks (N = 7 mice per group from at 2 independent experiments). (c) Representative microscopy images from hematoxylin&eosin-stained sections from 8-week-old Ctrl and TCRM mice. (d) Quantification of picrosirius red-stained collagen networks on heart sections (N = 6 mice per group from 2 independent experiments). (e) UMAP representation of cardiac cell populations derived from sc- and snRNA-seq (upper panel) and of 4- and 8-week-old mice (bottom panel). (f) Heatmap showing the expression of marker genes used to assign cell identity to cardiac cells from Ctrl and TCRM mice detected by sn- and scRNA-seq analysis. (g) Bmp2 and Bmp4 mRNA expression as determined by RT-PCR in the indicated FACS-sorted cardiac cells from 8-week-old Ctrl or TCRM mice; FB, CD45 PDPN+ CD31 fibroblast; EC, CD45 PDPN CD31+ endothelial cells; CD45, CD45+ immune cells. Bars show mean ± SEM (N = 6 mice per group from 3 independent experiments). (h) mRNA expression of the indicated BMPs from cardiac fibroblasts measured by sc/snRNAseq (N = 5 from 2 independent experiments). (i) Concentrations of the corresponding BMPs from cardiac homogenates measured by ELISA (N = 6 mice per group from two independent experiments). (j) GREM1 and GREM2 concentrations measured by ELISA from cardiac homogenates from 8-week-old littermate controls (Ctrl) or TCRM mice; N = 6, mice per group data from 2 independent experiments. Box and whiskers show min to max, mean ± interquartile range. Statistical analysis was performed using Student’s t test (g-j); one-way ANOVA with Dunnett’s multiple comparison test (b and d) with *, p < 0.05; **, p < 0.01; ***, p < 0.001. Source data
Extended Data Fig. 2
Extended Data Fig. 2. Single cell RNAseq analysis and flow cytometric characterization of CD45 PDPN+ CD31 cardiac fibroblasts isolated from 4- and 8-week-old Ctrl and TCRM mice.
(a) Heatmap showing the expression of the top differentially expressed genes from the 10 clusters of cardiac fibroblasts from Ctrl and TCRM mice. (b) Significantly enriched pathways according to Gene Ontology (GO) enrichment analysis based on differentially expressed genes between Ctrl and TCRM cardiac fibroblasts. (c) Flow cytometric gating strategy used to characterize cardiac fibroblast phenotype. (d) Representative density plot depicting the expression of CD157 and NCAM by cardiac fibroblasts from Ctrl and TCRM mice. (e) Differentially regulated functional pathways from single cell RNAseq analysis of cardiac fibroblasts. (f) Expression pattern of genes assigned to the indicated cellular processes projected onto diffusion maps per signature as in panel (e). (g, h) Intracellular phospho-SMAD1/5/9 expression by CD45 CD31 PDPN+ CD56+ cardiac fibroblasts isolated from 4- (N = 4 mice per group) and 8-week-old (N = 5 mice per group) Ctrl and TCRM mice. (g) Representative histogram from cells isolated from 8-week-old mice. (h) Fold change of pSMAD1/5/9 mean fluorescence intensity (MFI) was calculated relative to baseline pSMAD1/5/9 expression in CD56 fibroblasts; pooled data from two independent experiments. Dots indicate individual mice, mean ± SEM is displayed. Statistical analysis was performed using Two-tailed Student’s t test (h). with **, p < 0.01. Source data
Extended Data Fig. 3
Extended Data Fig. 3. Activation of cardiac fibroblasts.
(a) Computationally predicted murine BMP4-BMPR1a/BMPR2 interactions by cells in the homeostatic and inflamed cardiac microenvironment based on sc/snRNA-seq data using the CellChat tool. (b) Representative confocal images of Bmp4-deficient (EYFP+) and Bmp4-proficient (EYFP) fibroblasts after 10 days of culture. (c, d) Production of BMP4 (c) and IL-6 (d) measured by ELISA from Bmp4-proficient (EYFP) fibroblasts cardiac fibroblasts exposed IL-1β (1 ng/ml) or left untreated (medium) for 24 h. Box and whiskers show min to max, mean ± interquartile range. (N = 6; pooled data from two independent experiments). Statistical analysis was performed using Student’s t test (c-d) with ***, p < 0.001. Source data
Extended Data Fig. 4
Extended Data Fig. 4. Binding and functional characterization of anti-GREM1/2 monoclonal antibodies.
(a) Heatmap representing binding of 3-A1-3, 20-D1-5 and 14-D10-2 mAbs to human GREM1 and GREM2 as determined by ELISA. (b) Dose-dependent binding of the indicated anti-GREM1/2 mAbs to human GREM1 and GREM2 as determined by ELISA. Area under the curve (AUC) was calculated as the area under the titration curve from 1:2 serial dilutions of each antibody (2.5 - 0.02 µg) and GREM1 and GREM2 (0.5–0.008 µg/ml). (c–e) Neutralization capacity of the indicated mAbs using GREM1 and GREM2 in BMP4-induced luciferase activity by SL-0051 cells. Hundred percent BMP4 activity was determined as relative light units in the absence of GREM1 (c) or GREM2 (d) (N = 3, mean ± SEM; representative data from 1 out of 3 independent experiments with similar results). (e) The concentration of the indicated mAb necessary to restore 50% of BMP4 activity (EC50) was determined based on the values shown in (c) and (d); N = 6 independent replicates from 2 independent experiments. (f–h) Effect of anti-GREM1/2 mAb treatment in the adoptive T cell transfer myocarditis model. (f) Schematic representation of the experimental set up. (g) Quantification of heart-infiltrating CD45+ cells (h) and cytokine production of heart-infiltrating MYH6-specific CD4+ Vβ8+ T cells in Rag1−/− mice at day 28 post T cell adoptive transfer. N = 8, 10, 8 or 7 mice per group from 3 independent experiments. Box and whiskers show min to max, mean ± interquartile range; dots indicate individual mice. (i, j) Intracellular phospho-SMAD1/5/9 expression by CD45 CD31 PDPN+ CD56+ cardiac fibroblasts isolated from 8-week-old TCRM mice treated with IgG2b isotype control or GREM1/2-neutralizing antibody (14-D10-2) with representative histograms shown in (i). (j) Fold change of pSMAD1/5/9 mean fluorescence intensity (MFI) calculated relative to baseline pSMAD1/5/9 expression in CD56 fibroblasts (N = 4 mice per group from 2 independent experiments) Dots indicate individual mice, mean ± SEM is displayed. Statistical analysis was performed using one-way ANOVA with Dunnett’s multiple comparison test (g-h) or two tailed Student’s t test (j) with *, p < 0.05; **, p < 0.01; ***, p < 0.001. Source data
Extended Data Fig. 5
Extended Data Fig. 5. Single cell- and single nucleus RNA-seq analysis of cardiac cells from TCRM mice treated 4 for weeks with isotype control or GREM1/2-neutralizing antibody 14-D10-2 and further validation experiments.
(a) Schematic representation of the experimental set up. (b) UMAP representation showing marker gene assigned cell populations in the murine heart. (c) Pie charts depicting the proportions of the different cell populations based on snRNA-seq analysis of TCRM hearts; isotype, 13,498 nuclei; 14-D10-2, 13,662 nuclei. (d) Enumeration of the indicated heart-infiltrating immune cell populations in 12-week-old TCRM mice treated with Ig2b isotype control or GREM1/2-neutralizing antibody (14-D10-2) using flow cytometry (N = 7 mice per group, pooled data from 2 independent experiments). Box and whiskers show min to max, mean ± interquartile range; dots indicate individual mice. (e) Heatmap showing changes in the expression of differentially expressed genes grouped by function from the fibroblast population in TCRM mice treated with isotype or 14-D10-2 antibodies. (f) Representative images showing immune cell infiltration and collagen deposition in hearts from 12-week-old TCRM mice treated with the indicated antibodies; hematoxylin-eosin (left panels) and confocal microscopy with indicated antibody staining (right panels). (g) Assessment of blood cell composition and the concentration of key serum enzymes in 16-week-old Balb/c mice according to the indicated treatment scheme; WBC, white blood cells; RBC, red blood cells; PLT, platelets; AST, aspartate aminotransferase; ALT, alanine transaminase; CK, creatine kinase (N = 6 mice per group, pooled data from two independent experiments; Bars indicate mean ± SEM). Statistical analysis was performed using Student’s t test (d, g, h) and 2-way Anova with Sidak’s multiple comparisons test (disease activity score in h), with *, p < 0.05; **, p < 0.01; ***, p < 0.001. Source data
Extended Data Fig. 6
(a) Heatmap showing the expression of the marker genes used to assign the population identity of the different clusters obtained from snRNAseq analysis of endomyocardial biopsies (EMBs) of acute myocarditis, inflammatory cardiomyopathy, dilated cardiomyopathy or heart transplantation patients. (b) Pie charts depicting total number of nuclei from the different patients stratified by the percentage of infiltrating T cells with T cellHigh, T cellInt and T cellLow groups. (c) Correlation of multiple variables comparing the different proportions of cardiac cells in the snRNA-seq analysis of EMBs from 23 patients; Pearson’s R correlation values. Source data
Extended Data Fig. 7
Network plots depicting significantly enriched gene sets in cardiac fibroblasts from (a) T cellLow and (b) T cellHigh groups according to GO enrichment analysis based on differentially expressed genes in snRNA-seq analysis of cardiac EMBs. (c) Correlation analysis BMP4 mRNA expression and T cell infiltration in EMBs. Colors indicate the proportion of infiltrating T cells. High, red dots (>6%, T cellHigh); intermediate, green dots (3–6%, T cellInt) and low, blue dots (<3%, T cellLow) proportions of heart-infiltrating T cells. (d, e) Multiparametric correlation analysis between proportions of infiltrating cardiac cells and genes of the BMP family. (d) Pearson’s correlation comparisons of indicated cell type abundances and expression of indicated genes. (e) P values from the Pearson’s correlation comparisons in (d). Statistical analysis was performed using simple linear regression test (c). Source data

References

    1. Pasupathy, S., Air, T., Dreyer, R. P., Tavella, R. & Beltrame, J. F. Systematic review of patients presenting with suspected myocardial infarction and nonobstructive coronary arteries. Circulation131, 861–870 (2015). 10.1161/CIRCULATIONAHA.114.011201 - DOI - PubMed
    1. Basso, C. Myocarditis. N. Engl. J. Med.387, 1488–1500 (2022). 10.1056/NEJMra2114478 - DOI - PubMed
    1. Weintraub, R. G., Semsarian, C. & Macdonald, P. Dilated cardiomyopathy. Lancet390, 400–414 (2017). 10.1016/S0140-6736(16)31713-5 - DOI - PubMed
    1. Caforio, A. L. et al. Current state of knowledge on aetiology, diagnosis, management, and therapy of myocarditis: a position statement of the European Society of Cardiology Working Group on Myocardial and Pericardial Diseases. Eur. Heart J.34, 2636–2648 (2013). 10.1093/eurheartj/eht210 - DOI - PubMed
    1. Harding, D. et al. Dilated cardiomyopathy and chronic cardiac inflammation: pathogenesis, diagnosis and therapy. J. Intern. Med.293, 23–47 (2023). 10.1111/joim.13556 - DOI - PubMed

Publication types

MeSH terms

Substances