. 2024 Mar;3(3):317-331.
doi: 10.1038/s44161-024-00431-1. Epub 2024 Feb 23.

A genome-wide CRISPR screen identifies BRD4 as a regulator of cardiomyocyte differentiation

Affiliations

A genome-wide CRISPR screen identifies BRD4 as a regulator of cardiomyocyte differentiation

Arun Padmanabhan et al. Nat Cardiovasc Res. 2024 Mar.

Abstract

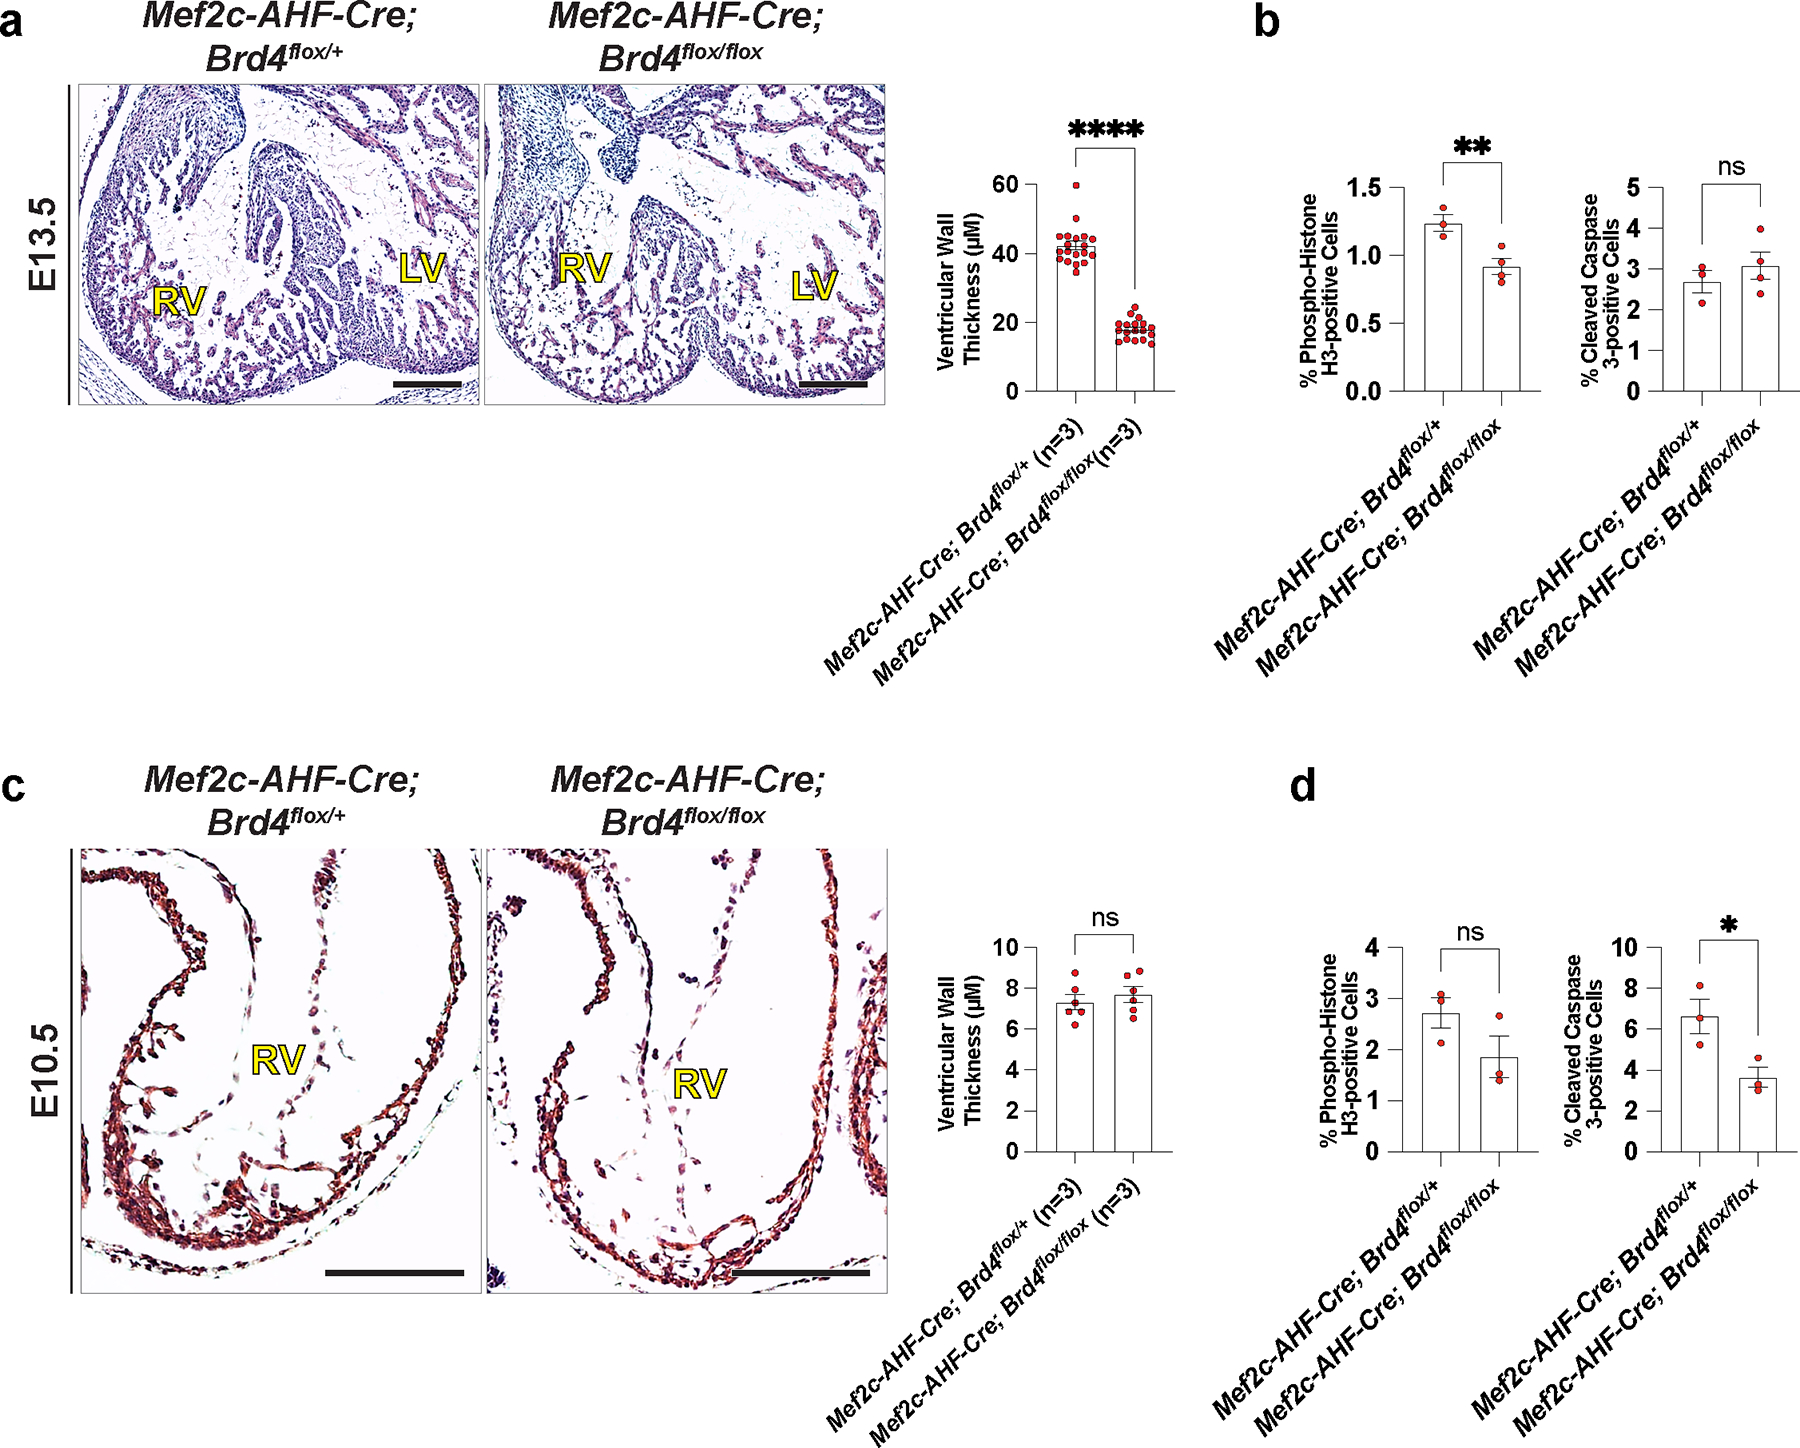
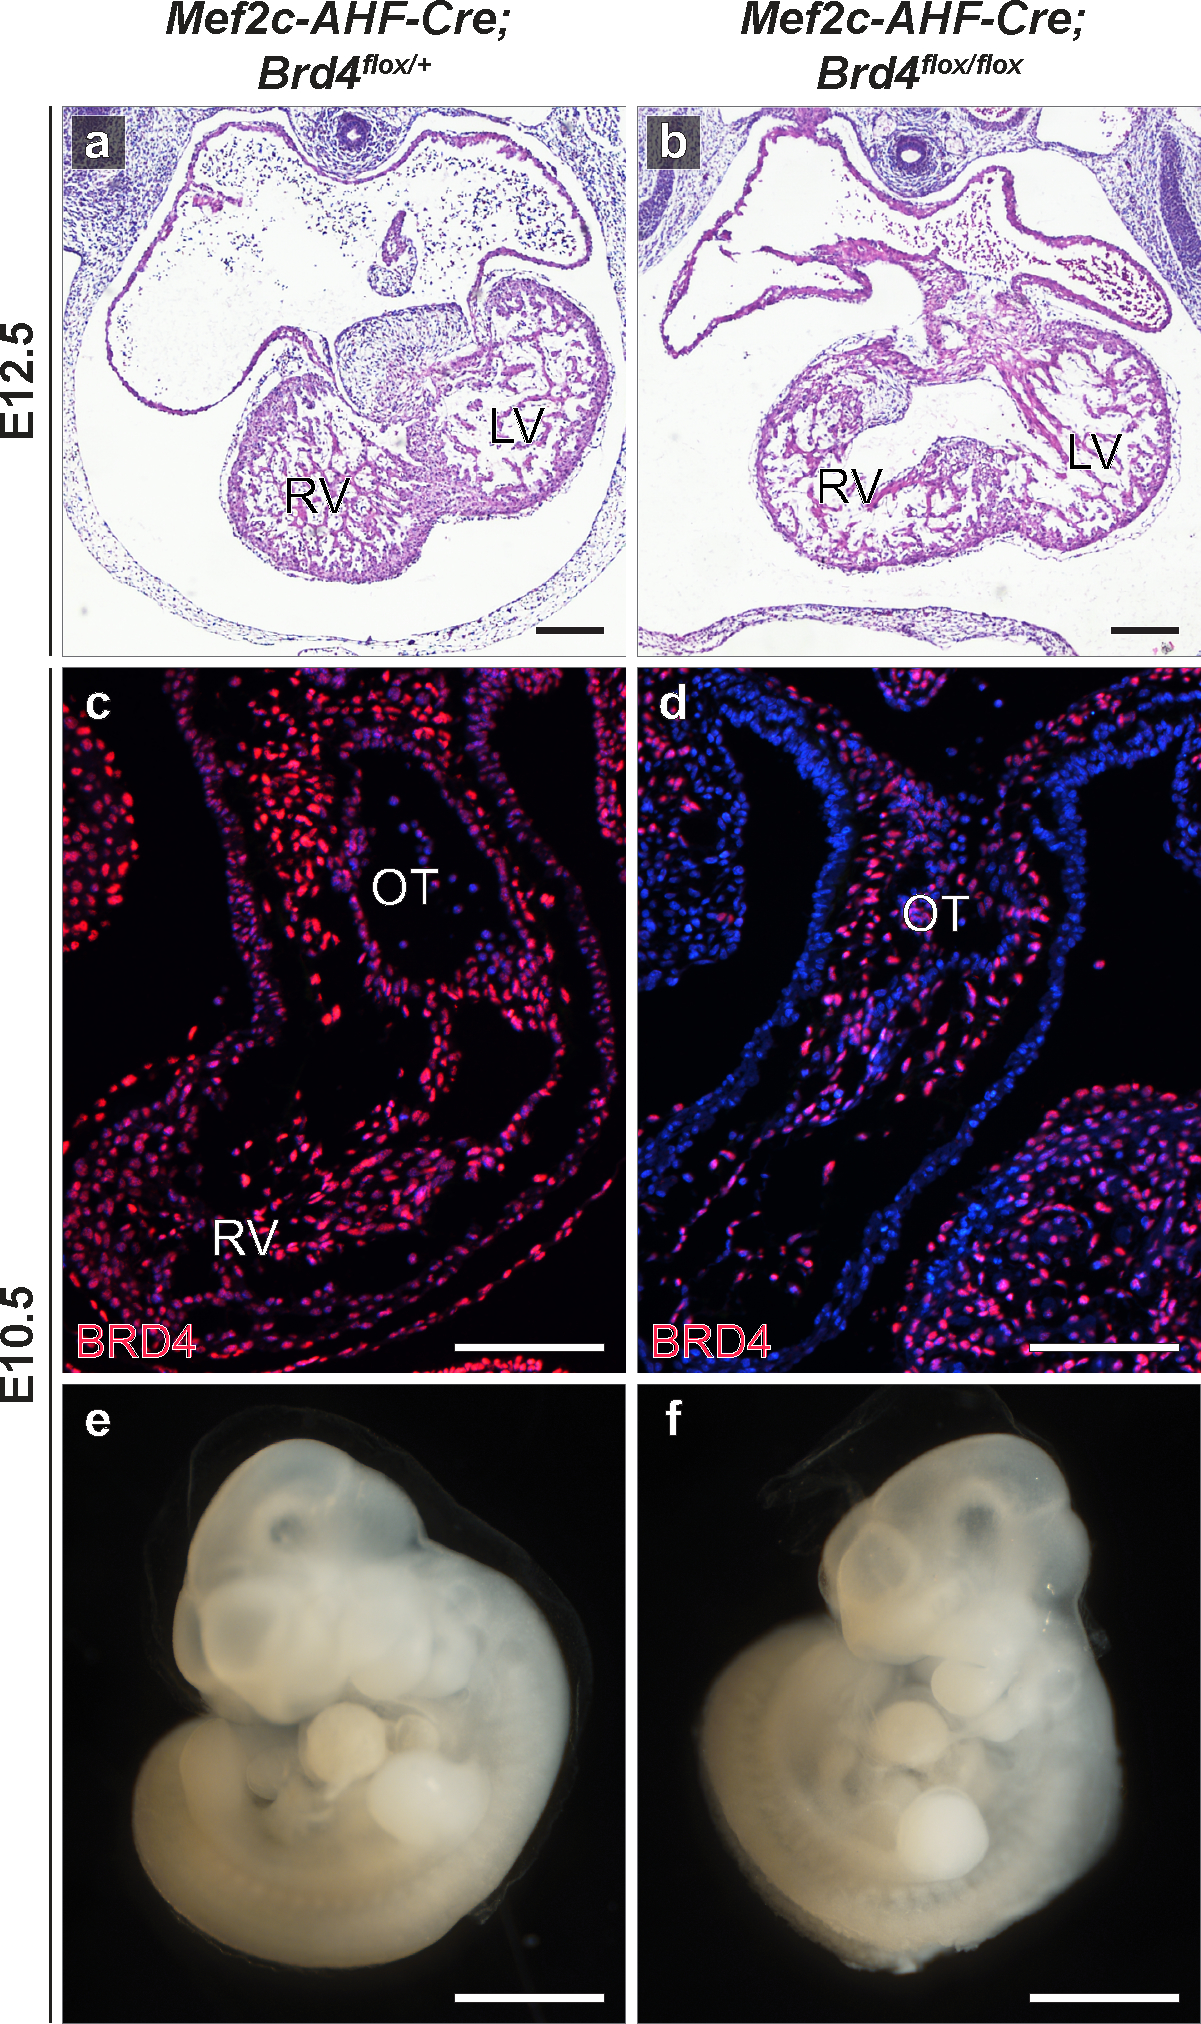
Human induced pluripotent stem cell (hiPSC) to cardiomyocyte (CM) differentiation has reshaped approaches to studying cardiac development and disease. In this study, we employed a genome-wide CRISPR screen in a hiPSC to CM differentiation system and reveal here that BRD4, a member of the bromodomain and extraterminal (BET) family, regulates CM differentiation. Chemical inhibition of BET proteins in mouse embryonic stem cell (mESC)-derived or hiPSC-derived cardiac progenitor cells (CPCs) results in decreased CM differentiation and persistence of cells expressing progenitor markers. In vivo, BRD4 deletion in second heart field (SHF) CPCs results in embryonic or early postnatal lethality, with mutants demonstrating myocardial hypoplasia and an increase in CPCs. Single-cell transcriptomics identified a subpopulation of SHF CPCs that is sensitive to BRD4 loss and associated with attenuated CM lineage-specific gene programs. These results highlight a previously unrecognized role for BRD4 in CM fate determination during development and a heterogenous requirement for BRD4 among SHF CPCs.


Conflict of interest statement

Competing Interests

D.S. is a scientific co-founder, shareholder and director of Tenaya Therapeutics. S.M.H. is an executive, officer and shareholder of Amgen and is a scientific co-founder and shareholder of Tenaya Therapeutics. M.J. is founder, shareholder and executive of Sapient Bioanalytics, LLC. The remaining authors declare no competing interests.

Figures

Extended Data Figure 1:
Extended Data Figure 1:. Integrating a CM differentiation screen and CHD variants.
(a) Top 1000 genes ranked by enrichment or depletion. (b-c) Categorization of top 200 genes enriched (b) or depleted (c) in cardiac myocytes compared to undifferentiated hiPSCs by biological groups. (d-e) Gene ontology (GO) analysis of top enriched (d) or depleted (e) hits (see Methods for details). (f-g) Venn diagrams demonstrating the number of CHD (f) or Non-CHD (g) probands with predicted damaging DNVs in hits identified in our screen as enriching hiPSC:CM differentiation or depleting hiPSC:CM differentiation. Arrows depict Venn diagrams representing the number of probands from each cohort with predicted damaging DNVs identified in our screen that have mutations in known dominant CHD genes or where these candidate CHD genes may potentially be causative. (h) Venn diagram demonstrating the number of CHD probands with (purple) or without (brown) damaging DNVs in hits identified in our screen highlighting no enrichment for extracardiac anomalies (p=0.43) or neurodevelopmental delay (NDD; p=0.23) and a slight enrichment for conotruncal CHD (p=0.04). (i) TNNT2+ cells quantified by flow cytometry at day 10 of hiPSC to CM differentiation in WTC11 cells treated with 100nM JQ1 starting at day 6 (n=3 biologically independent samples). (j) MZ3 treatment (500 nM for 0, 3.5, 7, and 16 hours) effectively degrades BRD4 in SV20 hiPSCs as assessed by immunoblot analysis for BRD4 with β-actin expression as a loading control. In all graphs, error bars represent ±1 SEM. * represents p=0.0271 (two-tailed unpaired t test).
Extended Data Figure 2:
Extended Data Figure 2:. tion or deletion of BRD4 inhibits mESC cardiac differentiation.
Inhibi (a) Expression of Myh6, Nkx2–5, and Tnnt2 at day 7 of mESCs cardiac differentiation treated with JQ1 (100 nM) starting day 5 of differentiation (n=3 biologically independent samples). (b) TNNT2+ cells quantified by flow cytometry at d9 of mESC differentiation in CMV-CreERT2; Brd4flox/flox cells treated with 4-hydroxytamoxifen (TAM), JQ1 (250 nM) or MZ3 (500 nM) starting at day 5 (n=3 biologically independent samples). (c-d) Immunofluorescence of TNNT2 at day 9 of mESC to CM differentiation in wild type cells treated with JQ1 (100 nM) or vehicle starting at day 5. (e-f) Immunofluorescence of BRD4 in vehicle (ethanol, e-e′′) and TAM (f-f′′) treated undifferentiated mESCs. (g) Volcano plot showing RNA-seq from CMV-CreERT2; Brd4flox/flox (TAM vs. vehicle [VEH]) mESCs and gene ontology analysis of downregulated and upregulated genes (see Methods for details). (h) Heatmap showing expression of select transcription factor and muscle structural protein genes from RNA-seq in CMV-CreERT2; Brd4flox/flox (TAM vs. VEH) mESC-derived cardiac tissues (day 10; TAM or VEH added at day 5). In all graphs, error bars represent ±1 SEM. For a, all comparisons are made relative to 0 nM compound for each gene; * represents p<0.0493, ** represents p<0.0085 (two-tailed unpaired t test). For b, all comparisons are made relative to VEH for each condition; * represents p<0.0188 (two-tailed unpaired t test). Scale Bars = 100 μm (c, d, e, e′, e′′, f, f′, f′′)
Extended Data Figure 3:
Extended Data Figure 3:. Loss of BRD4 in Isl1Cre-SHF progenitors in vivo results in myocardial hypoplasia.
(a) Lineage tracing of Isl1Cre/+; Brd4flox/+ and Isl1Cre/+; Brd4flox/flox with R26mTmG/+ allele. Immunohistochemistry of ISL1-derived cells (GFP) and TNNT2 or BRD4 (red) in heart and quantitative assessment of right ventricular myocardial wall thickness in indicated genotypes at E14 (5 sections from n=2 control embryos and 11 sections from n=4 mutant embryos). (b) Hematoxylin and eosin staining of a section through outflow tract and RV of Isl1Cre/+; Brd4flox/+ and Isl1Cre/+; Brd4flox/flox embryos at E12.5 and quantitative assessment of right ventricular myocardial wall thickness in indicated genotypes (10 sections from n=2 control embryos and 11 sections from n=2 mutant embryos). (c) Quantification of percentage phospho-histone H3-, cleaved caspase 3-, and TUNEL-positive cells in the RV of E12.5 and E14.5 embryos of indicated genotypes (n=2 biologically independent samples per genotype at E12.5; n=3–4 biologically independent samples per genotype at E14.5). (d) Hematoxylin and eosin staining of a section through outflow tract and RV of Isl1Cre/+; Brd4flox/+ and Isl1Cre/+; Brd4flox/flox embryos at E10 and quantitative assessment of right ventricular myocardial wall thickness in indicated genotypes (9 sections from n=3 control embryos and 8 sections from n=3 mutant embryos). (e) Quantification of percentage phospho-histone H3- and TUNEL-positive cells in the RV of E10 control (Isl1Cre/+; Brd4flox/+ or Brd4flox/flox) and Isl1Cre/+; Brd4flox/flox embryos (n=4 biologically independent samples per condition). (f) BRD4 and TNNT2 immunohistochemistry along with lineage tracing with R26mTmG/+ allele in Isl1Cre/+; Brd4flox/+ and Isl1Cre/+; Brd4flox/flox E9.5 embryos at level of right ventricle. Error bars represent ±1 SEM. All comparisons are made as indicated; * represents p=0.0091, ** represents p=0.0021, **** represents p<0.0001 (two-tailed unpaired t test). RV, right ventricle; LV, left ventricle; OT, outflow tract. Scale Bars = 100 μm (a, b, d, f)
Extended Data Figure 4:
Extended Data Figure 4:. Loss of BRD4 in Mef2c-AHF-Cre-SHF CPCs in vivo results in right ventricular thinning.
(a) Hematoxylin and eosin staining of a section through outflow tract and RV of Mef2c-AHF-Cre; Brd4flox/+ and Mef2c-AHF-Cre; Brd4flox/flox embryos at E13.5 and quantitative assessment of right ventricular myocardial wall thickness in indicated genotypes (19 sections from n=3 control embryos and 18 sections from n=3 mutant embryos). (b) Quantification of percentage phospho-histone H3- and cleaved caspase 3-positive cells in the RV of E13.5 Mef2c-AHF-Cre; Brd4flox/+ and Mef2c-AHF-Cre; Brd4flox/flox embryos (n=3–4 biologically independent samples per genotype). (c) Hematoxylin and eosin staining of a section through outflow tract and RV of Mef2c-AHF-Cre; Brd4flox/+ and Mef2c-AHF-Cre; Brd4flox/flox embryos at E10.5 and quantitative assessment of right ventricular myocardial wall thickness in indicated genotypes (6 sections from n=3 control embryos and 6 sections from n=3 mutant embryos). (d) Quantification of percentage phospho-histone H3- and cleaved caspase 3-positive cells in the RV of E10.5 Mef2c-AHF-Cre; Brd4flox/+ and Mef2c-AHF-Cre; Brd4flox/flox embryos (n=3 biologically independent samples per genotype). Error bars represent ±1 SEM. All comparisons are made as indicated; * represents p=0.0489, ** represents p=0.0146, **** represents p<0.0001 (two-tailed unpaired t test). RV, right ventricle; LV, left ventricle. Scale Bars = 100 μm (a, c).
Extended Data Figure 5:
Extended Data Figure 5:. Wnt signaling is dysregulated upon BRD4 depletion in CPCs.
(a) Image of Isl1Cre/+; Brd4flox/+ embryo appearing in Figure 2i with region microdissected for bulk RNA-seq highlighted in red. (b) Principal component analysis of RNA-seq from Isl1Cre/+; Brd4flox/+ (blue) and Isl1Cre/+; Brd4flox/flox (red) E9.5 embryos. (c) Volcano plots of E9.5 Isl1Cre/+; Brd4flox/+ vs. Isl1Cre/+; Brd4flox/flox embryonic hearts (same data appearing in Figure 4) with a subset of cardiac and Wnt-related genes annotated (see Methods for details). Isl1Cre/+; Brd4flox/+ (d,f) and Isl1Cre/+; Brd4flox/flox (e,g) E9.5 embryos at level of right ventricle stained with ISL1 (red, d-e), BRD4 (green, d-e), or AXIN2 (green, f-g). Note the expansion of ISL1- (arrow heads) and AXIN2- (dotted line) expressing cells into the RV from distal outflow tract in mutant embryos. (h-m) ISL1 and AXIN2 Immunohistochemistry of E10.5 Mef2c-AHF-Cre; Brd4flox/+ (h,k) and Mef2c-AHF-Cre; Brd4flox/flox (i,j,l,m) embryos at the level of outflow tract. (h-j, ISL1; k-m, AXIN2). Note the expansion of ISL1- (arrow heads) and AXIN2- (dotted line) expressing cells into the right ventricle from distal outflow tract in mutant embryos. (n-o) AXIN2 RNAscope of Brd4flox/flox (n,n′) and Isl1Cre/+; Brd4flox/flox (o,o′) E9.5 embryos at the level of the right ventricle (n′ and o′ are magnified images of n and o, respectively). (p-q) ISL1 representative immunofluorescence at day 8 of mESC-derived cardiac cultures treated with vehicle (DMSO; VEH) (p) or JQ1 (500 nM) (q) starting at day 5. (r) Isl1 expression in day 8–9 mESC-derived cardiac cultures treated with increasing doses of JQ1 (0–500 nM; JQ1 added at day 5; n=3 n=3 biologically independent samples per dose). (s-t) AXIN2 RNAscope of Mef2c-AHF-Cre; Brd4flox/+ (s,s′) and Mef2c-AHF-Cre; Brd4flox/flox (t,t′) E10.5 embryos at level of right ventricle (s′ and t′ are magnified images of s and t, respectively). For r, all comparisons are made relative to 0 nM compound. *** represents p=0.0007 (two-tailed unpaired t test). RV, right ventricle; OT, outflow tract. Scale Bar = 250 μm (a), 50 μm (d-m, n, o, s, t), 100 μm (p, q, n′, o′, s′, t′)
Extended Data Figure 6:
Extended Data Figure 6:. BRD4 regulates Wnt signaling during CM differentiation.
(a) Attenuating Wnt signaling at the CPC stage (day 5) in mESC to CM differentiation by doubling the normal concentration of the small molecule Wnt inhibitor XAV939 concomitant with Brd4 genetic deletion by 4-hydroxytamoxifen treatment (TAM) in CMV-CreERT2; Brd4flox/flox mESCs partially normalizes expression of CPC markers and Msx1/2 by qRT-PCR (n=3–4 biologically independent samples per genotype). (b-e) Attenuating Wnt signaling at the CPC stage (day 5) in mESC to CM differentiation by doubling the normal concentration of the small molecule Wnt inhibitor XAV939 concomitant with Brd4 genetic deletion by 4-hydroxytamoxifen treatment (TAM) in CMV-CreERT2; Brd4flox/flox mESCs partially normalizes TNNT2 staining by immunofluorescence at day 9 of CM differentiation (for e, n=3 biologically independent samples per condition). (f,g) Attenuation of Wnt signaling at the CPC stage (day 6) in hiPSC to CM differentiation by addition of the small molecule Wnt inhibitor IWP4 (5 μM for low dose and 10 μM high dose) concomitant with BET inhibition using JQ1 (25 nM for low dose and 50 nM for high dose) increases the number of TNNT2+ cells as assessed by flow cytometry (n=3 biologically independent samples per condition). Error bars represent ±1 SEM. For a,e,f,g all comparisons are made with p values as indicated (two-way ANOVA with Tukey’s multiple comparisons test).
Extended Data Figure 7:
Extended Data Figure 7:. Generation of BRD4FLAG/FLAG hiPSC line and BRD4 occupancy in cardiac progenitor cells.
(a) Targeting strategy to introduce 3XFLAG epitope tag into the N-terminus of the endogenous BRD4 locus. (b) Karyotyping results of BRD4FLAG/FLAG hiPSC line. (c) Western blot analysis of protein lysates collected from BRD4FLAG/FLAG hiPSCs using FLAG antibody demonstrates expression of 3XFLAG-tagged BRD4 isoforms that are degraded upon addition of the PROTAC BET degrader dBET651. (d) Pearson correlation matrices demonstrating high reproducibility between replicate CUT&RUN datasets. (e-g) Track view of indicated loci showing CUT&RUN factor occupancy (FLAG, BRD4, H3K4Me3) or H3K27Ac ChIP-seq enrichment in hiPSC-derived CPCs.
Extended Data Figure 8:
Extended Data Figure 8:. Iterative filtering steps for selection of cells analyzed in scRNA-seq.
(a-c) UMAP plots of all cells (n=23,592) collected from the microdissected heart and surrounding pharyngeal mesoderm (n=2 embryos per genotype) (a), labeled by sample identity (b), and number of features (c). (d) Feature plots for expression of example marker genes used to define cell types (e.g., Hbb-y for blood cells; Dlx2, Dlx5, and Twist1 for neural crest cells; Lhx2 and Foxc2 for branchiomeric muscle progenitors; Epcam for endoderm). (e-g) UMAP plots demonstrate expression of the Cre transgene (e) occurs in clusters marked by high Mef2c (f) and Isl1 (g) expression, consistent with Cre driven in Mef2c-expressing second heart field cells. (h) Clusters of Cre expressing cells detected at E9.5 in our scRNA-seq dataset selected for further analysis (n=4,640). (i) Feature plot for Cre expression in a UMAP of cells from (h) following normalization and reclustering. (h’-i’) Cluster 0 cells highlighted in red on UMAP plots from h and i.
Extended Data Figure 9:
Extended Data Figure 9:. Pathway analysis of differentially expressed genes by cluster.
Pathway analysis of differentially expressed genes between mutant (Mef2c-AHF-Cre; Brd4flox/flox) and control (Brd4flox/flox) embryos by cluster for each cellular population identified in our scRNA-seq studies (see Methods for details).
Extended Data Figure 10:
Extended Data Figure 10:. BRD4 loss increases MSX1- and MSX2-positive cells in vivo.
Mef2c-AHF-Cre; Brd4flox/+ (a) and Mef2c-AHF-Cre; Brd4flox/flox (b,c) E10.5 embryos at level of right ventricle stained with MSX1/2 (yellow); inset shows area indicated by arrowheads. RNAscope in Brd4flox/flox (d,e), Isl1Cre/+; Brd4flox/flox (f,g), Mef2c-AHF-Cre; Brd4flox/+ (h,i), and Mef2c-AHF-Cre; Brd4flox/flox (j,k) E9.5–10.5 embryos at level of right ventricle for MSX1 (d,f,h,j) or MSX2 (e,g,i,k). Regions in yellow boxes in d-k are shown in higher magnification in d′-k′. RV, right ventricle; OT, outflow tract. Scale Bars = 50 μm (a-c, d-k), 165 μm (d′, e′, f′, g′), 125 μm (h′, j′), 200 μm (i′, k′)
Fig. 1:
Fig. 1:. A pooled CRISPR screen identifies BRD4 as a regulator of cardiogenesis.
a, Schematic representation of screen. b, Hits for chromatin-associated proteins ranked by fold enrichment in CMs compared to hiPSCs. c, Hits for chromatin-associated proteins ranked by P value (see Methods for details). d, Expression of MYH6, NKX2–5 and TNNT2 at day 12 of cardiac differentiation (JQ1 or MZ3 added at day 6 corresponding to the CPC stage; JQ1 concentrations: 0, 25, 100, 250 nM; MZ3: 0, 200, 500 nM (n = 4–6 biologically independent samples)). In all graphs, error bars represent ±1 SEM. For d, all comparisons are made relative to 0 nM compound for each gene; *P < 0.0248, **P < 0.0048, ***P < 0.002, ****P < 0.0001 (two-tailed unpaired t-test).
Fig. 2:
Fig. 2:. Brd4 deletion in ISL1+ progenitors in vivo results in myocardial hypoplasia.
a-h, H&E staining (a,e) and immunohistochemistry (b-d, f-h) of Isl1Cre/+; Brd4flox/+ (b-d) and Isl1Cre/+; Brd4flox/flox (f-h) E14.5 hearts. Immunohistochemistry of Tnnt2 (red) and BRD4 (green). i,j, Isl1Cre/+; Brd4flox/+ (i,i′) and Isl1Cre/+; Brd4flox/flox (j,j′) E9.5 embryos. Regions in yellow boxes in i and j are shown in higher magnification in i′ and j′. k,l, H&E staining of a section through OFT and RV of Isl1Cre/+; Brd4flox/+ (k,k′) and Isl1Cre/+; Brd4flox/flox (l,l′) E9.5 embryos. Regions in yellow boxes in k and l are shown in higher magnification in k′ and l′. Scale bars, 200 μm (a,b,e,f), 100 μm (c,d,g,h,k,l), 250 μm (i,i′,j,j′) and 25 μm (k′,l′),
Fig. 3:
Fig. 3:. Brd4 deletion in SHF progenitors in vivo recapitulates loss in ISL1+ progenitors.
a,b, H&E staining of Mef2c-AHF-Cre; Brd4flox/+ (a) and Mef2c-AHF-Cre; Brd4flox/flox (b) E12.5 hearts. Note the RV hypoplasia in the mutant compared to control. c,d, Immunohistochemistry of BRD4 in Mef2c-AHF-Cre; Brd4flox/+ (c) and Mef2c-AHF-Cre; Brd4flox/flox (d) E10.5 OFTs. e,f, Mef2c-AHF-Cre; Brd4flox/+ (e) and Mef2c-AHF-Cre; Brd4flox/flox (f) E10.5 embryos. Scale bars, 100 μm (a-d) and 250 μm (e,f)
Fig. 4:
Fig. 4:. Loss of BRD4 in vivo attenuates cardiac differentiation-related gene expression.
a, Volcano plot of E9.5 Isl1Cre/+; Brd4flox/+ versus Isl1Cre/+; Brd4flox/flox embryonic hearts ranked by P value (see Methods for details). b, GO analysis of top downregulated and upregulated genes (see Methods for details). c, Heat map showing expression of CM function and Wnt-related genes at E9.5 (see Methods for details).
Fig. 5:
Fig. 5:. BRD4 is enriched at transcriptionally active regions of chromatin marked by H3K4Me3.
a, Heat maps showing enrichment of FLAG, BRD4 and H3K4Me3 CUT&RUN signals and H3K27Ac ChIP-seq enrichment from hiPSC-derived CPCs at day 6 ordered by FLAG intensity. b, Venn diagrams and table demonstrating co-occupancy of BRD4/FLAG and indicated histone modification (percentage of BRD4 peaks overlapping with indicated histone modification). c,d, Track view of AXIN2 (c) and CCND1 (d) loci showing indicated CUT&RUN factor occupancy or H3K27Ac ChIP-seq enrichment in hiPSC-derived CPCs. e, Metaplot demonstrating FLAG occupancy at genes associated with GO terms for Wnt signaling or contractility. ChIP-seq, chromatin immunoprecipitation followed by sequencing.
Fig. 6:
Fig. 6:. BRD4 specifically regulates an MSX1/2+ progenitor population.
a-c, UMAP plots of single-cell gene expression of Brd4flox/flox (n = 2) and Mef2c-AHF-Cre; Brd4flox/flox (n = 2) embryos visualized by genotype (a), sample identity (b), or cluster identity (c). d, Gene expression analysis of single-cell data. Heat map shows genes most enriched in each cluster and their inferred identity. e, Violin plots showing gene expression of critical regulators in select clusters. f, Percentage of cells in each cluster in each genotype highlighting the expansion of cluster 0 (MSX1/2+ progenitors) upon BRD4 deletion. g,h, Multiple lineage and pseudotime trajectory inference of cells from control (Brd4flox/flox) (g) and mutant (Mef2c-AHF-Cre; Brd4flox/flox) (h) embryos. i, Proposed model for BRD4 action in SHF CPCs: BRD4 is critical for CM differentiation in a subset of SHF CPCs, with its loss leading to persistence of Wnt-activated, ISL1+, and MSX1/2+ CPCs. A, atrium; pSHF, posterior second heart field.

Comment in

References

    1. Van Der Linde D, Konings EEM & Slager M. a., Witsenburg M, Helbing W. a., Takkenberg JJM & Roos-Hesselink JW Birth prevalence of congenital heart disease worldwide: A systematic review and meta-analysis. J. Am. Coll. Cardiol. 58, 2241–2247 (2011). - PubMed
    1. Jin SC et al. Contribution of rare inherited and de novo variants in 2,871 congenital heart disease probands. Nat. Genet. 49, 1593–1601 (2017). - PMC - PubMed
    1. Pierpont ME et al. Genetic Basis for Congenital Heart Disease: Revisited: A Scientific Statement From the American Heart Association. Circulation 138, e653–e711 (2018). - PMC - PubMed
    1. de Soysa TY et al. Single-cell analysis of cardiogenesis reveals basis for organ-level developmental defects. Nature 572, 120–124 (2019). - PMC - PubMed
    1. Homsy J et al. De novo mutations in congenital heart disease with neurodevelopmental and other congenital anomalies. Science 350, 1262–1266 (2015). - PMC - PubMed

Publication types

MeSH terms