. 2024 Mar;3(3):356-371.
doi: 10.1038/s44161-024-00448-6. Epub 2024 Mar 11.

Kupffer cells dictate hepatic responses to the atherogenic dyslipidemic insult

Affiliations

Kupffer cells dictate hepatic responses to the atherogenic dyslipidemic insult

Giada Di Nunzio et al. Nat Cardiovasc Res. 2024 Mar.

Abstract

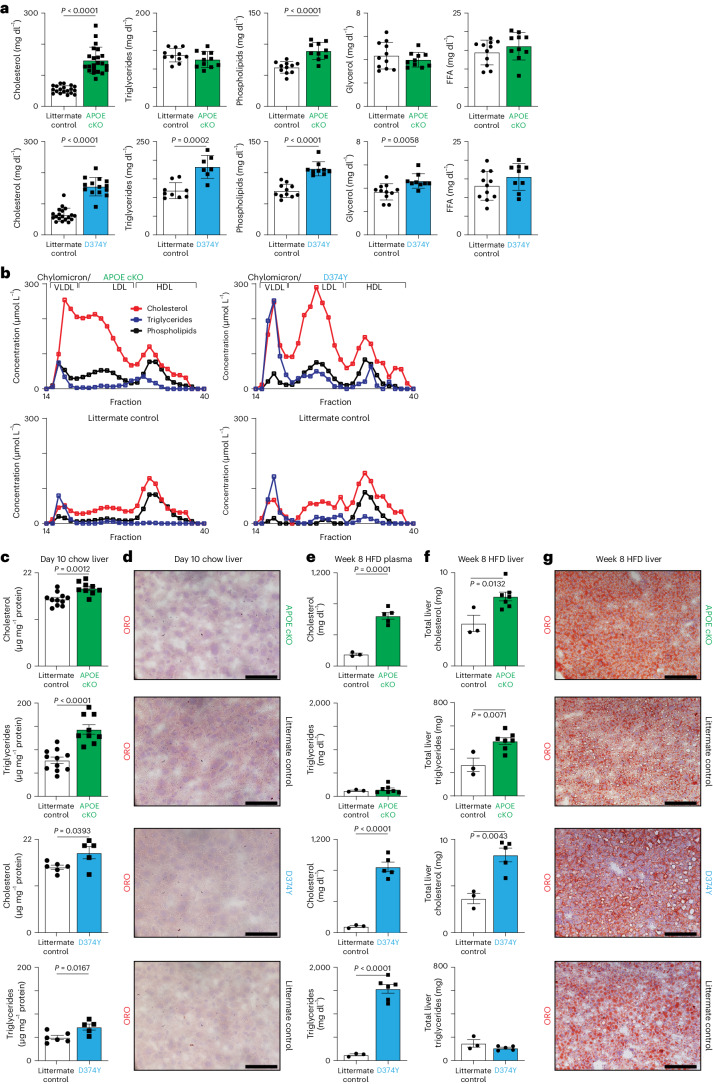
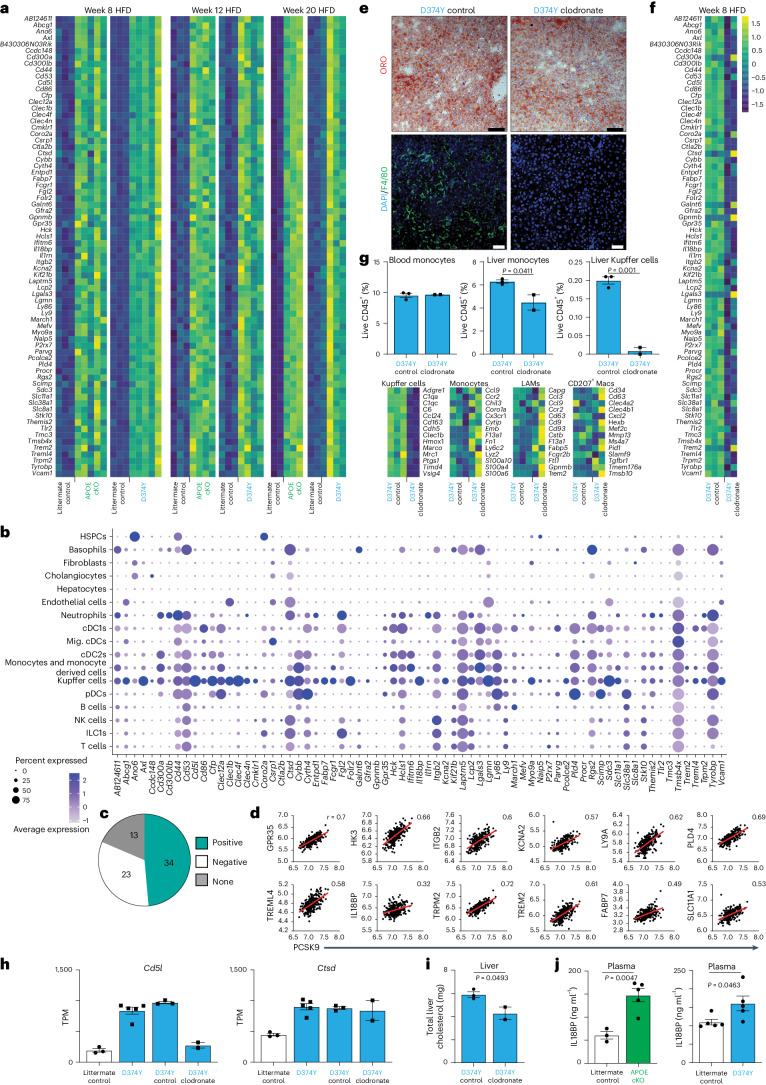
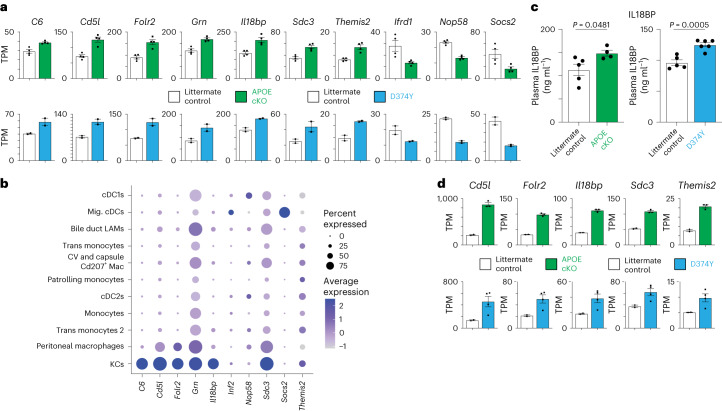
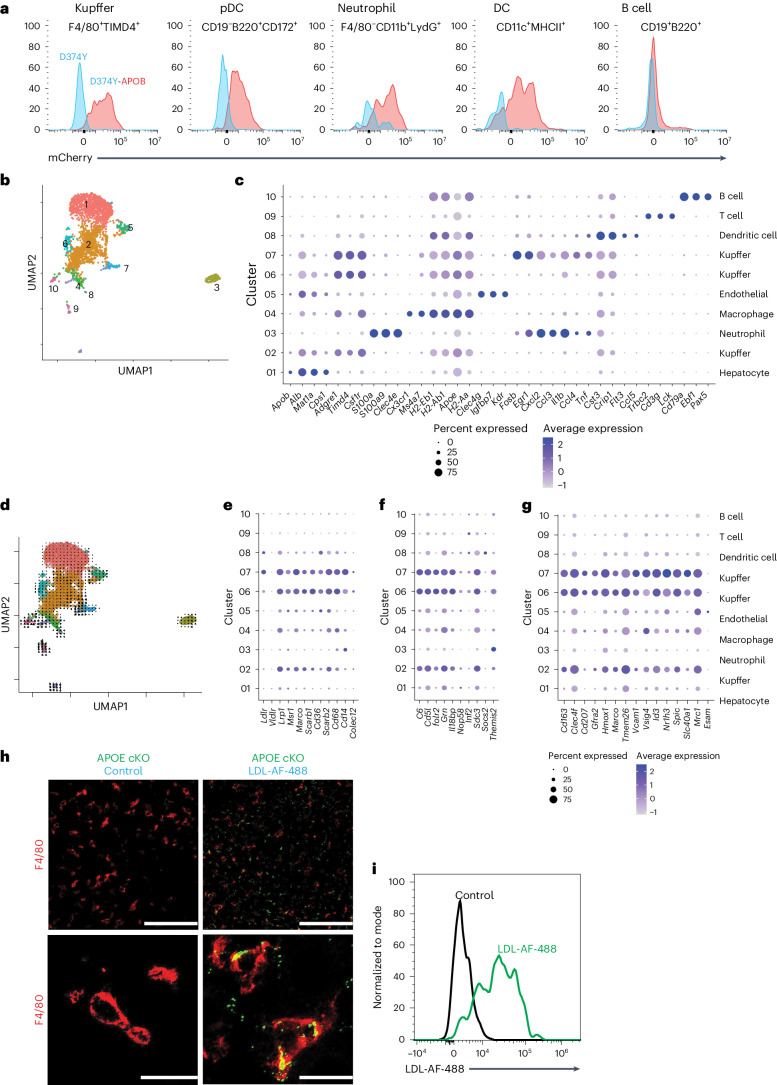
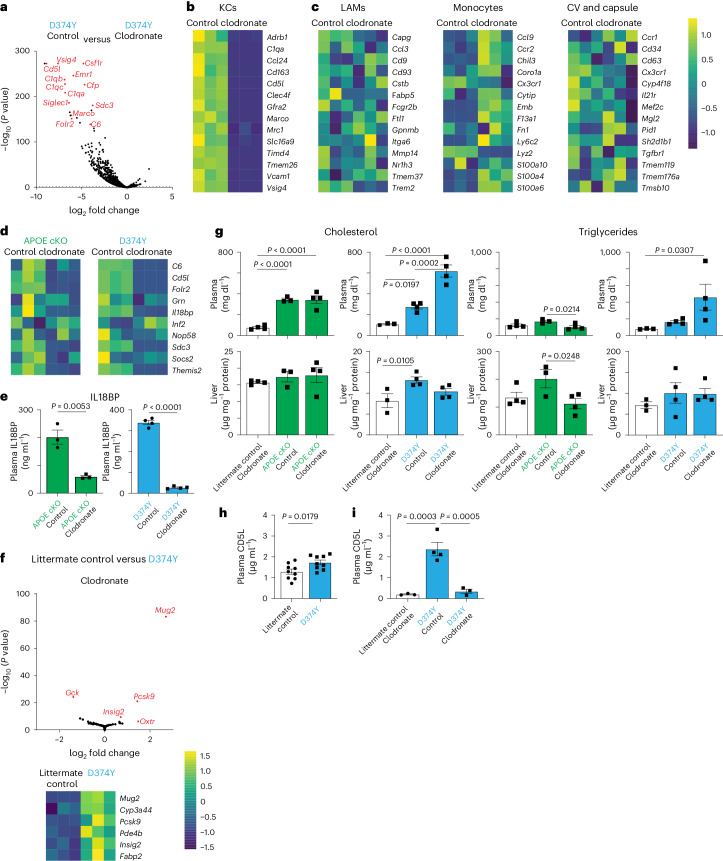
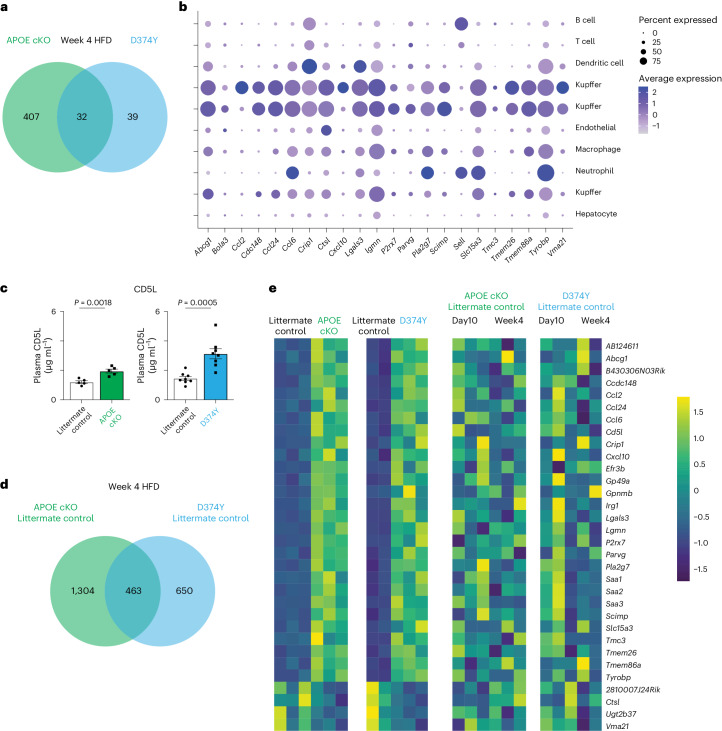
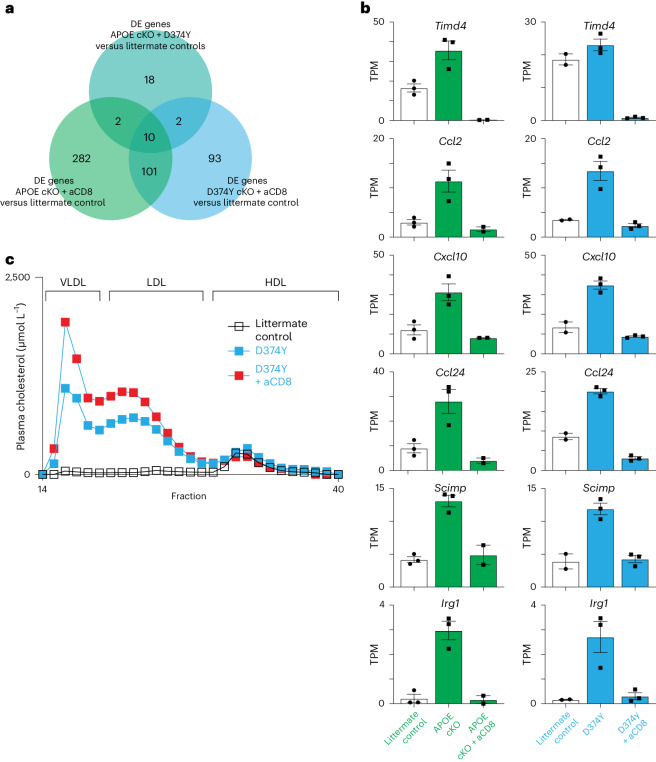
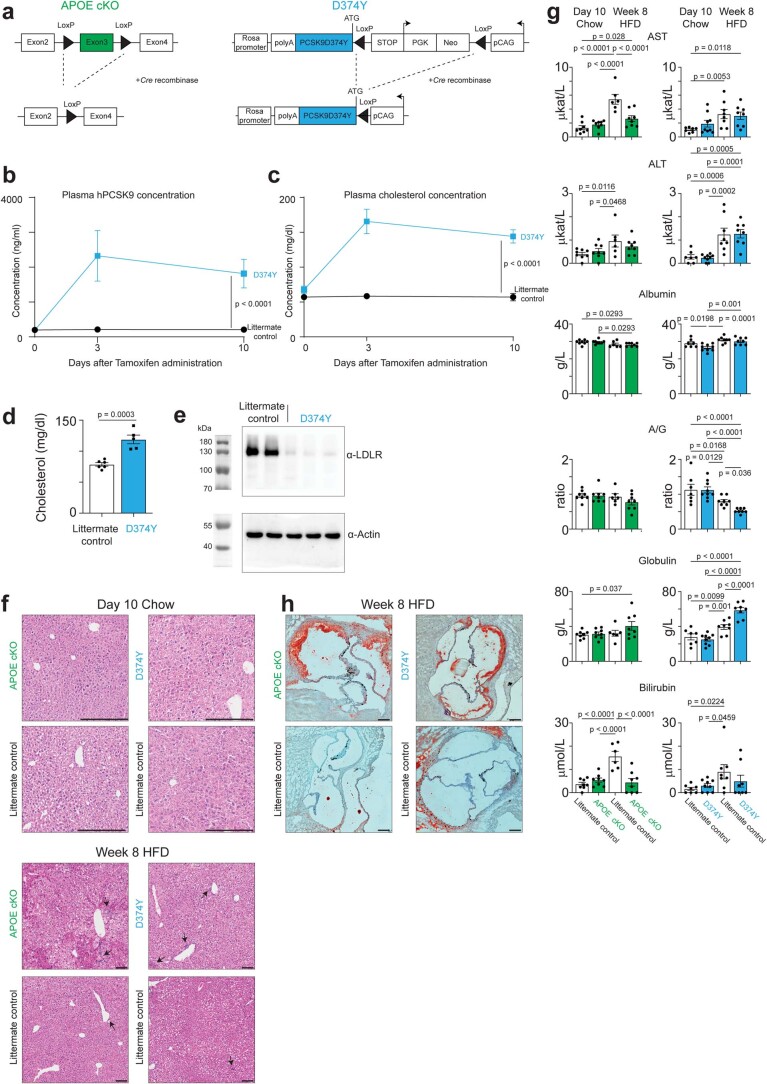
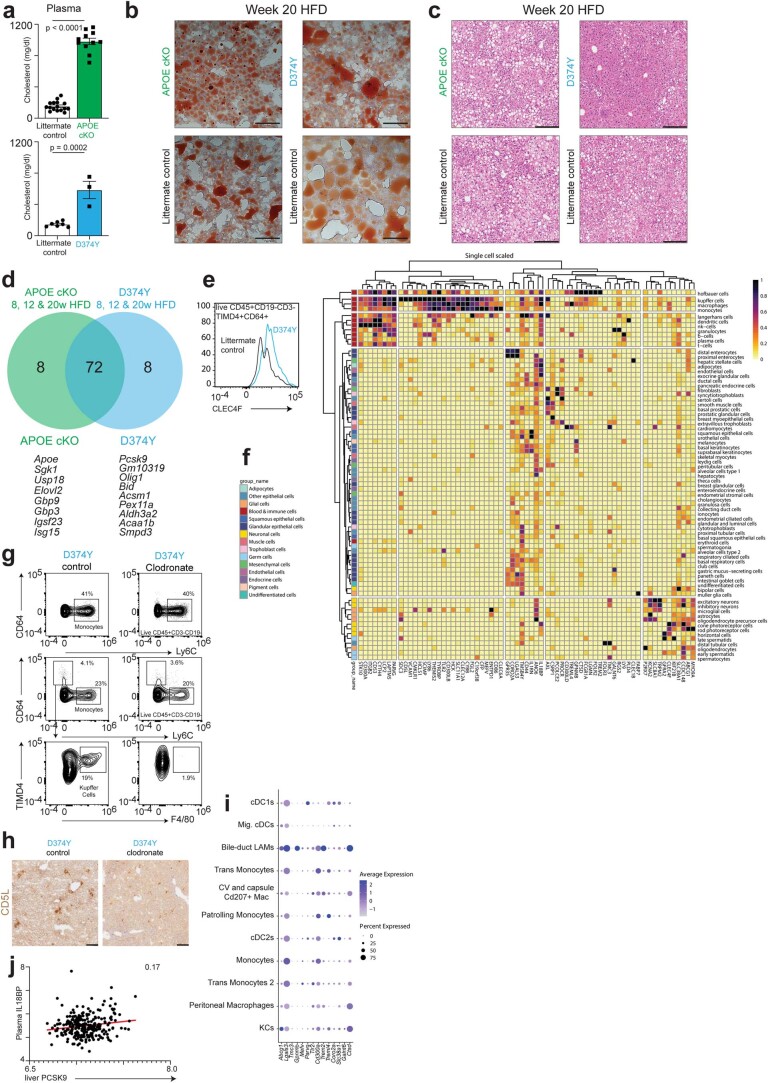
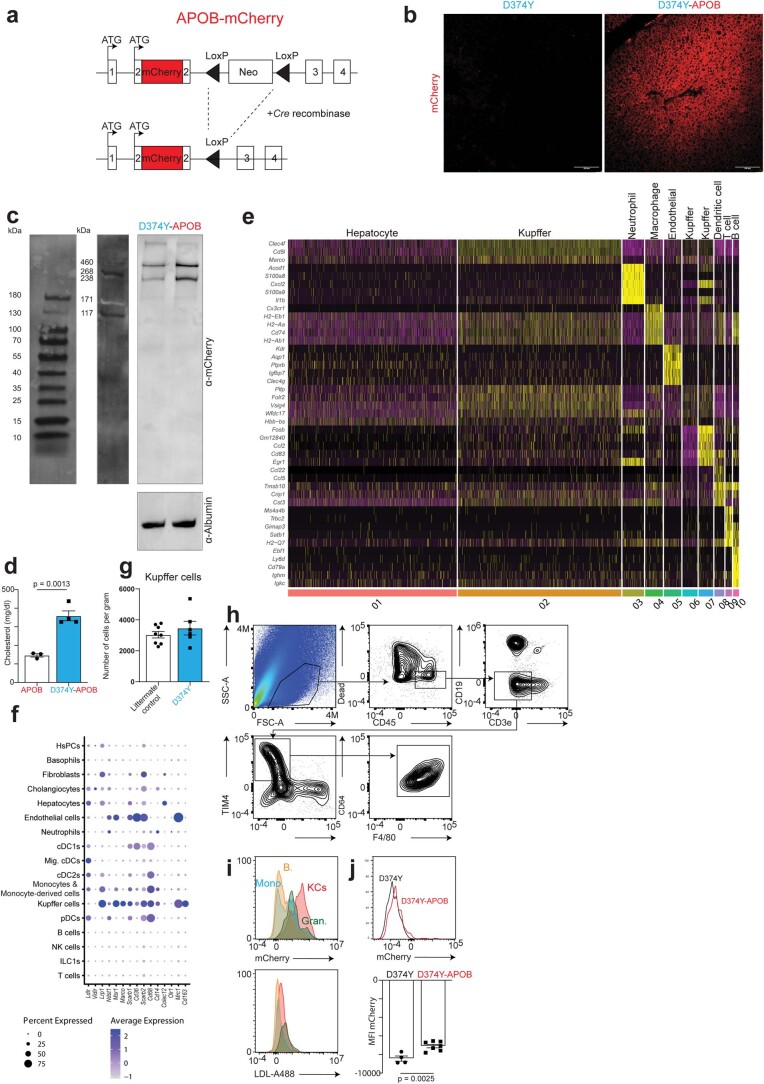
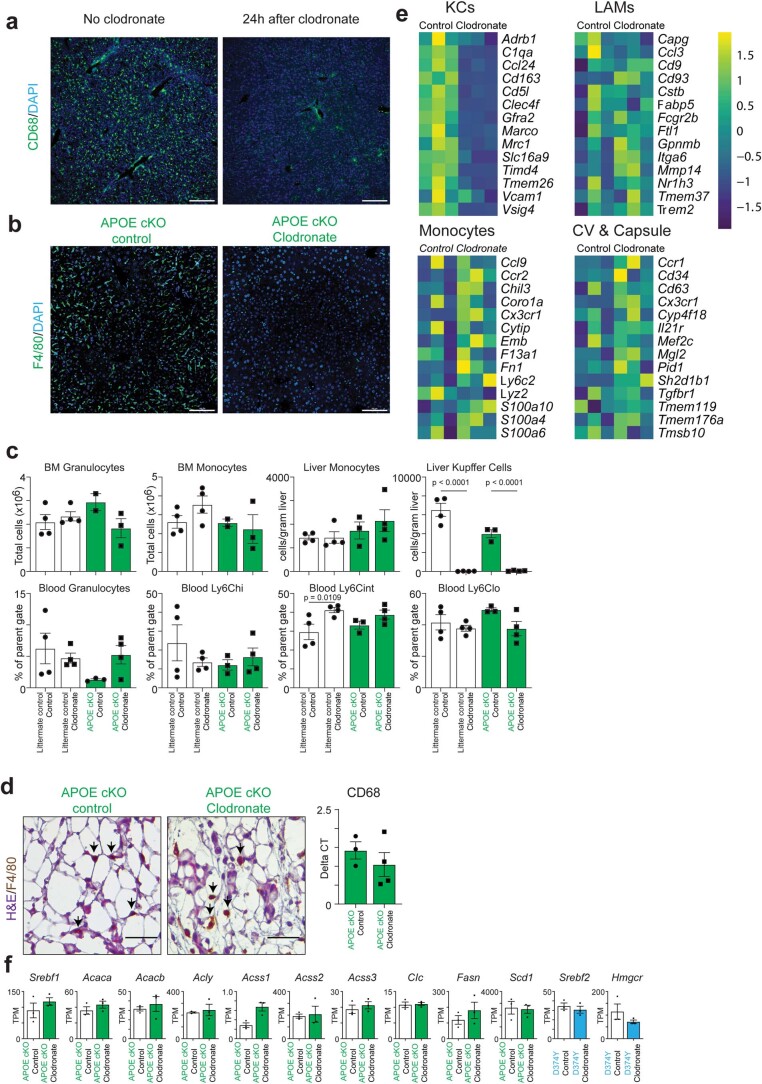
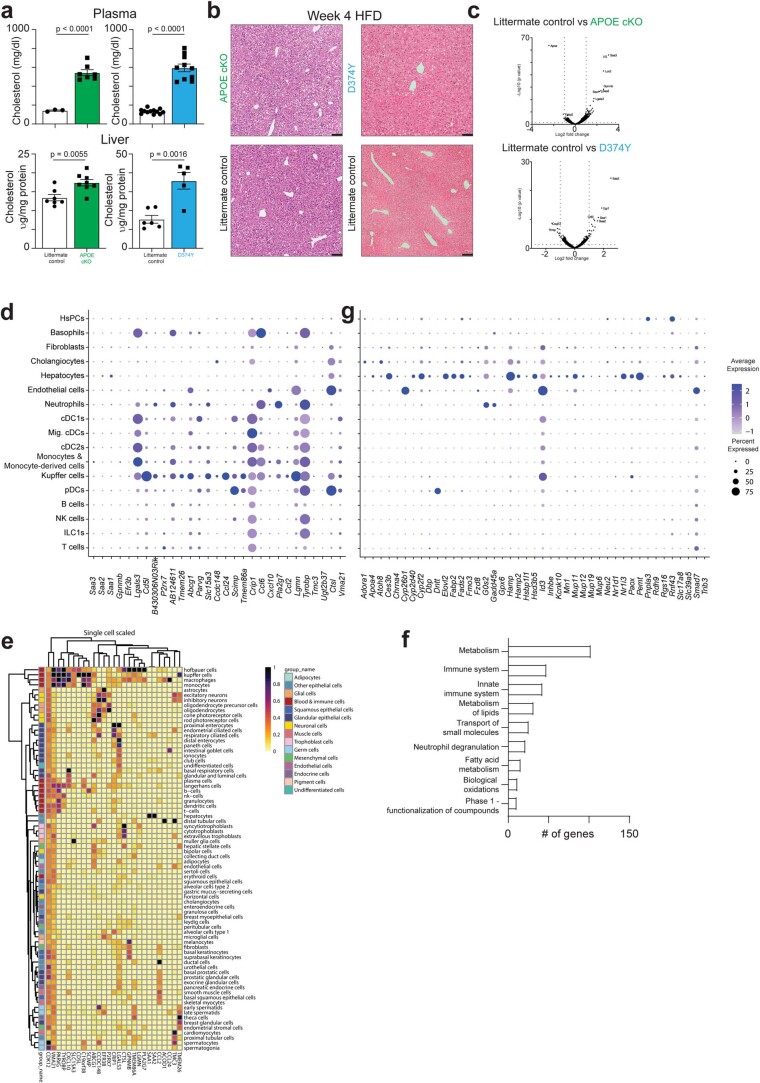
Apolipoprotein-B (APOB)-containing lipoproteins cause atherosclerosis. Whether the vasculature is the initially responding site or if atherogenic dyslipidemia affects other organs simultaneously is unknown. Here we show that the liver responds to a dyslipidemic insult based on inducible models of familial hypercholesterolemia and APOB tracing. An acute transition to atherogenic APOB lipoprotein levels resulted in uptake by Kupffer cells and rapid accumulation of triglycerides and cholesterol in the liver. Bulk and single-cell RNA sequencing revealed a Kupffer-cell-specific transcriptional program that was not activated by a high-fat diet alone or detected in standard liver function or pathological assays, even in the presence of fulminant atherosclerosis. Depletion of Kupffer cells altered the dynamic of plasma and liver lipid concentrations, indicating that these liver macrophages help restrain and buffer atherogenic lipoproteins while simultaneously secreting atherosclerosis-modulating factors into plasma. Our results place Kupffer cells as key sentinels in organizing systemic responses to lipoproteins at the initiation of atherosclerosis.


Conflict of interest statement

The authors declare no competing interests.

Figures

Fig. 1
Fig. 1. Development of mouse models for inducible APOB lipoprotein dyslipidemia.
a, Plasma lipid levels 10 d after tamoxifen administration in APOE cKO (green bars) and D374Y (blue bars) strains together with respective littermate controls in male and female mice fed normal chow (Cholesterol: n = 22 APOE cKO and n = 19 littermate control mice; n = 14 D374Y and n = 19 littermate control mice. Triglycerides: n = 11 APOE cKO and n = 11 littermate control mice; n = 7 D374Y and n = 9 littermate control mice. PLs: n = 10 APOE cKO and n = 11 littermate control mice; n = 9 D374Y and n = 11 littermate control mice. Glycerol: n = 10 APOE cKO and n = 11 littermate control mice; n = 9 D374Y and n = 11 littermate control mice. FFA: n = 10 APOE cKO and n = 11 littermate control mice; n = 9 D374Y and n = 11 littermate control mice). b. Plasma lipoprotein fractionation profiles (µmol L−1) at 10 d after tamoxifen dosing. All curves were calculated as an average of two separately run plasma pools from male and female mice (plasma from 4–6 mice in each pool). c, Cholesterol and triglyceride measurements (µg mg−1 of protein) after liver Folch extraction from male and female mice (Cholesterol: n = 9 APOE cKO and n = 11 littermate control mice; n = 5 D374Y and n = 6 littermate control mice. Triglycerides: n = 9 APOE cKO and n = 11 littermate control mice; n = 5 D374Y and n = 6 littermate control mice). d, Representative pictures of liver section stained with ORO in APOE cKO and D374Y mice with respective littermate controls 10 d after dyslipidemia induction (scale bar, 100 μm). e, Circulating cholesterol and triglycerides (mg dl−1) measured in dyslipidemic APOE cKO, D374Y and respective littermate controls after 8 weeks on an HFD (Cholesterol: n = 5 APOE cKO and n = 3 littermate control mice; n = 5 D374Y and n = 3 littermate control mice. Triglycerides: n = 7 APOE cKO and n = 3 littermate control mice; n = 6 D374Y and n = 3 littermate control mice). f, Hepatic cholesterol and triglyceride levels measured as total liver cholesterol (mg) and total liver triglycerides (mg) in APOE cKO and D374Y with respective littermate controls (Cholesterol: n = 7 APOE cKO and n = 3 littermate control mice; n = 5 D374Y and n = 3 littermate control mice. Triglycerides: n = 7 APOE cKO and n = 3 littermate control mice; n = 5 D374Y and n = 3 littermate control mice). g, ORO representative liver sections of dyslipidemic APOE cKO and D374Y littermate control mice after 8 weeks on an HFD (scale bar, 100 μm). All plots are ±s.e.m. except 1a (±s.d.). For statistical analysis, a two-sided t-test was used (a,c,e,f). FFA, free fatty acid; VLDL, very-low-density lipoprotein. Source data
Fig. 2
Fig. 2. The transcriptional response of the liver to sustained dyslipidemia.
a, Heat maps of bulk mRNA-seq of whole liver showing the 72 significant differentially expressed genes common to both dyslipidemic strains versus respective littermate controls after 8 weeks, 12 weeks and 20 weeks on an HFD (n = 2–5). b, Expression of the 72 conserved genes in liver cells using clusters taken from ref. . c, Pie chart showing how expression of the 72 conserved genes correlates with PCSK9 transcript levels in human liver samples (n = 261). d, Correlations with human PCSK9 levels for 12 of the 34 positively correlating genes from c. e, Representative ORO liver sections (top) and confocal images of F4/80 immunofluorescence (bottom) in the livers of D374Y dyslipidemic mice treated with clodronate liposomes and Dil liposomes (control) for 8 weeks while on an HFD (scale bar, 100 μm; n = 2 D3747 control and n = 2 D3747 clodronate, where every n represents a different mouse). f, Effect of long-term administration of clodronate liposomes on the 72 differentially expressed genes (n = 2–3). g, Top, percentages of blood and liver monocytes (live CD45+CD19CD3eCD64Ly6C+) and liver KCs (live CD45+CD19CD3eCD64+Ly6CF4/80+TIM4+) in D374Y dyslipidemic mice after 8 weeks of treatment with clodronate liposomes (n = 2 D374Y clodronate and n = 3 D374Y control mice). Bottom, heat maps showing variations in the expression of signature genes for KCs, monocytes, LAMs and CD207+ macrophages in the liver of D374Y mice after long-term clodronate exposure (n = 2 D374Y clodronate and n = 3 D374Y control mice). h, Transcript per million values for a clodronate-sensitive gene (Cd5l) and a clodronate-insensitive gene (Ctsd) from D374Y and littermate control and D374Y treated with Dil liposomes or clodronate liposomes (n = 3 littermate control, n = 5 D374Y, n = 3 D374Y control and n = 2 D374Y clodronate mice). i, Total liver cholesterol (mg) in D374Y dyslipidemic mice treated with either clodronate liposomes or Dil liposomes for 8 weeks while on an HFD (n = 2 D374Y clodronate and n = 3 D374Y control mice). j, Plasma levels of IL18BP (ng ml−1) after 8 weeks on an HFD in dyslipidemic APOE cKO and D374Y mice versus respective littermate controls (n = 5 APOE cKO and n = 3 littermate control mice; n = 5 D374Y and n = 5 littermate control mice). All plots are ±s.e.m. Two-sided t-test (g,i,j). cDC, conventional dendritic cell; HSPC, hematopoietic stem and progenitor cell; ILC, innate lymphoid cell; Macs, macrophages; Mig., migratory; NK, natural killer; pDC, plasmacytoid dendritic cell.
Fig. 3
Fig. 3. A conserved KC response at the initiation of acute APOB dyslipidemia.
a, Transcript per million (TPM) as determined by mRNA-seq for the 10 differentially expressed genes common to both APOE cKO (n = 4 versus n = 4) and D374Y (n = 2 versus n = 2) 10 d after tamoxifen treatment. b, Expression of the conserved day 10 differentially expressed genes in myeloid cell clusters generated according to ref. c, Secreted IL18BP (ng ml−1) in APOE cKO and D374Y versus respective littermate controls 10 d after tamoxifen administration (n = 4 APOE cKO and n = 5 littermate control mice; n = 6 D374Y and n = 5 littermate control mice). d, TPM values for five of the 10 conserved genes whose upregulation is maintained after 20 weeks on an HFD (n = 3 APOE cKO and n = 2 littermate control mice; n = 4 D374Y and n = 2 littermate control mice). All plots are ±s.e.m. Two-sided t-test (c). cDC, conventional dendritic cell; Mac, macrophage; Mig., migratory.
Fig. 4
Fig. 4. Monitoring uptake of atherogenic lipoproteins through in vivo labeling of APOB lipoproteins.
a, Flow cytometry from immune cells extracted from the liver revealing mCherry expression in male D374Y mCherry-APOB (D374Y-APOB) or D374Y mice alone. Cells were gated as indicated above each histogram. b, UMAP plot indicating clusters from scRNA-seq of liver female CD45+mCherry+ cells. c, Dot plot for identity markers from clusters 1–10. d, RNA velocity analysis of the scRNA-seq data. e, Expression of receptors capable of APOB lipoprotein uptake in clusters 1–10. f, Identification of cell clusters expressing the day 10 conserved genes. g, Expression of core KC identity genes within each cluster. All experiments were conducted on day 10 after tamoxifen treatment, and mice were maintained on a normal chow diet. h, Representative confocal images of F4/80 (red) and AF-488-labeled LDL (green) in liver sections of APOE cKO mice. AF-488-labeled LDL or PBS (control) was injected intravenously into dyslipidemic APOE cKO mice that received tamoxifen 10 d prior. Mice were euthanized 30 min after injection. Scale bars, 100 μm, top panel, and 20 μm, bottom panel; n = 6 LDL-AF-488 and n = 2 control, where every n represents a different liver section. i, Flow cytometry of liver KCs showing uptake of LDL-AF-488 (LDL-AF-488 in green; control in black). DC, dendritic cell; pDC, plasmacytoid dendritic cell; UMAP, uniform manifold approximation and projection.
Fig. 5
Fig. 5. Ablating KCs prevents the hepatic response to atherogenic dyslipidemia.
a, Volcano plot of genes downregulated in female D374Y mice treated with clodronate liposome during 10-d post-tamoxifen administration while maintained on a chow diet (n = 3 versus n = 3; P value from DESeq2 two-sided Wald test). b,c, Effects of clodronate liposomes on the expression of core identity genes of KCs (b), LAMs, monocytes and CV and capsular macrophages (c) in the liver of D374Y mice. d, Effect of clodronate liposomes on the day 10 conserved gene expression in both APOE cKO and D374Y mice. e, IL18BP plasma levels in dyslipidemic APOE cKO and D374Y mice given clodronate liposomes or Dil liposomes controls (ng ml−1, APOE cKO n = 3 and D374Y n = 4). f, Volcano plot and heat map indicating minimal response of the liver to dyslipidemia when comparing littermate control versus D374Y with both treated with clodronate liposomes, as determined by mRNA-seq (n = 3 versus n = 3; P value from DESeq2 two-sided Wald test). g, Total plasma (mg dl−1) and liver (µg mg−1 of protein) cholesterol and triglyceride measurements in dyslipidemic APOE cKO and D374Y mice given clodronate liposomes or Dil liposomes controls with respective littermate controls also administered clodronate liposomes (APOE cKO n = 4 versus n = 3 versus n = 4 and D374Y n = 3 versus n = 4 versus n = 3). h, Plasma CD5l (µg ml−1) concentrations as determined by ELISA in D374Y and littermate control mice 10 d after tamoxifen administration (n = 9 versus n = 9). i, Plasma CD5l (µg ml−1) concentrations in dyslipidemic D374Y mice and littermate control mice given clodronate liposomes and dyslipidemic D374Y mice administered Dil liposomes controls (n = 3 versus n = 4 versus n = 3). All experiments were conducted on day 10 after tamoxifen treatment, and mice were maintained on a normal chow diet. All plots are ±s.e.m. Two-sided t-test (e,h) or one-way ANOVA (g,i).
Fig. 6
Fig. 6. APOB lipoproteins are required for the KC inflammatory response to an HFD.
a, Venn diagram of unique and overlapping differentially expressed liver genes after 4 weeks of HFD after tamoxifen induction in female APOE cKO (n = 3) and D374Y (n = 2 versus n = 3) mice versus respective littermate controls, as determined by bulk mRNA-seq. b, Expression of conserved genes from the week 4 HFD analysis in the liver day 10 scRNA-seq dataset. c, ELISA for secreted CD5L in plasma after 4 weeks on an HFD (APOE cKO n = 5 versus n = 5 and D374Y n = 8 versus n = 8). d, Identification of conserved transcriptional response to 4 weeks of HFD from littermate controls only of both strains. e, Heat map for expression of conserved genes from APOE cKO and D374Y mice compared to littermate controls alone in response to 4 weeks of HFD. All plots are ±s.e.m. Two-sided t-test (c).
Fig. 7
Fig. 7. CD8 T cells maintain KC responses to atherogenic dyslipidemia.
a, Venn diagram representing overlapping genes among differentially regulated genes common to dyslipidemic female APOE cKO and D374Y mice after 4 weeks of HFD, differentially regulated genes in dyslipidemic APOE cKO mice after 4 weeks of HFD and treated with anti-CD8 antibody relative to PBS-treated mice and D374Y mice after 4 weeks of HFD and treated with anti-CD8 antibody relative to PBS-treated mice, as determined by mRNA-seq. b, Transcript per million (TPM) of selected KC-specific genes showing downregulation after 4 weeks on an HFD and treatment with anti-CD8 antibody (APOE cKO n = 3 versus n = 3 versus n = 2 and D374Y n = 2 versus n = 3 versus n = 3). All plots are mean ± s.e.m. c, Plasma lipoprotein fractionation profiles (µmol L−1). All curves were calculated as an average of plasma pooled from female mice (n = 5–6). DE, differentially expressed; VLDL, very-low-density lipoprotein.
Extended Data Fig. 1
a, Schematic diagram of the APOE cKO and D374Y alleles. b, Enzyme-linked immunosorbent assay for plasma hPCSK9 protein in inducible male and female D374Y mice (blue line) and their littermate controls (black line) before and at 3 and 10 days after tamoxifen dosing (D374Y littermate control day 0: n = 1, Day 3: n = 2 and Day10: n = 5, D374Y day 0: n = 6, Day 3: n = 3 and Day10: n = 6). c, Plasma total cholesterol measurements (D374Y littermate control day 0: n = 6, Day 3: n = 6 and Day10: n = 6, D374Y day 0: n = 3, Day 3: n = 5 and Day10: n = 6). d, Cholesterol measurements 24 hours after tamoxifen administration from inducible male and female D374Y mice, (n = 6 D374Y and n = 5 littermate control mice). e, Immunoblot for LDLR expression in liver of D374Y mice or littermate controls after 10 days following tamoxifen induction maintained on a chow diet (n = 3 D374Y and n = 2 control, where every n represents a different mouse). f, Representative hematoxylin and eosin (H&E) sections of liver from APOE cKO, D374Y and respective littermate control mice at 10 days chow-fed or 8 weeks HFD diet following tamoxifen administration. Arrows indicate possible immune cell infiltration. Black scale bars represent 200 μm. n = 2 vs 2 in each group (where every n represents a different mouse) g, Circulating levels of AST, ALT, albumin, globulin, bilirubin and A/G ratio in dyslipidemic APOE cKO and D374Y mice with littermate controls, 10 days post tamoxifen induction while maintained on a chow diet and after 8 weeks on a high fat diet (10 days post tamoxifen: n = 8 APOE cKO and n = 8 littermate control mice; n = 9 D374Y and n = 7 littermate control mice. 8 weeks post tamoxifen while on a high fat diet: n = 8 APOE cKO and n = 6 littermate control mice; n = 8 D374Y and n = 8 littermate control mice). h, Histology showing ORO staining of atherosclerotic lesions in the aortic root of dyslipidemic APOE cKO and D374Y mice with littermate controls after 8 weeks on a high fat (scale bar =100 μm n = 3 vs 3 in each group (where every n represents a different mouse). All plots are mean ± SEM. Statistical analysis was performed with mixed model 2-way ANOVA (b,c), two-sided t-test (d) or one-way ANOVA (g).
Extended Data Fig. 2
Extended Data Fig. 2. Conserved and divergent responses to sustained atherogenic dyslipidemia.
a, Plasma levels of cholesterol in dyslipidemic APOE cKO and D374Y mice with respective littermate controls, maintained on a high fat diet for 20 weeks. (APOE cKO n = 16 vs 11; and D374Y n = 7 vs 3). Plots are ± SEM, two-sided t-test b, Representative liver sections stained with ORO in APOE cKO and D374Y mice after 20 weeks on a high fat diet (scale bars = 100 μm, n = 2 vs 2 for D374Y and n = 3 vs 3 for APOE cKO, where n indicates a different mouse). c, Representative liver sections stained with H&E in APOE cKO and D374Y mice after 20 weeks on a high fat diet (scale bars = 100 μm, n = 2 vs 2 in each group where n indicates a different mouse).d, Unique and common upregulated genes in both strains at 8, 12, and 20 weeks on a high fat diet. Unique genes for each strain are indicated at the bottom. e, Flow cytometry of CLEC4F levels on Kupffer cells from female D374Y versus littermate control after 8 weeks of high fat diet. f, Heatmap of the 72 genes upregulated at all time points in both strains, expressed in 76 human single cell types. g, Flow cytometry plots showing percentages of blood and liver monocytes, and liver Kupffer cells in dyslipidemic D374Y mice given clodronate liposome or Dil liposomes control for 8 weeks while on a high fat diet. h, Immunohistochemistry of liver to detect CD5L production in control or clodronate treated D374Y mice after 8 weeks of high fat diet (scale bars = 100 μm). i, The 14 genes not affected by clodronate-induced Kupffer cells depletion, expressed in liver myeloid cell clusters. j, Correlation between plasma IL18BP and liver PCSK9 expression in humans.
Extended Data Fig. 3
Extended Data Fig. 3. Conserved and divergent responses to initial atherogenic dyslipidemia.
a, Volcano plots of bulk mRNA-seq of whole liver from female APOE cKO (n = 4 vs 4) and D374Y (n = 2 vs 2) mice versus their respective littermate controls (p value from DESeq2 two-sided Wald test). Bulk mRNA-seq was performed 10 days after tamoxifen dosing on whole liver in female mice aged 10-12 weeks at induction. b, Venn diagram indicating unique and overlapping differentially expressed genes. c, Expression in 76 human single cell types of the 10 conserved genes from APOE cKO and D374Y alleles day 10 after tamoxifen. d, TPM (transcript per million) of selected genes differentially regulated only in the APOE cKO strain. All plots are ± SEM and each point represents an individual liver (n = 4 vs 4). e, Reactome pathways of genes differentially regulated only in the D374Y strain. f, TPM for genes implicated in lipids synthesis pathways after 10 days post dyslipidemia induction in both strains. n = 4 APOE cKO and n = 4 littermate control; n = 2 D374Y and n = 2 littermate control. All plots are mean ± SEM. * indicates a false discovery rate < 0.1
Extended Data Fig. 4
Extended Data Fig. 4. Characterisation of mCherry-APOB responsive cells.
a, Schematic of targeting strategy of the Apob locus to produce mCherry-APOB. b, Confocal analysis of liver from D374Y and D374Y-APOB strains 10 days after tamoxifen treatment and maintained on a chow diet. Scale bars are 100μM, n = 2 D374Y-APOB and n = 4 D374Y, where n represet a different liver sections. c, Western blot of plasma from D374Y-APOB mice probed with anti-mCherry antibody. d, Plasma total cholesterol measurements from female mCherry-APOB and D374Y- mCherry-APOB after 4 weeks of high-fat diet following tamoxifen-induction (n = 4 D374Y and n = 3 littermate control mice). Plots are ± SEM. statistical analysis was performed with two-sided t-test. e, Heatmap of the top 5 marker genes for every cluster using Seurat analysis of scRNA-seq data from Live CD45+mCherry-APOB+ cells isolated from digested liver of female D374Y 10 days after tamoxifen administration and maintained on a chow diet. Yellow indicates high expression of a particular gene, and purple indicates low expression. f, Expression of receptors that are capable of APOB lipoproteins uptake in the cell types found in a mouse liver. g, Quantification of liver Kupffer cells (defined Live CD45 + CD3-CD19-Ly6G-CD64 + F4/80 + TIM4 + ) in male D374Y and littermate controls 10 days after tamoxifen administration and maintained on a chow diet. n = 6 D374Y and n = 8 littermate control mice. Data are shown as mean ± SEM. h, Representative gating strategy applied to Kupffer cells analysis by flow cytometry. i, Histogram representing the different cell populations responsible for LDL uptake in the liver of a dyslipidemic APOE cKO mouse injected i.v. with a solution containing purified LDL-AF-488. j, Histogram and mean fluorescent intensity for mCherry in the liver of a APOE cKO mouse injected i.v. with D374Y-mCherry plasma (red line), compared to a APOE cKO mouse injected with non-labelled D374Y plasma (black line) (n = 7 individual samples obtained from the liver of the injected APOE cKO mouse and n = 3 individual samples obtained from the liver of the injected littermate control mouse). Data are presented as mean ± SEM. statistical analysis was performed with two-sided t-test. In all cases, mice were administered tamoxifen 10 days prior and maintained on a chow diet. Source data
Extended Data Fig. 5
Extended Data Fig. 5. Specificity of Liver KC ablation by clodronate liposomes.
a, Confocal microscopy of liver D374Y mice stained with anti-CD68 and b, APOE cKO mice stained with F4/80, with and without clodronate liposome treatment as indicated (scale bar =100 μm, n = 2 vs 2 in each group, where n represents a different mouse). c, Absolute numbers of myeloid cell types in blood, bone marrow (BM), and liver in male APOE cKO mice and littermate controls with and without clodronate treatment, as determined by Flow cytometry. Bone marrow granulocyte were defined as live CD45 + CD11b + Ly6G + , bone marrow monocytes as live CD45 + CD11b + Ly6G-Ly6C + , liver monocytes as live CD45 + CD19-CD3e-TIMD4-Ly6C+ liver Kupffer cells as CD45 + CD19-CD3e-TIMD4 + Ly6C-F4/80 + CD64 + , blood granulocytes as live CD45 + CD19-B220-CD11b + Ly6G+ and blood monocytes as live CD45 + CD19-B220-CD11b + Ly6G-Ly6Clo to hi. n = 4 littermate control (Control), n = 4 littermate control (Clodronate), n = 3 APOE cKO (Control), and n = 4 APOE cKO (Clodronate) mice. d, Immunohistochemical detection of F4/80 in the adipose tissue of dyslipidemic APOE cKO mice treated with clodronate or Dil liposome control (scale bar indicates 40 mm). On the right, qPCR analysis showing no difference in the expression of CD68 in the visceral white adipose tissue of the same mice. Data is presented as average delta CT normalized to TBP + /- SEM (n = 4 APOE cKO clodronate and n = 3 APOE cKO control). e, Effects of clodronate liposomes on Kupffer cells, LAMs, Monocytes and CV and capsular macrophages as determined by bulk RNA seq of whole liver of APOE cKO mice (n = 3 vs 3) f, TPM after clodronate administration showing no significant reduction in the expression of de novo lipogenesis genes in APOE cKO mice, and cholesterol synthesis genes in D374Y mice (APOE cKO n = 3 vs 3; and D374Y n = 3 vs 3). Statistical analysis was performed with one-way ANOVA (c) or two-sided t-test (d). All experiments were performed 10 days after tamoxifen treatment in mice maintained on a normal chow diet. All plots are ± SEM.
Extended Data Fig. 6
Extended Data Fig. 6. The liver response to four weeks of high-fat diet.
a, Plasma (mg/dl) and liver (ug/mg protein) cholesterol measurements in male and female APOE cKO and female D374Y mice together with their respective littermate controls 4 weeks after Tamoxifen administration and maintained on a HFD. Plasma: n = 7 APOE cKO and n = 3 littermate control mice; n = 10 D374Y and n = 12 littermate control mice. Liver: n = 8 APOE cKO and n = 7 littermate control mice; n = 5 D374Y and n = 6 littermate control mice. All plots are ± SEM. Statistical analysis was performed with two-sided t-test. b Hematoxylin and eosin staining of paraffin sections of the liver from D374Y and littermate control mice 4 weeks after Tamoxifen administration and maintained on a HFD (scale bar =100 μm, n = 2 vs 2 in each group, where n represents a different mouse). c, Volcano plot of differentially expressed genes after 4 weeks of high-fat diet following tamoxifen-induction in APOE cKO or D374Y mice versus respective littermate controls as determined by mRNA-seq (p value from DESeq2 two-sided Wald test). d, Expression in liver cells of the differentially expressed genes conserved in both strains. e, Expression in 76 human single cell types of the 27 conserved genes from APOE cKO and D374Y alleles 4 weeks after Tamoxifen administration and maintained on a HFD. f, Reactome pathways of genes differentially regulated only in littermate control mice after 4 weeks of HFD. g, expression pattern of HFD-only induced genes in the liver cells.
Extended Data Fig. 7
Extended Data Fig. 7. B cells are not required for the KC response to atherogenic dyslipidemia.
a,b, Absolute numbers of Spleen CD8 T cells (a) and CD11b + CD3-CD19- myeloid (b) in female APOE cKO and D374Y mice treated with anti-CD8 antibody relative to PBS treated mice as determined by flow cytometry. Mice were maintained on HFD for 4 weeks following Tamoxifen administration. CD3 + CD8: n = 5 APOE cKO and n = 5 APOE cKO + αCD8 mice; n = 5 D374Y and n = 6 D374Y + αCD8 mice. CD11b + CD3-CD19-: n = 5 APOE cKO and n = 4 APOE cKO + αCD8 mice; n = 5 D374Y and n = 6 D374Y + αCD8 mice. c, Heatmaps of bulk mRNA seq of whole liver showing variations in the expression of core identity genes for KCs, LAMs, monocytes, CV and capsular macrophages following CD8 T cell depletion in both strains. d, Absolute numbers of Spleen B cell (CD19 + B220 + ) in D374Y female mice treated with anti-CD20 antibody relative to PBS treated mice as determined by flow cytometry. Mice were maintained on HFD for 4 weeks following Tamoxifen administration (n = 4 D374Y and n = 6 D374Y + αCD20 mice). e, Overlap of genes upregulated in both APOE cKO and D374Y mice versus those upregulated in D374Y mice but treated with anti-CD20 antibody, in all cases after 4 weeks of high-fat diet following tamoxifen-induction. All plots are ± SEM. Statistical analysis was performed with two sided t-test (a,b and d).

Comment in

References

    1. Libby, P. et al. Atherosclerosis. Nat. Rev. Dis. Primers5, 56 (2019). 10.1038/s41572-019-0106-z - DOI - PubMed
    1. Boren, J. et al. Low-density lipoproteins cause atherosclerotic cardiovascular disease: pathophysiological, genetic, and therapeutic insights: a consensus statement from the European Atherosclerosis Society Consensus Panel. Eur. Heart J.41, 2313–2330 (2020). 10.1093/eurheartj/ehz962 - DOI - PMC - PubMed
    1. Tabas, I., Williams, K. J. & Boren, J. Subendothelial lipoprotein retention as the initiating process in atherosclerosis: update and therapeutic implications. Circulation116, 1832–1844 (2007). 10.1161/CIRCULATIONAHA.106.676890 - DOI - PubMed
    1. Harkes, L. & Van Berkel, J. C. Quantitative role of parenchymal and non-parenchymal liver cells in the uptake of [14C]sucrose-labelled low-density lipoprotein in vivo. Biochem. J.224, 21–27 (1984). 10.1042/bj2240021 - DOI - PMC - PubMed
    1. Nenseter, M. S. et al. Uptake of LDL in parenchymal and non-parenchymal rabbit liver cells in vivo. LDL uptake is increased in endothelial cells in cholesterol-fed rabbits. Biochem. J.254, 443–448 (1988). 10.1042/bj2540443 - DOI - PMC - PubMed

Publication types

MeSH terms