. 2023 Dec;2(12):1246-1261.
doi: 10.1038/s44161-023-00370-3. Epub 2023 Dec 7.

Plakophilin 2 gene therapy prevents and rescues arrhythmogenic right ventricular cardiomyopathy in a mouse model harboring patient genetics

Affiliations

Plakophilin 2 gene therapy prevents and rescues arrhythmogenic right ventricular cardiomyopathy in a mouse model harboring patient genetics

William H Bradford et al. Nat Cardiovasc Res. 2023 Dec.

Abstract

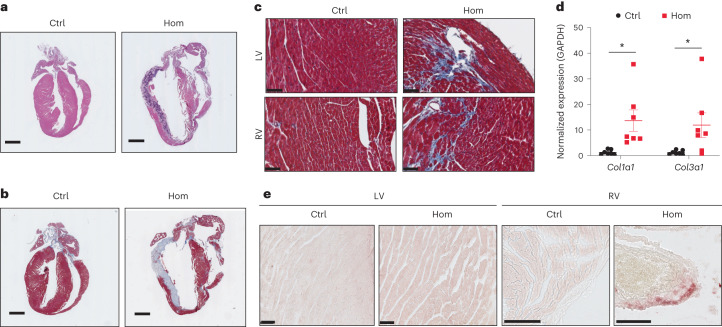
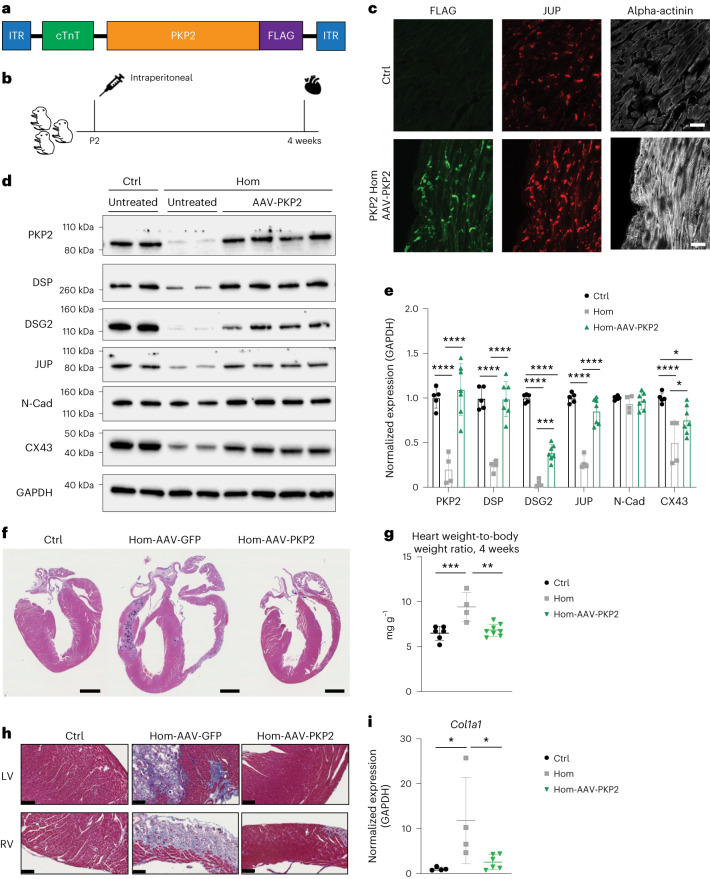
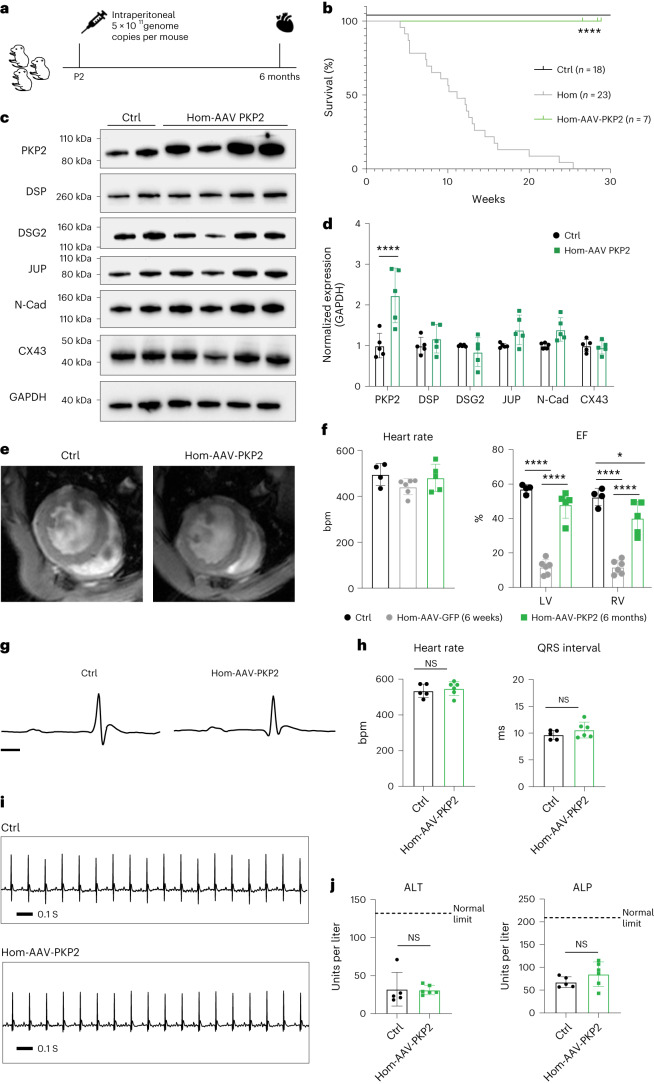
Arrhythmogenic right ventricular cardiomyopathy (ARVC) is a fatal genetic heart disease characterized by cardiac arrhythmias, in which fibrofatty deposition leads to heart failure, with no effective treatments. Plakophilin 2 (PKP2) is the most frequently mutated gene in ARVC, and although altered RNA splicing has been implicated, there are no models to study its effect and therapeutics. Here, we generate a mouse model harboring a PKP2 mutation (IVS10-1G>C) affecting RNA splicing, recapitulating ARVC features and sudden death starting at 4 weeks. Administering AAV-PKP2 gene therapy (adeno-associated viral therapy to drive cardiac expression of PKP2) to neonatal mice restored PKP2 protein levels, completely preventing cardiac desmosomal and pathological deficits associated with ARVC, ensuring 100% survival of mice up to 6 months. Late-stage AAV-PKP2 administration rescued desmosomal protein deficits and reduced pathological deficits including improved cardiac function in adult mice, resulting in 100% survival up to 4 months. We suggest that AAV-PKP2 gene therapy holds promise for circumventing ARVC associated with PKP2 mutations, including splice site mutations.


Conflict of interest statement

F.S. was a co-founder of Stelios Therapeutics (acquired by LEXEO Therapeutics) and is a co-founder and shareholder of Papillon Therapeutics Inc as well as a consultant and shareholder of LEXEO Therapeutics Inc. A.M. is a co-founder of and equity holder in Insilicomed Inc and Vektor Medical Inc. For A.M., findings reported in this study did not involve the companies he is involved with in any way, and these findings have no relationship with the business activities or scientific interests of either company. All other authors declare no competing interests.

Figures

Fig. 1
Fig. 1. PKP2 splice site mutation is sufficient to recapitulate premature postnatal lethality associated with, and cardiac physiological disease hallmarks of ARVC in mice.
a, Genomic location for PKP2 IVS10-1G>C mutation equivalent in mouse (PKP2 IVS9-1G>C), single strand oligodeoxynucleotides (ssODN) with mutation template (mutation is highlighted in red). PAM, protospacer adjacent motif, labeled in green; sgRNA, single guide RNA; WT, wild type. b, Kaplan–Meier survival analysis of PKP2 Het, PKP2 Hom and littermate control (Ctrl) mice. c, Representative cardiac four-chamber and short-axis views from MRI at end-diastole. d, Quantification of left (LV) and right (RV) ventricle end-systolic volume (ESV), end-diastolic volume (EDV), ejection fraction (EF) and heart rate using cine MRI in control (black bars) and PKP2 Hom (red bars) mice (n = 4 biologically independent animals). Data are presented as mean ± s.e.m. Two-way analysis of variance (ANOVA) with Bonferroni’s multiple comparison test. Adjusted P values, ****P < 0.00001, **P < 0.01 (EDV, RV, P = 0.0026; ESV, LV, P = 0.0074), ***P < 0.001 (ESV, RV, P = 0.0001). e, Representative composite surface ECG tracings averaged from four beats in control and PKP2 Hom mice at 4 weeks of age. Scale bars, 10 ms. f, Quantification of heart rate, PR interval and QRS interval from composite surface ECG tracings (controls, n = 4; Hom, n = 5 biologically independent animals). Data are presented as mean ± s.e.m. Two-tailed unpaired t-test. *P < 0.05 (P = 0.0198). g, Representative ECG tracings from control and PKP2 Hom mice at 4 weeks of age (controls, n = 6; Hom, n = 8 biologically independent animals). h, Quantification of mice demonstrating PVCs (right, red arrows) (controls, n = 6; Hom, n = 8 biologically independent animals). Two-tailed Fisher’s exact test. *P < 0.05 (P = 0.0310). Source data
Fig. 2
Fig. 2. PKP2 splice site mutation is sufficient to recapitulate cardiac pathological disease hallmarks associated with ARVC in mice.
a,b, Representative cardiac sections stained with hematoxylin and eosin (a) and Masson’s Trichrome staining (b) from control and PKP2 Hom mice at 6 weeks of age. Scale bars, 1 mm. c, High-magnification views of Masson’s Trichrome stained sections from the left ventricle and right ventricle. Scale bars, 50 µm. d, Quantification of fibrosis with RT–qPCR for profibrotic gene markers Col1α1 and Col3α1 (controls, n = 5; Hom, n = 7 biologically independent animals). Data are presented as mean ± s.e.m. Two-tailed unpaired t-test. *P < 0.05 (P = 0.0116 for Col1α1 and P = 0.0448 for Col3α1). e, Right ventricle and left ventricle sections stained with Oil Red O from control and PKP2 Hom hearts at 6 weeks of age. Scale bars, 100 µm. Experiments were repeated independently three times with similar results.
Fig. 3
Fig. 3. PKP2 splice site mutation affects PKP2 quality (appearance of mutant PKP2) and reduces PKP2 levels with consequences on desmosomal and gap junction disruption in PKP2 Hom mouse hearts.
a, RT–qPCR analysis of PKP2 exons 5–13 and exons 9–10 in control and PKP2 Hom hearts at 4 weeks of age. RT–qPCR analysis of Pkp2 exons 9–10 in control and PKP2 Hom hearts (n = 4 biologically independent animals). Data are presented as mean ± s.e.m. Two-tailed unpaired t-test, **P < 0.01 (P = 0.0063). b, Sequencing analysis of RT–qPCR products from control and PKP2 Hom hearts. Red asterisk denotes mutation site. c, Western blot analysis of desmosomal (PKP2, DSP and DSG2), fascia adherens (JUP and N-Cad) and gap junction (CX43) proteins at 4 weeks of age in control and PKP2 Hom hearts. GAPDH served as the loading control. Endogenous WT and MUT PKP2 protein bands are depicted by black arrows. d, Quantification of protein expression in a normalized to GAPDH (n = 3 biologically independent animals). Experiments were repeated independently three times with similar results. Data are presented as mean ± s.e.m. Two-way ANOVA with Sidak’s multiple comparison test. ****P < 0.0001. e, Immunofluorescence staining of desmosomal, fascia adherens and gap junction proteins at 4 weeks of age in control and PKP2 Hom hearts. Scale bars, 25 µm. White arrows indicate the localization of mutant PKP2 in PKP2 Hom mice hearts. Experiments were repeated independently three times with similar results. Source data
Fig. 4
Fig. 4. Increasing wild-type and mutant PKP2 protein levels rescues desmosomal protein loss in PKP2 Hom neonatal cardiomyocytes in vitro.
a, Representative western blot analysis of desmosomal (PKP2, DSP, DSG2, JUP) and fascia adherens junction (N-Cad) proteins in control and Hom cardiomyocytes infected with PKP2 WT and PKP2 MUT adenoviruses. Uninfected cells were used as a control. The experiments were repeated using five independent preparations of cells. Western blot analysis of GAPDH was used as a loading control. CM, cardiomyocyte. b, Quantification of western blot analysis. Data are presented as mean ± s.e.m., n = 3 individual experiments. One-way ANOVA with Tukey’s multiple comparison test was used to compare the significance among the treatments for the same protein. *P < 0.05 (PKP2, P = 0.0408), **P < 0.01 (DSG2, P = 0.0047), ***P < 0.001 (DSP, P = 0.0001; DSG2, P = 0.0009; JUP, P = 0.0004), ****P < 0.0001. Source data
Fig. 5
Fig. 5. Early administration of AAV PKP2 prevents desmosomal-mediated cell junction deficits and cardiac pathological hallmarks of ARVC in PKP2 Hom mice.
a, Design of AAV Pkp2 vector with inverted terminal repeats (ITR), cTnT promoter, Kozak sequence, Pkp2 cDNA, C-terminal FLAG tag, Woodchuck hepatitis virus post-transcriptional regulatory element (WPRE) and bovine growth hormone polyadenylation signal (BGH-pA). b, Schemata of early neonatal delivery strategy and analysis time point. c, Representative immunofluorescence staining of FLAG (green), JUP (red) and alpha-actinin (white) at 4 weeks post injection in uninfected wild-type control and PKP2 Hom hearts treated with AAV-PKP2. Scale bars, 20 µm. Experiments were repeated independently three times with similar results. d, Western blot analysis of desmosomal, fascia adherens and gap junction proteins at 4 weeks post injection in uninfected control, uninfected PKP2 Hom and AAV-PKP2-treated PKP2 Hom hearts. GAPDH served as the loading control. e, Quantification of protein expression in (d) normalized to GAPDH (controls, n = 5; Hom, n = 5; Hom-AAV-PKP2, n = 7 biologically independent animals). Data are presented as mean ± s.e.m. Two-way ANOVA with Tukey’s multiple comparison test. ****P < 0.0001, ***P < 0.001 (DSG2, P = 0.0008), *P < 0.05 (CX43, Ctrl versus Hom-AAV-PKP2, P = 0.0123; Hom versus Hom-AAV-PKP2, P = 0.0174). Experiments were repeated independently three times with similar results. f, Hematoxylin and eosin staining of cardiac sections from wild-type control and PKP2 Hom mice treated with AAV-GFP or AAV-PKP2. Scale bars, 1 mm. g, Ratios of heart weight to body weight of wild-type control and PKP2 Hom mice treated with AAV-GFP or AAV-PKP2 (controls, n = 6; Hom, n = 4; Hom-AAV-PKP2, n = 8 biologically independent animals). Data are presented as mean ± s.e.m. One-way ANOVA with Tukey’s multiple comparison test. ***P < 0.001 (P = 0.0008), **P < 0.01 (P = 0.0014). h, Masson’s Trichrome staining of cardiac sections from wild-type control and PKP2 Hom mice treated with AAV-GFP or AAV-PKP2. Scale bars, 100 µm. i, RT–qPCR analysis of Col1α1 levels (controls, n = 4; Hom, n = 4; Hom-AAV-PKP2, n = 6 biologically independent animals). Data are presented as mean ± s.e.m. One-way ANOVA with Tukey’s multiple comparison test. *P < 0.05 (P = 0.0316 for Ctrl versus Hom; P = 0.0429 for Hom versus Hom-AAV-PKP2). Source data
Fig. 6
Fig. 6. Early administration of AAV-PKP2 prevents cardiac mechanical and electrical pathological hallmarks of ARVC in PKP2 Hom mice.
a, Representative short-axis MRI from wild-type control mice, PKP2 Hom mice treated with AAV-GFP and PKP2 Hom mice treated with AAV-PKP2. b, Quantification of heart rate, ejection fraction, end-diastolic volume and end-systolic volume (controls, n = 5; Hom-AAV-GFP, n = 5; Hom-AAV-PKP2, n = 6 biologically independent animals). Data are presented as mean ± s.e.m. One-way ANOVA with Tukey’s multiple comparison test for heart rate measurement. Two-way ANOVA with Bonferroni’s multiple comparison test for additional measurements. Adjusted P values, ****P < 0.0001, **P < 0.01, *P < 0.05 (ESV, LV, Ctrl versus Hom-AAV-GFP, P = 0.0210; Hom-AAV-GFP versus Hom-AAV-PKP2, P = 0.0039). c, Representative composite surface ECG tracings averaged from four beats in wild-type control and PKP2 Hom mice treated with AAV-GFP or AAV-PKP2 at 4 weeks of age. Scale bar, 10 ms. d, Quantification of heart rate, PR interval and QRS interval from composite surface ECG tracings (controls, n = 5; Hom-AAV-GFP, n = 5; Hom-AAV-PKP2, n = 4 biologically independent animals). Data are presented as mean ± s.e.m. One-way ANOVA with Tukey’s multiple comparison test. *P < 0.05 (Ctrl versus Hom-AAV-GFP, P = 0.0149; Hom-AAV-GFP versus Hom-AAV-PKP2, P = 0.0348). e, Representative ECG tracings through time from control and PKP2 Hom mice treated with AAV-GFP or AAV-PKP2 at 4 weeks of age. f, Quantification of mice demonstrating PVCs (red arrows) (controls, n = 5; Hom-AAV-GFP, n = 5; Hom-AAV-PKP2, n = 4 biologically independent animals). Source data
Fig. 7
Fig. 7. Early administration of AAV-PKP2 affords long-term cardiac desmosomal protection, function and survival in 6-month-old PKP2 Hom mice.
a, Schemata for early injection of AAV-GFP or AAV-PKP2 to PKP2 Hom mice at postnatal day 2 and post analysis at 6 months. b, Kaplan–Meier survival analysis (log-rank test) of mice (controls, n = 18; Hom, n = 23; Hom-AAV-PKP2, n = 7 biologically independent animals). Ctrl and PKP2 Hom data in Fig. 7 are also presented in Fig. 1. ****P < 0.0001 (Χ2 58.07, d.f. 2). c, Western blot analysis of PKP2 and cell–cell junctional proteins (DSP, DSG2, JUP, N-Cad and CX43) in mouse hearts. GAPDH was used as a loading control. d, Quantification of protein expression shown in c normalized to GAPDH. Data are presented as mean ± s.e.m., n = 5 biologically independent animals. Two-way ANOVA with Sidak’s multiple comparison test. ****Adjusted P < 0.0001. e, Representative short-axis cardiac MRI views. f, Quantification of heart rate and ejection fraction in mice using cardiac MRI (controls, n = 4; Hom-AAV-GFP, n = 6; Hom-AAV-PKP2, n = 5 biologically independent animals). Data are presented as mean ± s.e.m. One-way ANOVA for heart rate comparison. Two-way ANOVA with Bonferroni’s multiple comparison test for other comparisons. Adjusted P values, ****P < 0.0001, *P < 0.05 (P = 0.0358). Historical data for Hom-AAV-GFP are from 6 weeks as no PKP2 Hom mouse survived to 6 months of age. g, Representative composite surface ECG tracings averaged from four beats in untreated wild-type control and PKP2 Hom mice treated with AAV-PKP2. Scale bar, 10 ms. h, Quantification of heart rate and QRS intervals from composite surface ECG tracings (controls, n = 5; Hom-AAV-PKP2, n = 6 biologically independent animals). Data are presented as mean ± s.e.m. Two-tailed unpaired t-test. NS, not significant. i, Representative ECG tracings from untreated control and PKP2 Hom mice treated with AAV-PKP2. j, Blood serum analysis for ALT and ALP liver enzyme levels in untreated wild-type control and PKP2 Hom mice treated with AAV-PKP2 (controls, n = 5; Hom-AAV-PKP2, n = 6 biologically independent animals). Normal enzyme limits are indicated with dotted lines. Data are presented as mean ± s.e.m. Two-tailed unpaired t-test. Source data
Fig. 8
Fig. 8. Late-stage administration of AAV PKP2 has an immediate impact on cardiac desmosomal deficits and function to promote late term survival in 5 month old PKP2 Hom mice.
a, Schemata for late injection of AAV-GFP or AAV-PKP2 to PKP2 Hom mice at 4 weeks and post analysis at 6 weeks. gc, genom copies. b, Western blot analysis of PKP2 and desmosomal cell–cell junctional proteins (DSP, DSG2 and JUP) in mouse hearts. GAPDH was used as a loading control. Experiments were repeated independently three times with similar results. c, Representative short-axis MRI views from mice. d, Quantification of heart rate and ejection fraction in mice using cardiac MRI (n = 6 biologically independent animals). Data are presented as mean ± s.e.m. Two-way ANOVA with Sidak’s multiple comparison test. **P < 0.01 (P = 0.0026), *P < 0.05 (P = 0.0450). e, Schemata for late injection of AAV-GFP or AAV-PKP2 to PKP2 Hom mice at 4 weeks and post analysis at 20 weeks. gc, genom copies. f, Kaplan–Meier survival analysis (log-rank test) of mice (controls, n = 8; Hom-AAV-GFP, n = 8; Hom-AAV-PKP2, n = 7 biologically independent animals. ***adjusted P < 0.001 (Χ2 16.59, d.f. 2, P = 0.0003). Source data
Extended Data Fig. 1
Extended Data Fig. 1. Telemetry electrocardiogram (ECG) and cardiac magnetic resonance image (MRI) analysis in PKP2 Het mice.
(a) Representative telemetry ECG tracings and premature ventricular contraction (PVC) counts from Ctrl and PKP2 heterozygous (Het) mice at 3 months of age. Red arrows indicate premature ventricular contractions. Scale bar = 0.1 s. Data are presented as mean ± S.E.M. n = 3 biologically independent animals examined per group, two-tailed unpaired t test, * p < 0.05 (p = 0.0135). (b) Quantification of end-diastolic volumes (EDV), end-systolic volumes (ESV) and percentage of ejection fraction (EF %) in WT and PKP2 Het mice at 10 months old of age using cardiac MRI. n = 4 biologically independent animals examined per group. Data are presented as mean ± S.E.M. Two-way ANOVA with Tukey’s multiple comparison test.
Extended Data Fig. 2
Extended Data Fig. 2. PKP2 Hom mice display various electrophysiological abnormalities that precede premature death.
(a) Representative telemetry ECG tracings from Ctrl and PKP2 Hom (Hom) mice. Note that PKP2 Hom mice display isolated PVCs, that transition to ventricular tachycardia and fibrillation. Red arrow indicates PVC; Blue arrows indicate ventricular tachycardia. Scale bar = 0.1 s. (b) Immunofluorescence staining of Nav1.5, plakoglobin (JUP), and the cardiomyocyte marker, sarcomeric alpha-actinin in representative mouse heart sections from 9 week old Ctrl, PKP2 Hom + AAV-GFP (five weeks post-late stage administration) and PKP2 Hom+AAV-PKP2 (five weeks post-late stage administration). Scale bar, 10 μm. White arrows depict Nav1.5 re-localization to cell-cell junction/membrane in PKP2 Hom hearts. Experiments were repeated independently three times with similar results. (c) Representative sodium current recording (left) and ion current-voltage (I-Vm) relationship of sodium current (right) in isolated adult cardiomyocytes from 8-9 week old Ctrl and PKP2 Hom mice, highlighting loss of sodium channel homeostasis in PKP2 Hom cardiomyocytes. Current amplitude has been normalized against cell capacitance (pA/pF). Data are presented as mean ± S.E.M. Ctrl, n = 6 biologically independent animals; PKP2 Hom, n = 8 biologically independent animals. Two-way ANOVA, **** p < 0.0001.
Extended Data Fig. 3
Extended Data Fig. 3. PKP2 Hom mice display cardiac ultrastructural and inflammatory deficits.
(a) Representative transmission electron micrographs from Ctrl and PKP2 Hom hearts at 4 weeks of age. White arrows denote healthy desmosomes. Quantification of desmosomes per μm of membrane in Ctrl and PKP2 Hom hearts at two weeks of age, denoted early loss of desmosomes in PKP2 Hom. Red arrows denote multi-membrane vesicles, suggestive of desmosomal structure degradation. Scale bar = 1 µm. Data are presented as mean ± S.E.M. two-tailed t test, n = 7 for Ctrl, n = 8 for PKP2 Hom biologically independent animals per group, respectively. ***, p < 0.001 (p = 0.0005). (b) Representative western blot and quantification analysis of nuclear factor-kappa B (NF-κB) expression in heart lysates from 9 week old Ctrl, PKP2 Hom + AAV-GFP (five weeks post-late stage administration) and PKP2 Hom+AAV-PKP2 (five weeks post-late stage administration) mice. β-actin used as a loading control. Data are presented as mean ± S.E.M. One-way ANOVA with Turkey’s multiple comparisons test, n = 3 biologically independent animals per group, **, p < 0.01 (p = 0.0099), ***, p < 0.001 (p = 0.0009). Source data
Extended Data Fig. 4
Extended Data Fig. 4. PKP2 Hom mice display blood serum cytokine alterations that can be alleviated with late-stage administration of AAV PKP2.
Representative cytokine arrays are shown from serum collected from 9 weeks old Ctrl, PKP2 Hom + AAV-GFP (five weeks post-late stage administration) and PKP2 Hom+AAV-PKP2 (five weeks post-late stage administration) mice. Spots in red refer to reference markers to compare overall exposure levels. Spots in blue refer to cytokines (CXCL11) and C5/C5A (Complement component 5a) that are not significantly different between groups. Spots in green refer to cytokines (BLC (CXCL13/BCA-1); Eotaxin (CCL11); TIMP-1) that are altered in PKP2 Hom treated with AAV GFP and rescued by AAV PKP2 treatment in PKP2 Hom mice. Blood serum samples from Ctrl (n = 4 biologically independent animals), Hom-AAV GFP (n = 5 biologically independent animals) and Hom-AAV PKP2 (n = 6 biologically independent animals) were pooled for the cytokines array analysis.
Extended Data Fig. 5
Extended Data Fig. 5. PKP2 Hom neonatal (postnatal day 1, P1) hearts display desmosomal deficits in the absence of gross morphological changes to the heart.
(a) P1 heart weight to body weight ratios (HW/BW). Data are presented as mean ± S.E.M. n = 16 for Ctrl, n = 10 for Hom biologically independent animals, two-tailed unpaired t test, p = 0.2129, not significant. (b) RT-qPCR of cardiac stress markers atrial natriuretic factor (Nppa) and B-type natriuretic factor (Nppb) as well as (c) profibrotic genes collagen α1 types I (Col1α1) and III (Col3 α1) in P1 hearts. Data are presented as mean ± S.E.M. For (b) and (c), n = 3 biologically independent animals per group, two-tailed unpaired t test between groups, p = 0.4171 (Nppa), p = 0.9368 (Nppb), p = 0.2800 (Col1 α 1), p = 0.9655 (Col3 α 1), not significant. (d) Western blot analysis of desmosomal (PKP2, DSP, DSG2, JUP) and fascia adherens junction (JUP, N-Cad) proteins in neonatal cardiomyocytes from Ctrl and PKP2 Hom (P1) hearts. Glyceraldehyde-3-Phosphate Dehydrogenase (GAPDH) serves as the loading control. (e) Quantification of protein expression in (d) normalized to GAPDH (n = 3 biologically independent animals per group). Data are presented as mean ± S.E.M. Two-way ANOVA with Tukey’s multiple comparison test. ****, p < 0.0001. **, p < 0.01 (p = 0.0011). *, p < 0.05 (p = 0.0335). Source data
Extended Data Fig. 6
Extended Data Fig. 6. Late-stage dissolution of the cardiac cell-cell junction in PKP2 Hom hearts.
(a) Western blot analysis of desmosomal, fascia adherens, and gap junction proteins at eight weeks of age in Ctrl and PKP2 Hom hearts. GAPDH serves as the loading control. (b) Quantification of protein expression in (a) normalized to GAPDH (n = 3 biologically independent animals per group). Data are presented as mean ± S.E.M. Two-way ANOVA with Tukey’s multiple comparison test. ****, p < 0.0001, ***, p < 0.001 (p = 0.0008), **, p < 0.01 (p = 0.0019). Source data
Extended Data Fig. 7
Extended Data Fig. 7. Longitudinal assessment of late-stage administration of AAV PKP2 reveals continued effects on alleviating cardiac desmosomal deficits in addition to reduction in cardiac histopathology (fibrosis), arrhythmias and dysfunction at five weeks post-AAV administration.
(a) Schemata for late injection of AAV GFP or AAV PKP2 to PKP2 Hom mice at 4 weeks and post-analysis at 9 weeks (top). Western blot analysis of PKP2 and desmosomal proteins (DSP, DSG2 and JUP) in mouse hearts. β-actin used as a loading control. Data are presented as mean ± S.E.M. n = 6 biologically independent animals per group, Two-way ANOVA with Tukey’s multiple comparison test. *, p < 0.05 (PKP2, p = 0.0410), **, p < 0.01 (DSG2, p = 0.0099; JUP, p = 0.0020). (b) Representative Masson’s Trichrome stains from left (LV) and right ventricular (RV) sections from 9-week-old Ctrl, PKP2 Hom-AAV GFP (five weeks post-late stage administration) and PKP2 Hom-AAV PKP2 (five weeks post-late stage administration) mice. Scale bar, 2 mm. Experiments were repeated independently three times with similar results. (c) Quantification of mice demonstrating PVCs and sudden death at 9 weeks of age in Ctrl, PKP2 Hom-AAV GFP (five weeks post-late stage administration) and PKP2 Hom-AAV PKP2 (five weeks post-late stage administration) mice. (d) Quantification of end-diastolic volumes (EDV), end-systolic volumes (ESV) and percentage of ejection fraction (EF %) in 9 week old Ctrl, PKP2 Hom-AAV GFP (five weeks post-late stage administration) and Hom-AAV PKP2 (five weeks post-late stage administration) mice using cardiac MRI. Data are presented as mean ± S.E.M, n = 4 for Ctrl, n = 5 for Hom-AAV GFP group and n = 6 for Hom-AAV PKP2 biologically independent animals. Two-way ANOVA with Tukey’s multiple comparison test. ****, adjusted p < 0.0001. ***, p < 0.001 (EF, LV, p = 0.0008; RV, p = 0.0008). *, p < 0.05 (EDV, LV, p = 0.0369; RV, p = 0.0148; ESV, LV, p = 0.0352), ns, not significant. Source data
Extended Data Fig. 8
Extended Data Fig. 8. PKP2 Hom mice display fat deposition that can be alleviated with late-stage administration of AAV PKP2.
Immunofluorescence microscopy analysis of perilipin (adipocyte marker) expression and localization in representative cardiac sections from 9 week old WT as well as PKP2 Hom mice at five weeks post-late stage administration of AAV GFP or AAV PKP2. White arrows denote increased number of positive perilipin stains in PKP2 Hom mouse hearts treated with AAV GFP and significant reduction in perilipin positive stained regions in PKP2 Hom mouse hearts treated with AAV PKP2. Scale bar = 30 μm. Experiments were repeated independently three times with similar results.
Extended Data Fig. 9
Extended Data Fig. 9. PKP2 Hom mice display AAV PKP2-FLAG expression and distribution in a majority of cardiomyocytes throughout the right and left ventricles.
Immunofluorescence microscopy analysis of FLAG expression and localization in representative cardiac sections from 9 week old PKP2 Hom mice at five weeks post-late stage administration of AAV PKP2. Scale bar = 500 μm. Two insets on the left represent high magnification views of cardiomyocytes from left ventricle. Two insets on the right represent high magnification views of cardiomyocytes from right ventricle. Please note the localization of FLAG signal to the cell-cell junction in the inset panels. Inset scale bar, 100 μm. Experiments were repeated independently three times with similar results.

Comment in

References

    1. Thiene, G., Corrado, D. & Basso, C. Arrhythmogenic right ventricular cardiomyopathy/dysplasia. Orphanet J. Rare Dis.2, 45 (2007). 10.1186/1750-1172-2-45 - DOI - PMC - PubMed
    1. Sen-Chowdhry, S. et al. Arrhythmogenic cardiomyopathy: etiology, diagnosis, and treatment. Annu. Rev. Med.61, 233–253 (2010). 10.1146/annurev.med.052208.130419 - DOI - PubMed
    1. Mattesi, G. et al. Natural history of arrhythmogenic cardiomyopathy. J. Clin. Med.9, 878 (2020). 10.3390/jcm9030878 - DOI - PMC - PubMed
    1. Peters, S., Trummel, M. & Meyners, W. Prevalence of right ventricular dysplasia-cardiomyopathy in a non-referral hospital. Int. J. Cardiol.97, 499–501 (2004). 10.1016/j.ijcard.2003.10.037 - DOI - PubMed
    1. Elias Neto, J. et al. Arrhythmogenic right ventricular cardiomyopathy/dysplasia (ARVC/D) - what we have learned after 40 years of the diagnosis of this clinical entity. Arq. Bras. Cardiol.112, 91–103 (2019). - PMC - PubMed

MeSH terms