. 2024 Feb;3(2):145-165.
doi: 10.1038/s44161-023-00419-3. Epub 2024 Feb 6.

Cellular heterogeneity of pluripotent stem cell-derived cardiomyocyte grafts is mechanistically linked to treatable arrhythmias

Affiliations

Cellular heterogeneity of pluripotent stem cell-derived cardiomyocyte grafts is mechanistically linked to treatable arrhythmias

Dinesh Selvakumar et al. Nat Cardiovasc Res. 2024 Feb.

Abstract

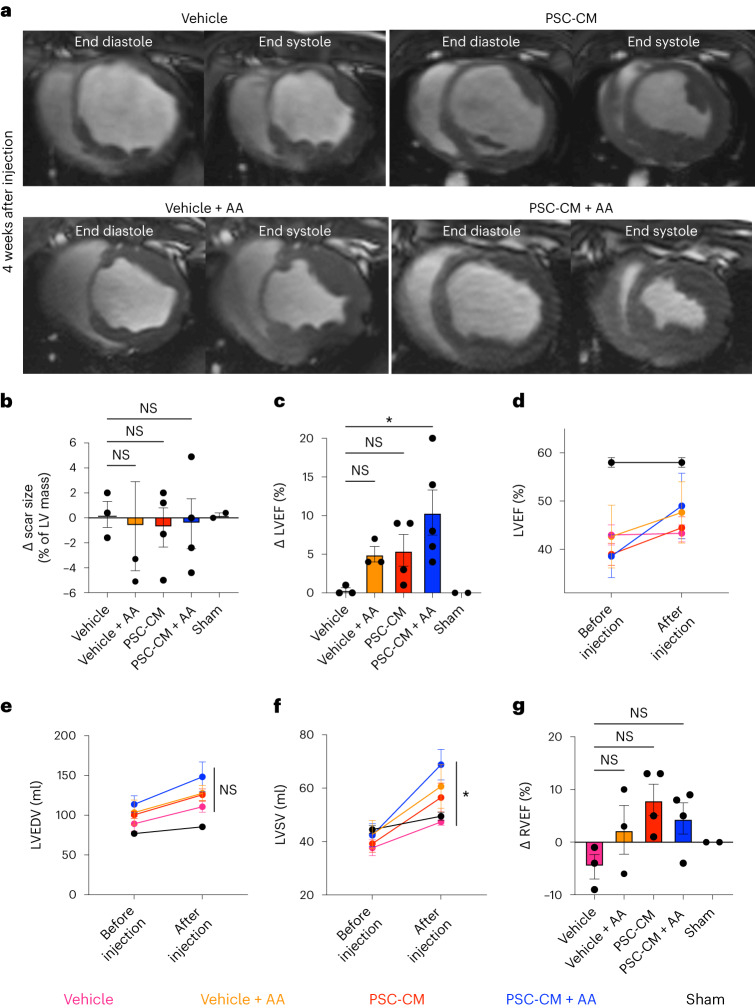
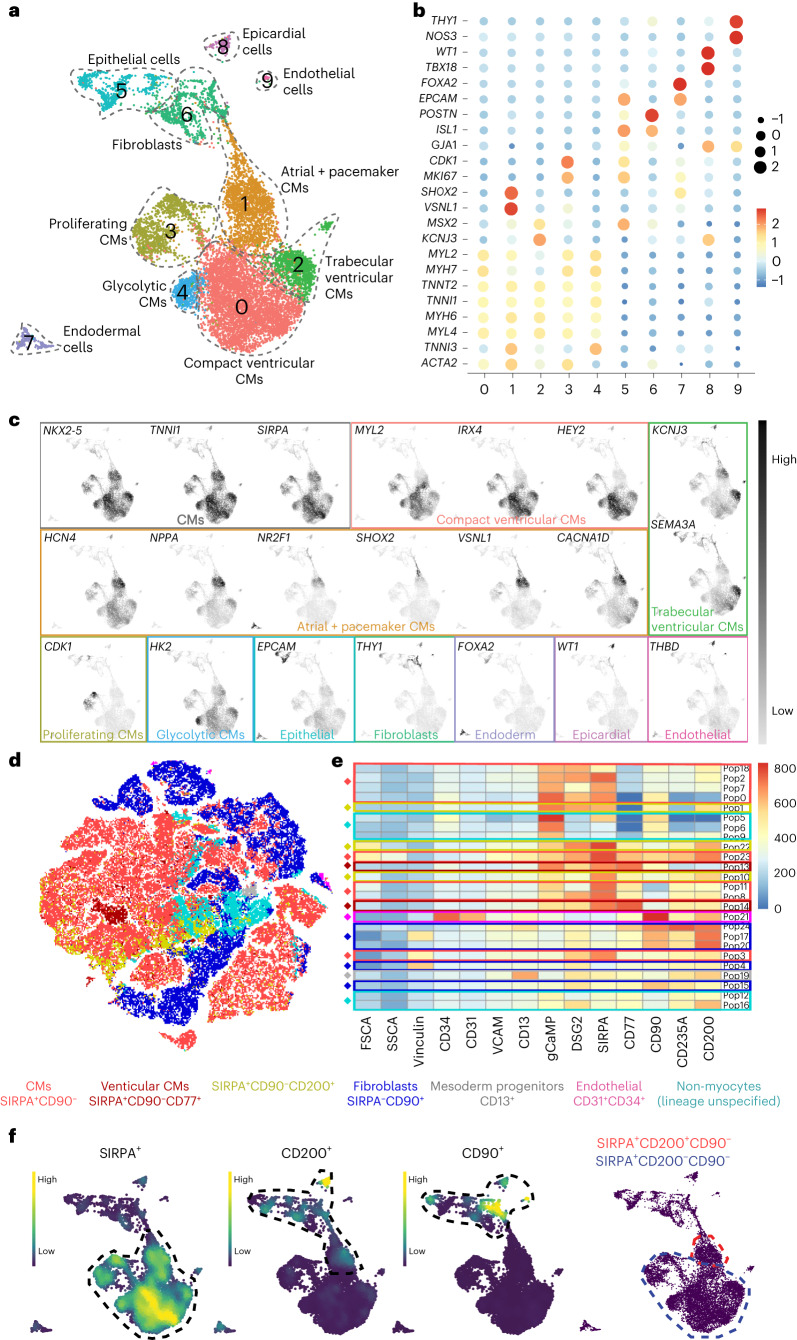
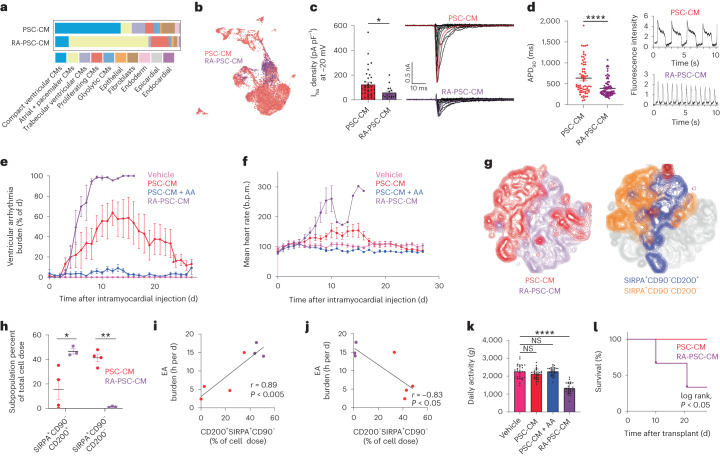
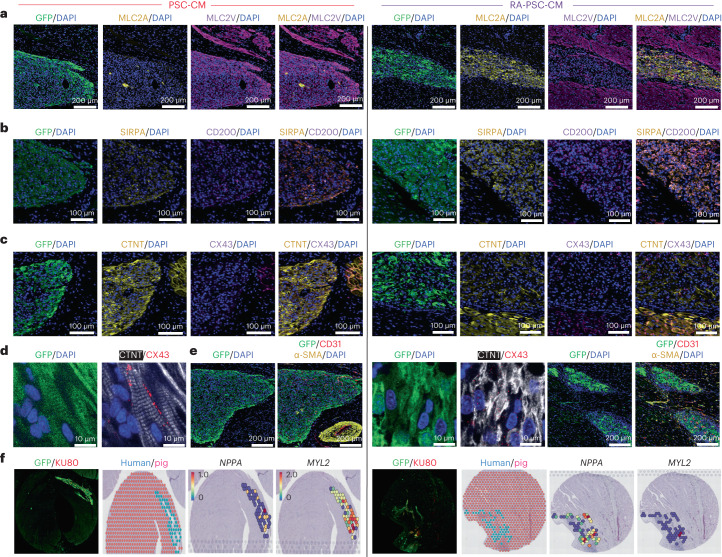
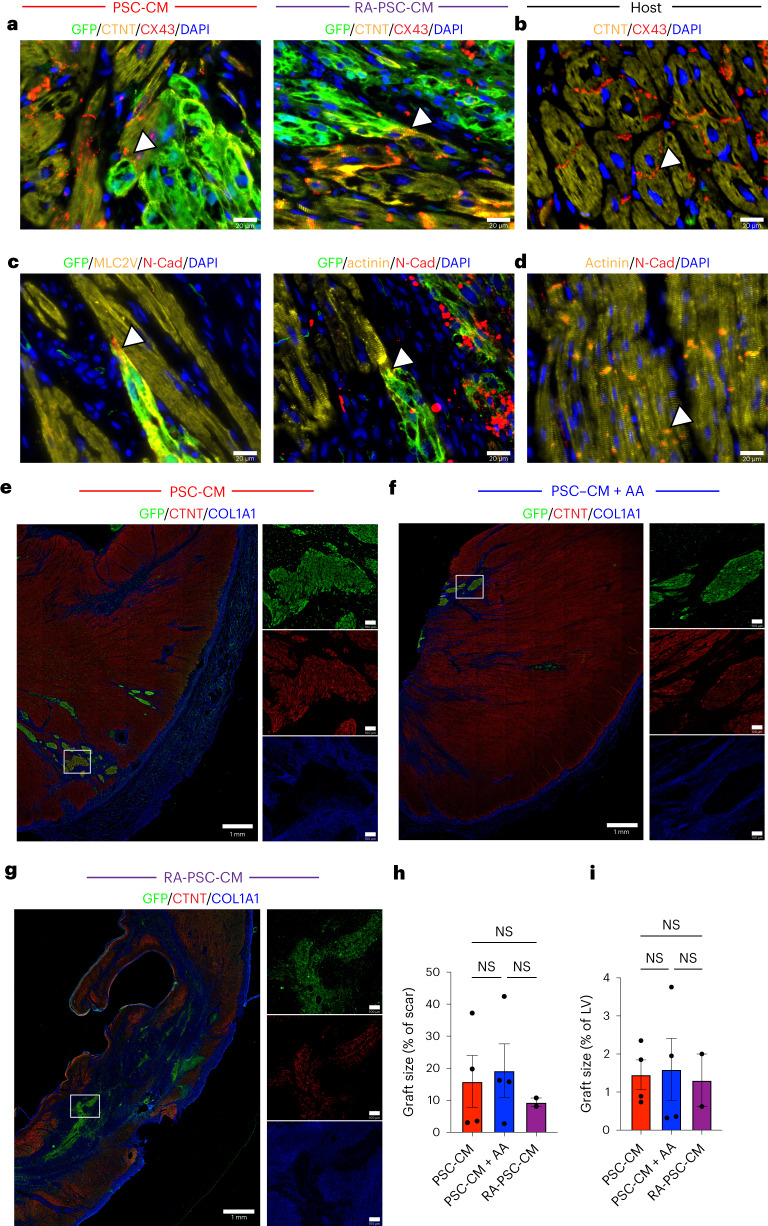
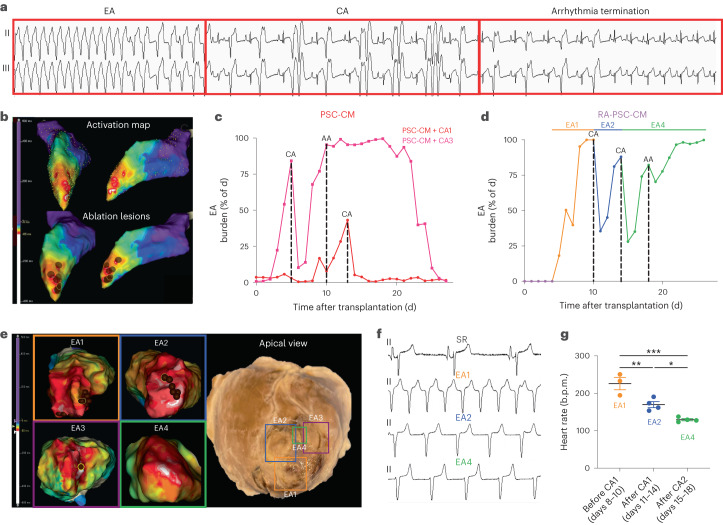
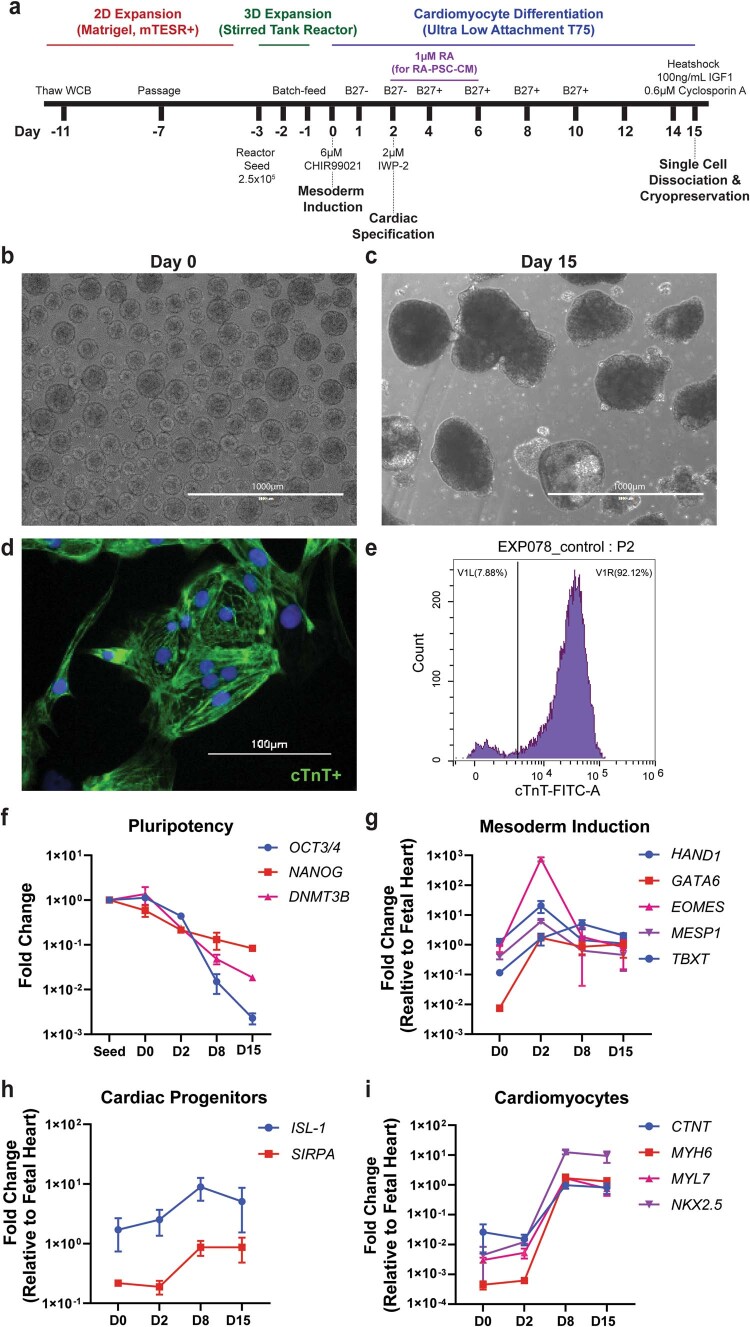
Preclinical data have confirmed that human pluripotent stem cell-derived cardiomyocytes (PSC-CMs) can remuscularize the injured or diseased heart, with several clinical trials now in planning or recruitment stages. However, because ventricular arrhythmias represent a complication following engraftment of intramyocardially injected PSC-CMs, it is necessary to provide treatment strategies to control or prevent engraftment arrhythmias (EAs). Here, we show in a porcine model of myocardial infarction and PSC-CM transplantation that EAs are mechanistically linked to cellular heterogeneity in the input PSC-CM and resultant graft. Specifically, we identify atrial and pacemaker-like cardiomyocytes as culprit arrhythmogenic subpopulations. Two unique surface marker signatures, signal regulatory protein α (SIRPA)+CD90-CD200+ and SIRPA+CD90-CD200-, identify arrhythmogenic and non-arrhythmogenic cardiomyocytes, respectively. Our data suggest that modifications to current PSC-CM-production and/or PSC-CM-selection protocols could potentially prevent EAs. We further show that pharmacologic and interventional anti-arrhythmic strategies can control and potentially abolish these arrhythmias.


Conflict of interest statement

J.J.H.C. reports financial compensation from Novo Nordisk and AstraZeneca related to educational activities and consultancy fees from Implicit Bioscience. All other authors declare no remaining competing interests.

Figures

Fig. 1
Fig. 1. Focal, automatic EAs can be effectively suppressed with pharmacotherapy.
a, Study timeline for phase 1 large-animal experiments in which 19 swine were randomized to four treatment groups (vehicle, vehicle + AA, PSC-CM, PSC-CM + AA) following percutaneously induced MI. A further two animals underwent sham infarction and vehicle injection. BD, twice a day; EPS, electrophysiological study. b, Representative CMR reconstruction (created with ADAS 3D) merged with an epicardial voltage map, used to choose and annotate border and infarct zone injection sites (black circles). BZ, border zone; col, color; img, image; IZ, infarct zone; RZ, remote zone; Uni, unipolar voltage. c, Plot depicting the percentage of time per day that each cell (red), cell and drug (blue) or vehicle (pink) recipient spent in ventricular arrhythmia over the course of the study protocol. d, Representative endocardial activation map during EA localizing arrhythmia origin to focal sites of cell injections (white, early activation; purple, late activation; star, site of earliest activation). e, Representative EA persisting through burst pacing, suggesting an automatic mechanism rather than a re-entrant mechanism. f, Dose-dependent suppression of PSC-CM contraction rate using amiodarone (dark purple) and ivabradine (light purple) in vitro (drug concentrations of 0–100 µM, n = 3 biologically independent experiments for each group, presented as mean ± s.e.m.). g, Telemetry strip from a representative cell recipient exhibiting a run of EA with spontaneous onset and offset. h, Telemetry strip from representative cell and anti-arrhythmic recipients showing a predominantly sinus rhythm with occasional ventricular ectopic beats. ik, Arrhythmia parameters from day 0 to day 28 for each subject, grouped by treatment allocation (vehicle, n = 5; vehicle + AA, n = 4; PSC-CM, n = 5; PSC-CM + AA, n = 5; biologically independent animals; data are presented as mean ± s.e.m.). Significant reduction in arrhythmia burden (i) (**P = 0.008, Mann–Whitney test, two-tailed), number of days with arrhythmia (j) (***P = 0.0002, unpaired t-test, degrees of freedom (df) = 8, two-tailed) and peak arrhythmia heart rate (k) (**P = 0.002, unpaired t-test, df = 8, two-tailed) in cell recipients treated with anti-arrhythmics. Source data
Fig. 2
Fig. 2. Effects of PSC-CM transplantation on cardiac volumes and function.
a, Representative short-axis cine magnetic resonance imaging (MRI) from end-diastolic and end-systolic phases of the cardiac cycle 4 weeks after cell or vehicle injection. Greater ejection of blood in systole was observed for cell recipients than for vehicle recipients, most notably in cell recipients treated with anti-arrhythmic drugs. b, Plot depicting the change in (Δ) scar size from baseline (after MI, before injection) to 4 weeks after injection, with no significant difference between treatment groups (P = 0.93, Kruskal–Wallis test). c, Plot depicting the change in LVEF from baseline (after MI, before injection) to 4 weeks after injection, with significantly improved LVEF in cell and anti-arrhythmic recipients (vehicle versus vehicle + AA, P = 0.32; vehicle versus PSC-CM, P = 0.20; vehicle versus PSC-CM + AA, *P = 0.02; Kruskal–Wallis with Dunn’s multiple-comparison test). dg, Pooled group data of left and right ventricular function at baseline (after MI, before injection) and 4 weeks after injection. The greatest improvement in LVEF (d) was noted in cell and anti-arrhythmic recipients. No significant change in LVEDV (e) was observed between groups (P = 0.76, Kruskal–Wallis test) although there was a significant improvement in LVSV (f) in cell and anti-arrhythmic recipients (vehicle versus vehicle + AA, P > 0.99; vehicle versus PSC-CM, P = 0.60; vehicle versus PSC-CM + AA, *P = 0.04; Kruskal–Wallis with Dunn’s multiple-comparison test). For RVEF (g), there was no significant difference between groups (P = 0.15, Kruskal–Wallis test). All data in bg are presented as mean ± s.e.m. Experiments were conducted in biologically independent animals; vehicle, n = 3; PSC-CM, n = 3; PSC-CM + AA, n = 4; sham, n = 2. Source data
Fig. 3
Fig. 3. PSC-CM cell doses are heterogeneous with arrhythmogenic subpopulations.
a, UMAP embedding of scRNA-seq data from representative samples of cell doses. Ten clusters were identified and annotated based on differential gene expression. b, Dot plot showing expression of representative marker genes used to categorize clusters. c, Nebulosa plots showing the density of specific marker gene expression based on gene-weighted density estimation, demarcating cell type identity to clusters. d, Representative t-SNE plot from a sample of a cell dose analyzed by flow cytometry. FlowSOM meta-clusters overlaid onto the t-SNE plot highlight several discrete subpopulations within the cell fraction, which were identified based on surface marker signatures. e, Heatmap showing relative expression of cell surface markers within each meta-cluster. DSG2, desmoglein 2; FSCA, forward scatter A; pop, population; SSCA, side scatter A; VCAM, vascular cell adhesion molecule. f, Nebulosa plots displaying expression levels of SIRPA, CD200 and CD90. The rightmost panel outlines SIRPA+CD90CD200 CMs, which were negatively associated with arrhythmias, and SIRPA+CD90CD200+ CMs, which were positively associated with arrhythmias. SIRPA+CD90CD200+ CMs comprise atrial and pacemaker CMs (cluster 1), and SIRPA+CD90CD200 CMs encompass all remaining CM clusters (clusters 0, 2, 3 and 4).
Fig. 4
Fig. 4. RA-PSC-CMs are enriched with atrial and pacemaker subpopulations and are highly arrhythmogenic.
a, Contribution of cell subtypes from PSC-CMs and RA-PSC-CMs. b, UMAP plot of PSC-CMs (red) and RA-PSC-CMs (purple). c, Analysis of sodium current densities. Left, maximum current densities recorded at −20 mV in PSC-CMs (n = 35 biologically independent experiments) and RA-PSC-CMs (n = 16 biologically independent experiments) (*P = 0.02, Mann–Whitney test, two-tailed, mean ± s.e.m.). Right, sodium currents (INa) in PSC-CMs and RA-PSC-CMs (inset, voltage protocol). ms, milliseconds; nA, nanoampere. d, Left, action potential duration at 90% depolarization (APD90) in PSC-CMs (n = 68 biologically independent experiments) and RA-PSC-CMs (n = 85 biologically independent experiments) (****P < 0.0001, Mann–Whitney test, two-tailed, mean ± s.e.m.). Right, action potential morphology and beat rates from PSC-CMs and RA-PSC-CMs. e,f, Percentage of time spent in ventricular arrhythmia (e) and mean heart rate per day between groups (f) (mean ± s.e.m.). (*RA-PSC-CM, n = 3 only from day 0 to day 10; n = 1 from day 11 to day 20. Pig 1 in the RA-PSC-CM group died on day 20; pig 2 in the RA-PSC-CM group underwent CA on day 10 with data excluded thereafter; pig 3 in the RA-PSC-CM group died on day 10.). g, High-parameter flow cytometric analysis comparing representative PSC-CM and RA-PSC-CM cell doses. Left, concatenated t-SNE plot showing distribution of cells from a PSC-CM dose (red) and an RA-PSC-CM dose (purple). Right, concatenated t-SNE plot showing distribution of SIRPA+CD90CD200+ and SIRPA+CD90CD200 CMs. h, Proportion of SIRPA+CD90CD200+ and SIRPA+CD90CD200 CMs in PSC-CM or RA-PSC-CM doses (*P = 0.02, ***P = 0.0001; unpaired t-test, df = 5, two-tailed; PSC-CM, n = 4 biologically independent animals; RA-PSC-CM, n = 3 biologically independent animals; mean ± s.e.m.). i,j, Correlation between arrhythmia burden and arrhythmogenic SIRPA+CD90CD200+ CMs (i) (r = 0.89, P = 0.007, Pearson correlation) or non-arrhythmogenic SIRPA+CD90CD200 CMs (j) (r = −0.83, P = 0.02, Pearson correlation) in PSC-CM (red) and RA-PSC-CM (purple) cell doses. k, Total daily activity between groups (g force) (vehicle versus PSC-CM, P = 0.24; vehicle versus PSC-CM + AA, P > 0.99; vehicle versus RA-PSC-CM, ****P < 0.0001; ordinary one-way ANOVA with Dunnett’s multiple-comparison test, n = 28 per group, mean ± s.e.m.). l, Kaplan–Meier survival curve (*P = 0.04, log-rank test). Source data
Fig. 5
Fig. 5. RA-PSC-CM grafts are enriched for atrial myocyte markers and show reduced sarcomeric protein and CX43 organization in comparison to PSC-CM grafts.
a, Representative immunofluorescence images from PSC-CM- and RA-PSC-CM-treated hearts showing that PSC-CM grafts are composed almost entirely of MLC2V+ myocytes, in contrast to RA-PSC-CM grafts, which predominantly contain MLC2A+ myocytes. DAPI, 4,6-diamidino-2-phenylindole. b, Representative immunofluorescence images from PSC-CM- and RA-PSC-CM-treated hearts, showing increased abundance of arrhythmogenic SIRPA+CD200+ myocytes in RA-PSC-CM grafts. c, Low-magnification immunofluorescent images of CTNT and CX43 staining in PSC-CM and RA-PSC-CM grafts, showing increased expression of CTNT in PSC-CM grafts compared to in RA-PSC-CM grafts. In both graft types, CX43 expression is less abundant than in the surrounding pig myocardium. d, High-magnification confocal images of the previous grafts showing highly organized and aligned sarcomeres with appropriate localization of CX43 to the intercalated disks in the PSC-CM graft. By stark contrast, the RA-PSC-CM graft has disorganized CTNT expression, with sporadic expression of CX43. e, Immunofluorescent staining for CD31 and α smooth muscle actin (α-SMA) shows an abundance of neovessels in both PSC-CM and RA-PSC-CM grafts. f, Spatial transcriptomic analysis of PSC-CM and RA-PSC-CM grafts shows reduced expression of the gene encoding atrial natriuretic peptide (NPPA) and increased expression of MYL2 or MLC2v in PSC-CM grafts. This phenotype is reversed in RA-PSC-CM grafts.
Fig. 6
Fig. 6. PSC-CM and RA-PSC-CM graft–host electromechanical coupling and graft size quantification.
a, Representative immunofluorescence images from PSC-CM- and RA-PSC-CM-treated hearts, showing gap junction protein CX43 expression at the intercalated disks between GFP+ graft and host CMs. b, Positive control from host pig myocardium, showing CX43 expression at the intercalated disks. c, Representative immunofluorescence images from PSC-CM- and RA-PSC-CM-treated hearts, showing expression of the cell–cell adhesion protein N-cadherin (N-Cad), at the intercalated disks between GFP+ graft and host CMs. d, Positive control from host pig myocardium, showing N-cadherin expression at the intercalated disks. eg, Representative immunofluorescence images of grafts from PSC-CM (e), PSC-CM + AA (f) and RA-PSC-CM (g) recipients. Insets show magnified single-channel images of GFP, CTNT or collagen type I α1 chain (COL1A1) from the labeled area of the overview image. h, Plot showing graft size as a percentage of infarct area in stained whole-mount sections (PSC-CM, n = 4; PSC-CM + AA, n = 4; RA-PSC-CM, n = 2; biologically independent animals; data are presented as mean ± s.e.m.; P = 0.88, Kruskal–Wallis test). i, Plot showing graft size as a percentage of left ventricular area in stained whole-mount sections (PSC-CM, n = 4; PSC-CM + AA, n = 4; RA-PSC-CM, n = 2; biologically independent animals; data are presented as mean ± s.e.m.; P = 0.64, Kruskal–Wallis test). Source data
Fig. 7
Fig. 7. CA is a feasible and effective EA treatment strategy.
a, Representative rhythm strip showing termination of EA during CA. b, Electroanatomic maps from a representative CA-treated subject. Top, activation map of EA showing anatomic origin of arrhythmia (early activation, white; late activation, purple). Bottom, activation map overlaid with ablation lesions (brown circles) that were delivered at sites of earliest activation, resulting in termination of arrhythmia. c,d, Plots depicting percentage of the day spent in ventricular arrhythmia for PSC-CM (c) or RA-PSC-CM (d) recipients treated with CA. e, Anatomic correlation between endocardial activation maps and extracted heart in an RA-PSC-CM subject. Left, representative activation maps in which four unique EAs were encountered. EA1–EA3 were terminated during CA1 and CA2, with final ablation lesions highlighted (brown circle with yellow outline). EA4 was persistent after CA2 and mapped at terminal EPS. Right, apical view of extracted heart following euthanasia and formalin fixation. Ablation lesions (EA1–EA3) and an island of the surviving cell graft (EA4) are outlined with excellent anatomic correlation with preceding activation maps. f, Representative rhythm strips from an RA-PSC-CM-treated subject of sinus rhythm (SR), EA1, EA2 and EA4. g, Plot depicting daily average heart rate of EA1, EA2 and EA4 in an RA-PSC-CM-treated subject (mean ± s.e.m.). Each new EA was of a significantly slower heart rate than the previously ablated EAs (n = 3 d for each EA; EA1 versus EA2, **P = 0.008; EA1 versus EA4, ***P = 0.0003; EA2 versus EA4, *P = 0.03; ordinary one-way ANOVA with Tukey’s multiple-comparison test). Source data
Extended Data Fig. 1
Extended Data Fig. 1. Stirred tank bioreactor production of PSC-CMs for porcine transplantation experiments.
(a) Schematic depicting PSC-CM stirred tank reactor production protocol. (b) Appearance of cells at day 0 and (c) day 15 of differentiation protocol. (d) Immunostaining for cardiac troponin T demonstrating evidence of cytoskeletal formation in PSC-CMs. (e) Representative flow cytometric evaluation of PSC-CMs quantifying cardiac troponin T expression. (f) qPCR data showing expression profile of pluripotency, (g) mesodermal, (h) cardiac progenitor, and (i) cardiomyocyte markers over time course of differentiation protocol. All data in panels (f-i) is presented as mean ± SEM. n = 5 biologically independent experiments for each marker. Source data
Extended Data Fig. 2
Extended Data Fig. 2. Electrocardiograms demonstrating automatic and re-entrant mechanisms for ventricular arrhythmias from representative cell and vehicle recipients.
(a-c) Electrograms from spontaneous ventricular tachycardia in cell recipient showing characteristics consistent with automatic arrhythmia mechanism. (a) Electrocardiograms from site of earliest activation during spontaneous ventricular tachycardia in cell recipient. Corresponding activation map viewable in Fig. 1d. Electrogram duration=73 ms which is 18% of the ventricular tachycardia cycle length (410 ms). (b) Transient suppression and spontaneous re-initiation of ventricular tachycardia in cell recipient. (c) Instant capture during left ventricular pacing, followed by instant continuation of ventricular tachycardia. Post-pacing interval – tachycardia cycle length ~ 114 ms. (d-e) Electrograms from induced ventricular arrhythmia in vehicle recipients showing characteristics consistent with re-entrant arrhythmia mechanism. (d) Initial fusion evident at onset of right ventricular overdrive pacing during induced ventricular tachycardia. (e) Clean resumption of tachycardia after overdriving pacing. Post-pacing interval – tachycardia cycle length ~ 90 ms.
Extended Data Fig. 3
Extended Data Fig. 3. Subdivision of cardiomyocyte cluster 1 into atrial-like and pacemaker-like clusters.
(a) UMAP plot showing subdivision of cluster 1 into atrial (0, orange) and pacemaker (1, blue) subclusters, with expression of cluster specific genes, NPPA and SHOX2, inset. (b) Relative expression of SIRPA, CD200, and CD90 in cluster 1, indicating the presence of SIRPA + /CD200 + /CD90 arrhythmogenic PSC-CMs predominantly in the atrial sub-cluster. (c) List of GO terms for differentially expressed genes between atrial and pacemaker subclusters. The Fisher’s exact test was used to determine statistical significance.
Extended Data Fig. 4
Extended Data Fig. 4. Correlation scatter plots demonstrating strength of linear association between flow cytometry derived subpopulation quantification or histologically determined graft size and resultant arrhythmia burden for each PSC-CM (red) and RA-PSC-CM (purple) cell dose.
(a) Arrhythmogenic cardiomyocytes, SIRPA+CD90CD200+ (b) Non-arrhythmogenic cardiomyocytes, SIRPA+CD90CD200 (c) Cardiac troponin T positive cells (d) Cardiac troponin T negative cells (e) Cardiomyocytes, SIRPA+CD90 (f) Committed ventricular cardiomyocytes, CD77+CD200 (g) Fibroblasts, CD90+ (h) Endothelial cells, CD31+CD34+ (i) Non-myocytes (j) Mesodermal progenitors, CD13+ (k) Graft size as percentage of infarct area in stained section (l) Graft size as percentage of left ventricular area in stained section. Pearson correlation reported in all panels. Source data
Extended Data Fig. 5
Extended Data Fig. 5. Stirred tank bioreactor generation and characterisation of RA-PSC-CMs.
(a) Appearance of PSC-CM and RA-PSC-CMs at day 15 of bioreactor differentiation protocol. (b) Cardiac troponin T expression (*p = 0.04, unpaired T test, two-tailed, n = 12 biologically independent experiments, mean ± SEM). and aggregate beat rate comparison between PSC-CMs and RA-PSC-CMs (***p = 0.0009, unpaired T test, two-tailed, n = 6 biologically independent experiments, mean ± SEM). (c) qPCR quantified expression of general cardiomyocyte (* p = 0.02, unpaired T test, two-tailed, n = 3 biologically independent experiments, mean ± SEM), (d) ventricular (* p = 0.04, ***p = 0.001, unpaired T test, two-tailed, n = 3 biologically independent experiments, mean ± SEM), (e) atrial (*p = 0.04, unpaired T test, two-tailed, n = 3 biologically independent experiments, mean ± SEM), and (f) pacemaker cardiomyocyte markers (* p = 0.04, unpaired T test, two-tailed, n = 3 biologically independent experiments, mean ± SEM). Source data
Extended Data Fig. 6
Extended Data Fig. 6. Additional PSC-CM and RA-PSC-CM graft histology.
(a) Representative immunofluorescence images from additional PSC-CM and RA-PSC-CM treated hearts, showing PSC-CM grafts are composed almost entirely of MLC2v+ myocytes, in contrast to RA-PSC-CM grafts, which predominantly contain MLC2a+ myocytes. (b) Representative immunofluorescence images from PSC-CM and RA-PSC-CM treated hearts, showing increased abundance of arrhythmogenic SIRPA+/CD200+ myocytes in RA-PSC-CM grafts. (c) Low magnification immunofluorescent images of cardiac troponin T (cTnT) and connexin 43 (Cx43) staining in PSC-CM and RA-PSC-CM grafts, showing increased expression of cTnT in PSC-CM grafts compared to RA-PSC-CM. In both graft types, Cx43 expression is less abundant than in the surrounding pig myocardium. (d) Immunofluorescent staining for CD31 and alpha smooth muscle actin shows an abundance of neovessels in both PSC-CM and RA-PSC-CM grafts.
Extended Data Fig. 7
Extended Data Fig. 7. Spatial transcriptomic assessment of PSC-CM and RA-PSC-CM grafts.
(a) Heat map of differentially expressed genes in PSC-CM (outlined by red box) and RA-PSC-CM grafts (outlined by purple box). (b) Comparing transcriptional signatures between spatially defined human, pig, and interfaced spots between RA treated and standard treated samples. Left - Differential expression of genes for human cells in human spots. (c) Differential expression of genes for pig cells in human-like interfaced spots. (d) Differential expression of genes for human cells in human-like interfaced spots. (b-d) edgeR pipeline was followed to conduct differential gene expression tests, by performing library size normalization and the quasi-likelihood test. Genes with adjusted p values less than 0.05 were considered significant (e) Data driven spatial mapping of human (cyan) and pig (red) tissue regions across one PSC-CM and one RA-PSC-CM recipient with unbiased identification of the interfaced spots between the grafted human cells and host pig cells. The interfaced spots (purple) are those with predominantly pig genes nearest to human spots.
Extended Data Fig. 8
Extended Data Fig. 8. Extended spatial transcriptomic analysis of PSC-CM and RA-PSC-CM grafts, and surrounding pig myocardium.
(a) Separation of human and pig spots by principal component analysis, using all genes as input. (b) Thresholding for human spots ( > 50 human genes) highly correlates with immunofluorescent staining of GFP+ human PSC-CM graft. (c) Unbiased clustering of human PSC-CM and RA-PSC-CM (d) spots and relative expression of cardiomyocyte-associated and other relevant genes (e). (f) Pseudobulk differential gene expression between PSC-CM and RA-PSC-CM graft shows upregulation of pan-cardiomyocyte and ventricular genes (ACTN2, TNNI1, TNN13, MYH7, MYL2) in PSC-CM graft and upregulation of atrial and pacemaker associated genes, calcium handling, and extracellular matrix genes (NPPA, MYH6, CALM2, ELN) in RA-PSC-CM graft. g) Integrated analysis/deconvolution of spatial transcriptomic and scRNAseq datasets shows location of cell subclusters within PSC-CM and RA-PSC-CM grafts. (h) The test of equal or given proportions confirmed the presence of engraftment arrhythmia-causing atrial and pacemaker-like subcluster myocytes were found to be located entirely within the RA-PSC-CM graft.
Extended Data Fig. 9
Extended Data Fig. 9. Flow cytometric and scRNA-seq profiling of PSC-CM cell dose with insufficient resultant engraftment arrhythmia burden to undergo pre-planned catheter ablation procedure.
(a) Engraftment arrhythmia burden of PSC-CM + CA #2 following cell transplantation. (b) Bar plot depicting proportion of arrhythmogenic SIRPA+CD90CD200+ and non-arrhythmogenic SIRPA+CD90CD200- cardiomyocytes for each subject in catheter ablation treatment group. (c) scRNAseq analysis of cell dose received by PSC-CM + CA #2. (d) Whole-mount cross-section of RA-PSC-CM + CA subject. Engrafted human cardiomyocytes expressed cardiac troponin T (red) and the human-specific anti-nuclear antigen Ku80 (brown). Scarred myocardium, either from percutaneous myocardial infarction or catheter ablation, was identified with aniline blue counterstaining. (e) A small region of surviving human cardiomyocyte graft responsible for residual arrhythmias was identified (high magnification image of boxed region from panel (d)). Source data
Extended Data Fig. 10
Extended Data Fig. 10. High parameter flow cytometry analysis workflow.
(a) Steps involved in preparing data, (b) generating tSNE plot and overlaying with FlowSOM clusters, and (c) identifying and quantifying subpopulations.

References

    1. Laflamme, M. A. & Murry, C. E. Heart regeneration. Nature473, 326–335 (2011). 10.1038/nature10147 - DOI - PMC - PubMed
    1. Nguyen, P. K., Rhee, J.-W. & Wu, J. C. Adult stem cell therapy and heart failure, 2000 to 2016: a systematic review. JAMA Cardiol.1, 831–841 (2016). 10.1001/jamacardio.2016.2225 - DOI - PMC - PubMed
    1. Fisher, S. A., Doree, C., Mathur, A., Taggart, D. P. & Martin-Rendon, E. Stem cell therapy for chronic ischaemic heart disease and congestive heart failure. Cochrane Database Syst. Rev.12, CD007888 (2016). - PMC - PubMed
    1. Menasché, P. Cell therapy trials for heart regeneration — lessons learned and future directions. Nat. Rev. Cardiol.15, 659–671 (2018). 10.1038/s41569-018-0013-0 - DOI - PubMed
    1. Eschenhagen, T. et al. Cardiomyocyte regeneration: a consensus statement. Circulation136, 680–686 (2017). 10.1161/CIRCULATIONAHA.117.029343 - DOI - PMC - PubMed

Publication types

MeSH terms

LinkOut - more resources