. 2024 Jun;3(6):734-753.
doi: 10.1038/s44161-024-00487-z. Epub 2024 Jun 14.

Semaphorin-3A regulates liver sinusoidal endothelial cell porosity and promotes hepatic steatosis

Affiliations

Semaphorin-3A regulates liver sinusoidal endothelial cell porosity and promotes hepatic steatosis

Daniel Eberhard et al. Nat Cardiovasc Res. 2024 Jun.

Abstract

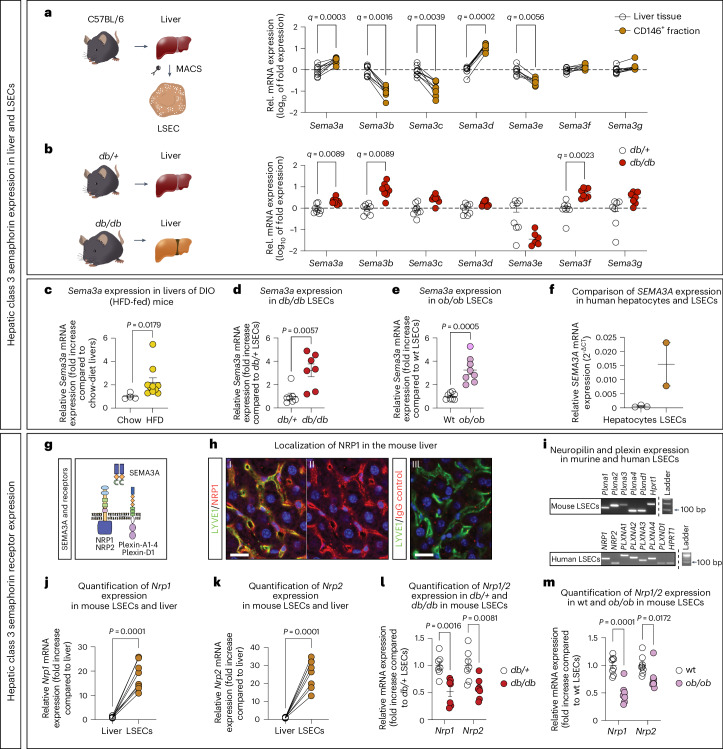
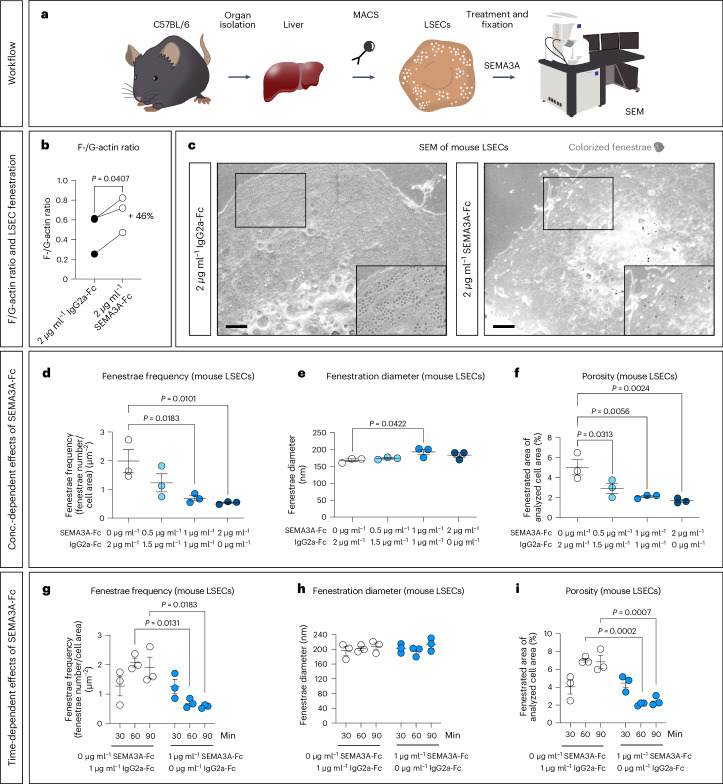
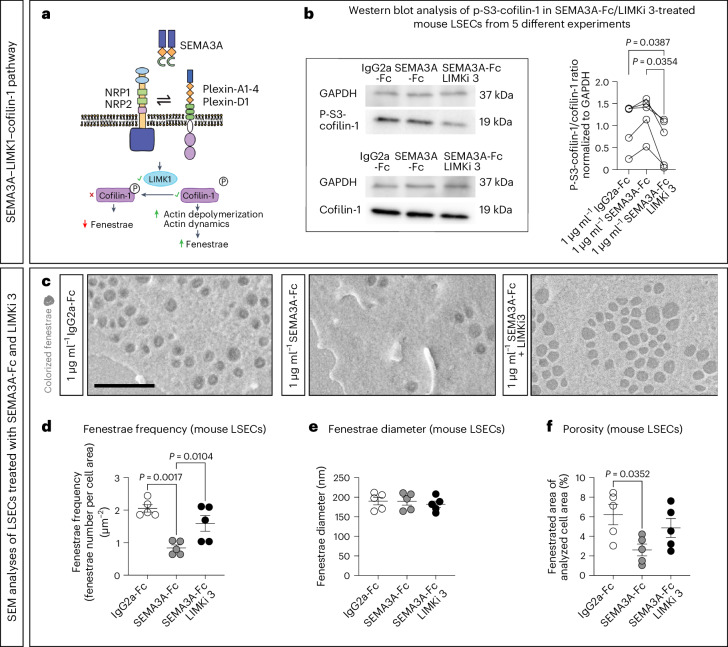
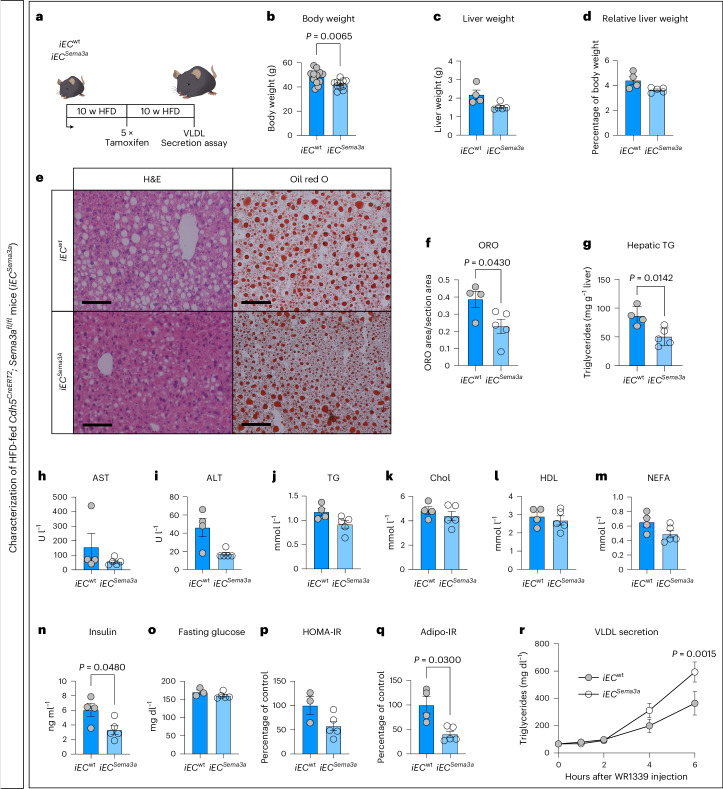
Prevalence of metabolic dysfunction-associated steatotic liver disease (MASLD), formerly known as non-alcoholic fatty liver disease, increases worldwide and associates with type 2 diabetes and other cardiometabolic diseases. Here we demonstrate that Sema3a is elevated in liver sinusoidal endothelial cells of animal models for obesity, type 2 diabetes and MASLD. In primary human liver sinusoidal endothelial cells, saturated fatty acids induce expression of SEMA3A, and loss of a single allele is sufficient to reduce hepatic fat content in diet-induced obese mice. We show that semaphorin-3A regulates the number of fenestrae through a signaling cascade that involves neuropilin-1 and phosphorylation of cofilin-1 by LIM domain kinase 1. Finally, inducible vascular deletion of Sema3a in adult diet-induced obese mice reduces hepatic fat content and elevates very low-density lipoprotein secretion. Thus, we identified a molecular pathway linking hyperlipidemia to microvascular defenestration and early development of MASLD.


Conflict of interest statement

M.R. receives consultation fees from AstraZeneca, Boehringer Ingelheim, Echosens, Madrigal Pharmaceuticals, MSD Sharp & Dohme, Novo Nordisk, Target RWE. The other authors declare no competing interests.

Figures

Fig. 1
Fig. 1. Sema3a/SEMA3A is expressed in LSECs and increased in mice with hepatic steatosis.
a, Sema3a-g mRNA expression (log10 fold change) in LSECs compared to total liver of 14-week-old male C57BL/6 wild-type (wt) mice (n = 8, n = 7 for Sema3e). Lines indicate the same mouse. b, Sema3a-g mRNA expression (log10 fold change, log(0) values are not displayed) in liver tissue of 12-week-old db/db mice, compared to db/+ controls (RT–qPCR; n = 8 each). A multiple two-tailed paired (a) or unpaired (b) Student’s t-test was used to discover significant effects. Discoveries are indicated by q values in a,b. c, Sema3a mRNA expression in liver tissue from standard chow-fed (n = 4, RT–qPCR) versus HFD-fed (n = 10) littermates. d, Sema3a mRNA expression of LSECs from 12-week-old male db/+ control versus db/db mice (n = 7 each). e, Sema3a mRNA expression of LSECs from 12-week-old male wt control versus ob/ob mice (n = 8 each). f, Relative Sema3a mRNA expression in hepatocytes and LSECs isolated from three and two human donors, respectively (RT–qPCR). g, Graphical overview of SEMA3A and its known receptors. h, Representative immunofluorescent staining for (I and II) neuropilin-1 (red, NRP1), (I and III) LYVE1 (green) and (III) goat IgG isotope control (red) of liver sections of C57BL/6 wt mice (n = 2 mice). Scale bars, 20 µm. i, Agarose gel with PCR products (RT–PCR) showing the expression of several SEMA3A receptors in primary mouse (n = 2 LSEC isolation) and human LSECs (male LSEC donor QC-12B15F11). Brightness and contrast have been adjusted to enhance visibility in h,i. j,k, Nrp1 (j) and Nrp2 (k) mRNA expression in LSECs compared to total liver from 14-week-old male C57BL/6 wt mice (n = 8 each). l,m, Nrp1 and Nrp2 mRNA expression in LSECs from db/db (l; n = 7) and ob/ob mice (m; n = 8) in comparison to controls. A two-tailed unequal variances t-test was used (ce,l,m) and two-tailed paired t-test (j,k). Data are presented as mean ± s.e.m. CD146+ LSECs were isolated by MACS or FACS after MACS (d,e,l,m) to get an even higher purity of cells. Source data
Fig. 2
Fig. 2. SEMA3A expression is upregulated in human LSECs after treatment with palmitic acid.
a,b, SEMA3A-G mRNA expression in primary human LSECs (male donor QC-12B15F11) treated for 18 h with BSA control (n = 4 wells) versus 0.75 mM palmitic acid (n = 5 wells) (a) or oleic acid versus BSA controls (n = 6 wells each) (b). cf, Expression of SEMA3A in primary human LSECs after treatment with BSA control (n = 4 palmitic acid-, n = 6 oleic acid-treated wells) versus 0.25 mM (n = 5, n = 6 wells), 0.5 mM (n = 4, n = 6 wells) and 0.75 mM (n = 5, n = 6 wells) BSA-bound palmitic acid (c) or oleic acid (e). Expression of SEMA3A in primary human LSECs treated with BSA controls (n = 4 wells each), 0.5 mM palmitic acid (d) or oleic acid (f) for 2 h (n = 5 wells each), 6 h (n = 6, n = 5 wells), 18 h (n = 4, n = 5 wells) and 24 h (n = 5 wells each). A multiple two-tailed unpaired t-test with a two-stage step-up method was used to discover outstanding effects, as indicated by q values in a,b. A one-way ANOVA with Dunnett’s post hoc test was used to test for statistical significance in cf. In all graphs individual data points and mean ± s.e.m. are presented. Source data
Fig. 3
Fig. 3. SEMA3A defenestrates LSECs in a concentration- and time-dependent manner.
a, General workflow for LSEC experiments. b, F-actin/G-actin quantification in lysates from LSECs treated with IgG2a-Fc or SEMA3A-Fc (n = 3 independent LSEC isolations). c, Representative SEM images of LSECs treated for 1 h with SEMA3A-Fc and/or IgG2a-Fc. Brightness and contrast have been adjusted to enhance visibility. The fenestrae were colorized with a digital charcoal pencil for better visualization. Scale bars, 2 µm. df, Analysis of fenestrae frequency (d), diameter (e) and porosity (f) of LSECs treated for 1 h with SEMA3A-Fc and/or IgG2a-Fc concentrations as indicated (n = 3 independent experiments). The 1 µg ml−1 SEMA3A-Fc values are from the experiment shown below. gi, Analysis of fenestrae frequency (g), diameter (h) and porosity (i) of LSECs treated with 1 µg ml−1 SEMA3A-Fc or IgG2a-Fc for 30, 60 or 90 min (n = 3 independent LSEC isolations). For statistical analysis a two-tailed paired Student’s t-test was performed in b, a one-way ANOVA with multiple comparisons (Dunnett’s post hoc test) in df and a two-way ANOVA with multiple comparisons (Tukey’s post hoc test) in gi. For each condition, at least five images (taken from different LSECs) per experiment were analyzed. In all graphs data points and mean ± s.e.m. are presented. Source data
Fig. 4
Fig. 4. Blocking NRP1 reduces SEMA3A-induced LSEC defenestration that involves activation of multiple kinases.
a, Schematic illustration of the NRP1 receptor and the binding sites of the anti-NRP1VEGF, anti-NRP1SEMA3A or anti-NRP1pan antibodies. b, SEM images of LSECs first treated with anti-NRP1VEGF, anti-NRP1SEMA3A or anti-NRP1pan for 1 h and subsequently with either SEMA3A-Fc or IgG2a-Fc for 1 h. Brightness and contrast have been adjusted to enhance visibility. The fenestrae were colorized with a digital charcoal pencil for better visualization. Scale bar, 500 nm. ce, Analysis of fenestrae frequency (c), diameter (d) and porosity (e) of LSECs that were first treated with either anti-NRP1VEGF, anti-NRP1SEMA3A or anti-NRP1pan for 1 h, and subsequently treated with either SEMA3A-Fc or IgG2a-Fc for 1 h. For statistical analysis a two-way ANOVA with multiple comparisons (Tukey’s post hoc test) was performed. For each condition, at least five images (taken from different LSECs) were analyzed per experiment (n = 5 independent LSEC isolations). In all graphs data points and mean ± s.e.m. are presented. f, Kinase activity profiling after UKA with a median final score of >1.2 taken as the threshold cutoff. For this assay, MACS-isolated mouse LSECs were treated with 1 µg ml−1 SEMA3A-Fc or IgG2a-Fc for 10 min. The data are visualized using a CORAL Kinome tree, where the color of a branch indicates the kinase family, the node color indicates the kinase statistic and the node size indicates the mean final score (mean specificity score + mean significance score). TK, tyrosine kinase group; CMGC, CDK, MAPK, GSK and CK2 kinase group; TKL, tyrosine kinase-like (TKL) group; STE, STE group kinases; CK1, casein kinase 1; AGC, protein kinase A, G and C group; CAMK, calcium/calmodulin-regulated kinase group; ABC1, ABC1 domain containing kinase; Alpha, alpha kinase group; Brd, bromodomain proteins; PDHK, pyruvate dehydrogenase kinase group; PIKK, phosphatidyl inositol 3′ kinase-related kinase group; RIO, RIO kinase group; TIF1, transcriptional intermediary factor 1. Source data
Fig. 5
Fig. 5. LIMK1 activity is required for SEMA3A-induced defenestration of mouse LSECs.
a, Schematic illustration of SEMA3A signaling. Upon SEMA3A binding to NRP1, NRP1 forms a holoreceptor complex with a plexin, which acts as the signal-transducing unit. Through a signaling cascade, LIMK1 is activated and catalyzes the phosphorylation of cofilin-1. Cofilin-1 is an actin depolymerization factor, which is de-activated upon phosphorylation at its serine 3 (S3). Thus, less actin is depolymerized, resulting in a less dynamic actin network and, subsequently, fewer fenestrae. b, Western blots of mouse LSEC protein lysates (n = 5 independent LSEC isolations). LSECs were pretreated with either DMSO or LIMKi 3, a LIMK1 inhibitor, and then treated with either SEMA3A-Fc or IgG2a-Fc. For the analysis, cofilin-1 and p-S3-cofilin-1 were normalized to GAPDH and then put into relation of each other (p-S3-cofilin-1 to cofilin-1). c, Representative SEM images of mouse LSECs pretreated with either DMSO or LIMKi 3 and then treated with either SEMA3A-Fc or IgG2a-Fc. The fenestrae were colorized with a digital charcoal pencil for better visualization. Scale bar, 1 µm. Brightness and contrast have been adjusted to enhance visibility in b,c. df, Analyses of fenestrae frequency (d) and diameter (e) as well as porosity (f) of mouse LSECs pretreated with LIMKi 3 or DMSO and subsequently treated with SEMA3A-Fc or IgG2a-Fc, as indicated. For each condition, ten images (taken from different LSECs) were analyzed (n = 5 LSEC isolations). For statistical analysis, a one-way ANOVA with multiple comparisons (Tukey’s post hoc test) was performed in b,df. In all graphs, data points and mean ± s.e.m. are presented. Source data
Fig. 6
Fig. 6. Opposing effects of Sema3a deletion and Lepr mutation on LSEC porosity.
a, SEM images of liver sinusoids in 29-week-old male control and Sema3a+/− mice kept on chow diet. Scale bars, 1 µm. bd, Analysis of fenestrae frequency (b), diameter (c) and LSEC porosity (d) in liver sinusoids from Sema3a+/− and control (wt) mice (n = 5 mice per genotype). e, SEM images of liver sinusoids in 10-week-old male db/+ and db/db mice. Scale bars, 1 µm. fh, Analysis of fenestrae frequency (f), diameter (g) and LSEC porosity (h) in liver sinusoids of db/+ (control) and db/db mice (n = 5 mice per genotype). i,j, Body weight (i) and blood glucose concentration (j) of db/+ versus db/db mice (n = 5 mice each). k, Correlation matrix showing Pearson correlation coefficients for pairwise comparisons between the following variables: body weight, blood glucose and LSEC porosity in the combined cohort of db/+ and db/db mice. For statistical analysis in bj, a two-tailed unequal variances t-test was performed. In all graphs individual data points and mean ± s.e.m. are presented. Source data
Fig. 7
Fig. 7. Lower hepatic fat content in DIO iECSema3a mice compared to DIO iECwt mice.
Analysis of Cdh5-CreERT2 × Sema3afl/fl (iECSema3a) and Cdh5-CreERT2 (iECwt) mice kept on HFD for 20 weeks (with tamoxifen injections on 5 consecutive days after 10 weeks of HFD). a, Experimental plot. b, Body weight (BW). c, Liver weight. d, Relative liver weight (% of BW). e, H&E and ORO staining of liver sections. Scale bars, 100 µm. f, Densitometric quantification of liver ORO staining. g, Hepatic TGs. hm, Transaminase and serum lipid profile (AST (h), ALT (i), TG (j), total cholesterol (Chol; k), high-density lipoprotein (HDL; l) and FFA/NEFA (m)). AST/ALT values displayed as ‘under 15 U l−1’ were defined as 15 U l−1. n, Serum insulin. o, Fasting blood glucose. p, HOMA-IR. q, Adipo-IR. n = 12 iECwt and n = 11 iECSema3a mice (b); n = 4 iECwt and n = 5 iECSema3a mice (cn,q); n = 3 iECwt and n = 5 iECSema3a mice (o,p) analyzed after 20 weeks of HFD (10 weeks after Sema3a deletion by tamoxifen). r, Measurement of VLDL (TG) secretion after injection of WR1339 (n = 12 iECwt and n = 11 iECSema3a mice per genotype) after 18 weeks of HFD (around 8 weeks after Sema3a deletion by tamoxifen). For statistical analysis, two-tailed unequal variances t-tests were performed in bq. A repeated measures two-way ANOVA with a Sidak’s post hoc test was used to test for statistical significance in r. In all graphs, individual data points and mean ± s.e.m. are presented. Source data
Fig. 8
Fig. 8. Model.
Left side: in the setting of low physiological SEMA3A levels (as is the case at low concentrations of saturated fatty acids and normal BW without T2D), active cofilin-1 and normal F-actin cytoskeleton dynamics contribute to maintain a high frequency of fenestrae in LSECs. LSEC porosity facilitates bidirectional exchange of lipids between bloodstream and hepatocytes, such as the release of VLDL particles from hepatocytes into the blood circulation. Right side: in the setting of high SEMA3A levels (as is the case at high concentrations of FFAs and in DIO with or without T2D), the angiocrine signal SEMA3A acts via NRP1 on LSECs to activate multiple STKs, including LIMK1, which phosphorylates cofilin-1 to reduce F-actin cytoskeleton dynamics and fenestrae frequency as well as LSEC porosity. The reduced LSEC porosity lowers VLDL export from the hepatocytes into the blood and might contribute to lipid retention and macrovesicular steatosis in the hepatocytes. The resulting hepatic steatosis is an early event in MASLD that can subsequently (in concert with hepatic stellate cells; HSCs) progress to severe hepatic and cardiometabolic diseases. The figure was created with BioRender.com. Source data
Extended Data Fig. 1
Extended Data Fig. 1. Efficient LSEC isolation from the mouse liver by MACS.
a, After isolating CD146-positive liver cells (termed ‘LSEC’) by MACS, cells were allowed to grow for 4 h prior to SEM analysis. Example images are shown for MACS-isolated cells. b, Non-fenestrated CD146-positive liver cells (scale bar = 1 µm). c, Fenestrated CD146-positive liver cells (scale bar = 2 µm). d, e, Enlargement of regions indicated in (b) and (c) (scale bars = 2 µm). For statistical analysis, a two-tailed unequal variance t-test was performed (n = 3 independent LSEC isolations; for each isolation, 60 cells were randomly chosen and analyzed). Individual data points and mean ± SEM are presented. Source data
Extended Data Fig. 2
Extended Data Fig. 2. Upregulation of SEMA3A in primary human LSEC by palmitic acid and forskolin.
a, SEMA3A mRNA expression in primary human LSEC (female donor; QC-29B15F09) treated for 24 h with 0.5 mM palmitic acid (n = 2 independent experiments, left n = 3, and right n = 6 wells per condition). b, Graphical overview of transcription factor (TF) binding sites predicted by CiiiDER (upper panel) and selected binding sites for CREB1, PPARs, and SREBFs (lower panel). c, SEMA3A mRNA expression in primary human LSEC (male donor; QC-12B15F11) treated with 100 µM forskolin (FSK) for 2, 4, and 6 h compared to DMSO-treated cells (n = 3 independent experiments). d, SEMA3A mRNA expression in HepG2 cells and primary human LSEC (male donor QC-12B15F11) after treatment with 100 µM FSK or DMSO for 6 h (n = 3 independent experiments). A two-tailed unequal variances t-test was used to test for statistical significance in (a). A one-way ANOVA with Dunnett´s post hoc test (c) and two-way ANOVA with Tukey´s post hoc test (d) were also used to test for statistical significance. In all graphs individual data points and mean ± SEM are presented. Source data
Extended Data Fig. 3
Extended Data Fig. 3. LSEC control experiments and deep learning workflow for quantification of LSEC porosity.
a, Effect of different SEMA3A-Fc concentrations on LSEC size. Cells were cultured for 4 h, starved for 1 h, and treated with SEMA3A-Fc for 1 h. After fixation, phalloidin was used to stain F-actin fibers, and DAPI was used to stain cell nuclei. Cells were imaged using an Axioscope (Zeiss) and the NIS-Elements imaging software, and 10 images of each condition were obtained and analyzed using the Fiji image processing package. Per image, the cell size of at least 26 cells was measured. b, The CellTiter-Glo® Cell Viability Assay (Promega) was performed after SEMA3A-Fc treatment of isolated LSECs to determine the amount of ATP present (n = 3 independent LSEC isolations). c, Mouse LSEC were isolated and cultured in EBM-2 media for 1, 2 or 24 h, after 4 h pre-culture. Fenestrae were analyzed for their frequency and diameter; LSEC porosity was also determined. For each condition, 10 images (taken from different LSECs) were analyzed per experiment (n = 3 independent LSEC isolations). d, LSECs were isolated and incubated in EBM-2 media for 4 h. An arrow points to a potential magnetic bead located within a fenestra. Scale bars = 400 nm (left) and 100 nm (right, n = 1 LSEC isolation). e, Correlation analyses of 30 images that were analyzed either manually or using a deep learning workflow, for fenestrae frequency, fenestrae diameter and LSEC porosity. Each dot represents one image analyzed. f, Example image of LSEC pre- and post-processing (output file) as received by the deep learning workflow, scale bars = 2 µm. A one-way ANOVA with multiple comparisons was used for statistical analysis, and statistical significance was corrected for multiple comparisons using a Dunnett´s post hoc test in (a) and (b), and a one-way ANOVA with a Tukey´s post hoc test was used to test for statistical significance in (c). In graphs (a-c) individual data points and mean ± SEM are presented. Source data
Extended Data Fig. 4
Extended Data Fig. 4. Lower hepatic fat content in chow-fed Sema3a +/- mice compared to controls.
a, Sema3a expression in the liver and CD146-positive LSEC from male Sema3a +/- mice and controls at the age of 14 weeks (n = 6 Sema3a +/- and n = 8 Wt mice). b, Body weight (BW). c, Liver weight. d, Relative liver weight (% of BW). e, H&E, Picro-Sirius Red (PSR) and Oil Red O (ORO) staining; scale bars = 100 µm. f, Densitometric quantification of ORO staining on liver sections. g, Hepatic triglycerides (TG). h, RT-qPCR analysis of genes involved in lipid metabolism in liver tissue from fasted mice. Please note that male, chow-fed 35–38-week-old mice (fasted for 4 h) were used for (b-h, n = 7 Wt and n = 6 Sema3a +/- mice). i-n, Serum transaminase and lipid profile, that is AST, ALT, TG, total cholesterol (Chol), HDL, non-esterified fatty acids (NEFA) and o, Serum insulin. p, Fasting blood glucose concentration. q, HOMA-IR and r, Adipo-IR as measured in serum from 25–30−week-old mice (i-o,r, n = 8 Wt/n = 7 Sema3a +/-; p, q, n = 7 per genotype). AST/ALT values displayed as ‘under 15’ were defined as 15 U/L. A repeated measures two-way ANOVA with Sidak´s post hoc test was used to test for statistical significance in (a), and a two-tailed unequal variances t-test was performed in (b-r). In all graphs, individual data points and mean ± SEM are presented. Source data
Extended Data Fig. 5
Extended Data Fig. 5. Analysis of in vivo LSEC porosity and targeted lipidomics.
a, Representative images of SEM input images (upper panels), calculated probability maps using a machine-learning based approach (WEKA segmentation, middle panels), and outlines (lower panels) used to quantify fenestrae diameter as well as fenestrae frequency, scale bar = 2 µm for the input image (left); 500 nm for the magnification (right). b, Liver ceramide (Cer) and c, Liver diacylglycerol (DAG) profile of chow-fed 35–38-week-old male mice (n = 7 Wt and 6 Sema3a +/- mice). d, Liver Cer and e, Liver DAG profile of diet-induced obese (DIO) control and DIO Sema3a +/- mice kept on a HFD for 20 weeks (n = 7 mice of each genotype). f, Liver Cer and g, Liver DAG profile of DIO iECSema3a and DIO iECwt mice kept on HFD for 20 weeks (with tamoxifen injections after 10 weeks of HFD; n = 4 iECwt and 5 iECSema3a mice). For statistical analysis a two-tailed unequal variances t-test was performed. In all graphs, individual data points and mean ± SEM are presented. Source data
Extended Data Fig. 6
Extended Data Fig. 6. Lower hepatic fat content in diet-induced obese (DIO) Sema3a +/- mice.
a, Experimental plot; b, Body weight; c, Body composition; d, Relative body fat (% of BW) in male DIO wild-type and DIO Sema3a +/- mice, both kept on a HFD for 20 weeks (bd, n = 10 Wt and n = 12 Sema3a +/- male mice). e, H&E, Picro-Sirus Red (PSR) and Oil Red O (ORO) staining; scale bars = 100 µm. f, Densitometric quantification of hepatic ORO staining (n = 8 Wt and n = 7 Sema3a +/-). g, Liver triglycerides (TG, n = 7 male mice of each genotype). h-m, Serum transaminase and lipid profile, that is AST, ALT, TG, total cholesterol (Chol), HDL, non-esterified fatty acids (NEFA), in n = 6 (h, i, j, k, l) and n = 7 (m) Wt male DIO mice and n = 4 DIO Sema3a +/- mice kept on a HFD for 20 weeks. AST/ALT values displayed as ‘under 15’ were defined as 15 U/L. n, RT-qPCR analysis of genes involved in lipid metabolism in liver tissue from fasted mice. Please note that male, chow-fed 35–38-week-old mice (fasted for 4 h) were used (n = 7 per genotype). o, Intraperitoneal glucose tolerance test (GTT) and area under the curve (AUC), n = 7 mice of each genotype; p, Plasma insulin concentrations during the GTT, n = 7 mice of each genotype. For statistical analysis, a two-tailed, unequal variances t-test was performed in b, d-n, and o (for the AUC blood glucose). A repeated measures two-way ANOVA with Sidak´s post hoc test was used to test for statistical significance in c, o (for the GTT) and p. In all graphs, individual data points, mean ± SEM are presented. Source data
Extended Data Fig. 7
Extended Data Fig. 7. Metabolic cage analysis of diet-induced obese (DIO) Sema3a +/- mice.
a, Absolute and relative food intake in 24 h, normalized to lean mass of DIO control mice and DIO Sema3a +/- mice. b, Absolute and relative water intake in 24 h, normalized to lean mass. c, Physical activity of mice quantified by summarizing photo sensor counts in x, y and z directions separately for day (Light) and night (Dark). d, Oxygen consumption (ml/h/kg body weight) and e, Carbon dioxide (CO2) release (ml/h/kg body weight); f, Energy expenditure (kcal/h/kg body weight). g, Respiratory quotient (VCO2/VO2). N = 10 wt and n = 12 Sema3a +/- mice (20 weeks kept on a high-fat diet) in (a-g). A two-tailed unequal variances t-test was used to assess statistical significance in (a, b); and a repeated measures two-way ANOVA with a Sidak´s post hoc test was used in (c-g). In all graphs, individual data points, mean ± SEM are presented. Source data
Extended Data Fig. 8
Extended Data Fig. 8. Lower SAF score in adult DIO mice after deletion of endothelial Sema3a.
Analysis of diet-induced obese (DIO) iECwt mice and DIO iECSema3a kept on HFD for 20 weeks (with tamoxifen injections after 10 weeks of HFD). a, Quantification of Sema3a allele recombination in liver tissue from DIO iECwt and DIO iECSema3a mice as assessed by PCR. b, Body weight during exposure to HFD. c, Elastica van Gieson´s staining of paraffin sections of liver tissue to assess fibrosis; scale bars = 100 µm. d, Assessment of the grade of MASLD according to the steatosis, activity, fibrosis (SAF) score. e, RT-qPCR analysis of genes involved in hepatic liver metabolism. N = 4 iECwt and n = 5 iECSema3a mice were analyzed for each genotype in (a, c-e) and n = 12 iECwt and n = 11 iECSema3a mice in (b). For statistical analyses, two-tailed unequal variances t-tests were performed in (a, d, e), while a repeated measures two-way ANOVA with a Sidak´s post hoc test was used to test for statistical significance in (b). In all graphs, individual data points and mean ± SEM are presented. Source data

References

    1. Ipsen, D. H., Lykkesfeldt, J. & Tveden-Nyborg, P. Molecular mechanisms of hepatic lipid accumulation in non-alcoholic fatty liver disease. Cell Mol. Life Sci.75, 3313–3327 (2018). 10.1007/s00018-018-2860-6 - DOI - PMC - PubMed
    1. Poisson, J. et al. Liver sinusoidal endothelial cells: Physiology and role in liver diseases. J. Hepatol. 66, 212–227 (2017). 10.1016/j.jhep.2016.07.009 - DOI - PubMed
    1. Braet, F. & Wisse, E. Structural and functional aspects of liver sinusoidal endothelial cell fenestrae: a review. Comp. Hepatol.1, 1 (2002). 10.1186/1476-5926-1-1 - DOI - PMC - PubMed
    1. Sorensen, K. K., Simon-Santamaria, J., McCuskey, R. S. & Smedsrod, B. Liver sinusoidal endothelial cells. Compr. Physiol.5, 1751–1774 (2015). 10.1002/cphy.c140078 - DOI - PubMed
    1. Hammoutene, A. & Rautou, P. E. Role of liver sinusoidal endothelial cells in non-alcoholic fatty liver disease. J. Hepatol.70, 1278–1291 (2019). 10.1016/j.jhep.2019.02.012 - DOI - PubMed

Publication types

MeSH terms

LinkOut - more resources