. 2023 Oct;2(10):917-936.
doi: 10.1038/s44161-023-00338-3. Epub 2023 Sep 28.

Transcriptional profiling unveils molecular subgroups of adaptive and maladaptive right ventricular remodeling in pulmonary hypertension

Affiliations

Transcriptional profiling unveils molecular subgroups of adaptive and maladaptive right ventricular remodeling in pulmonary hypertension

Fatemeh Khassafi et al. Nat Cardiovasc Res. 2023 Oct.

Abstract

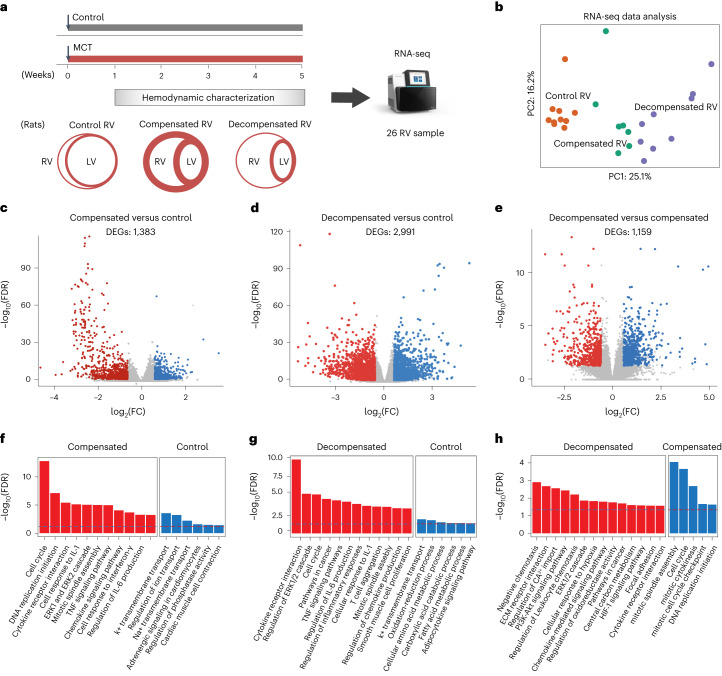
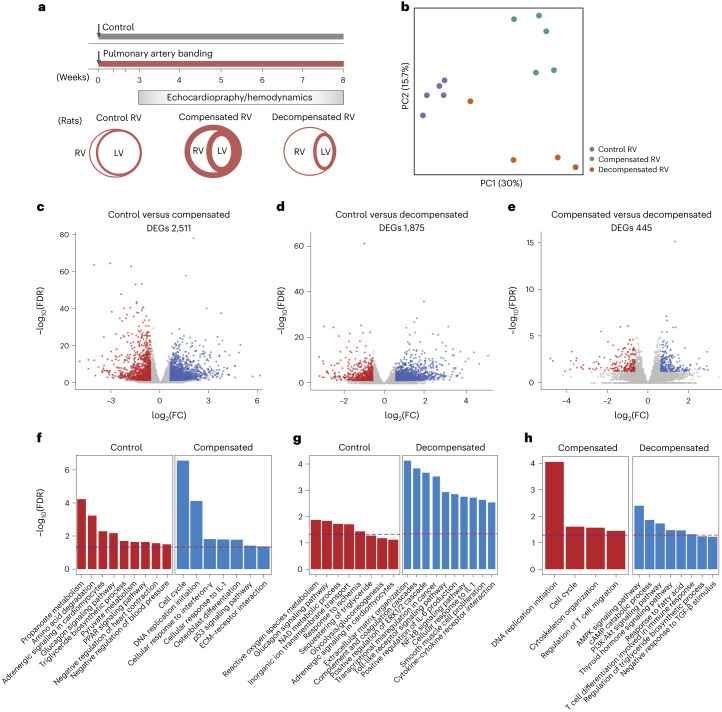
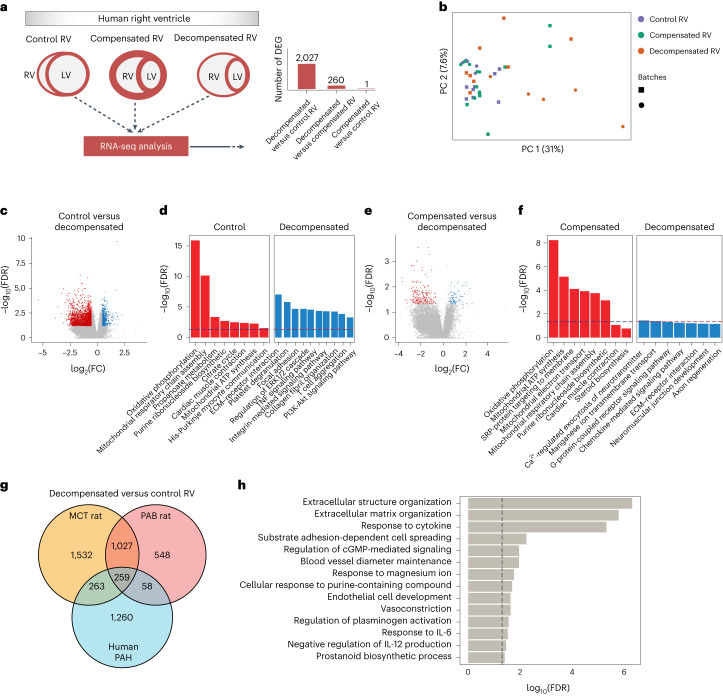
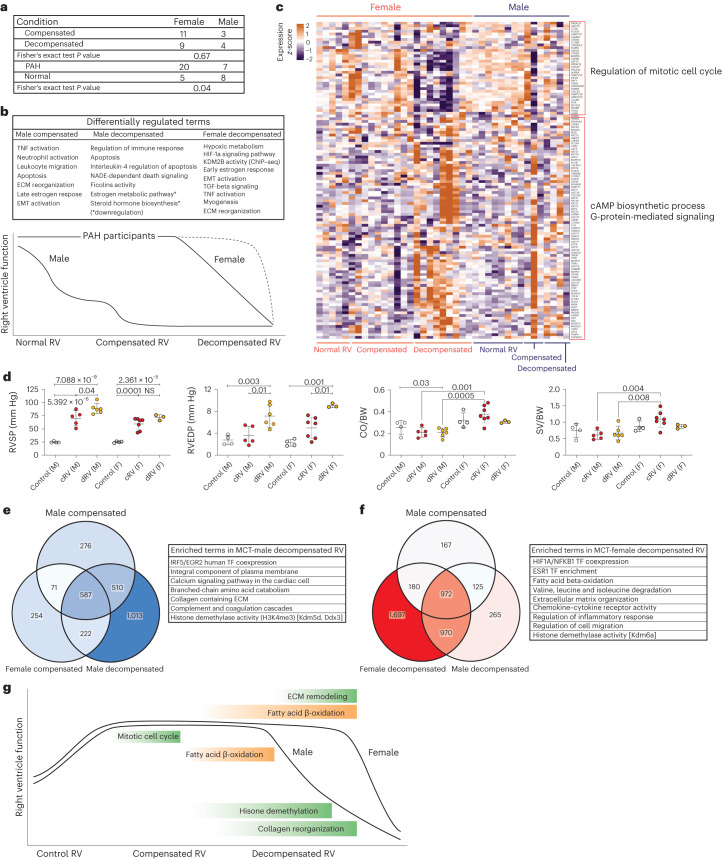
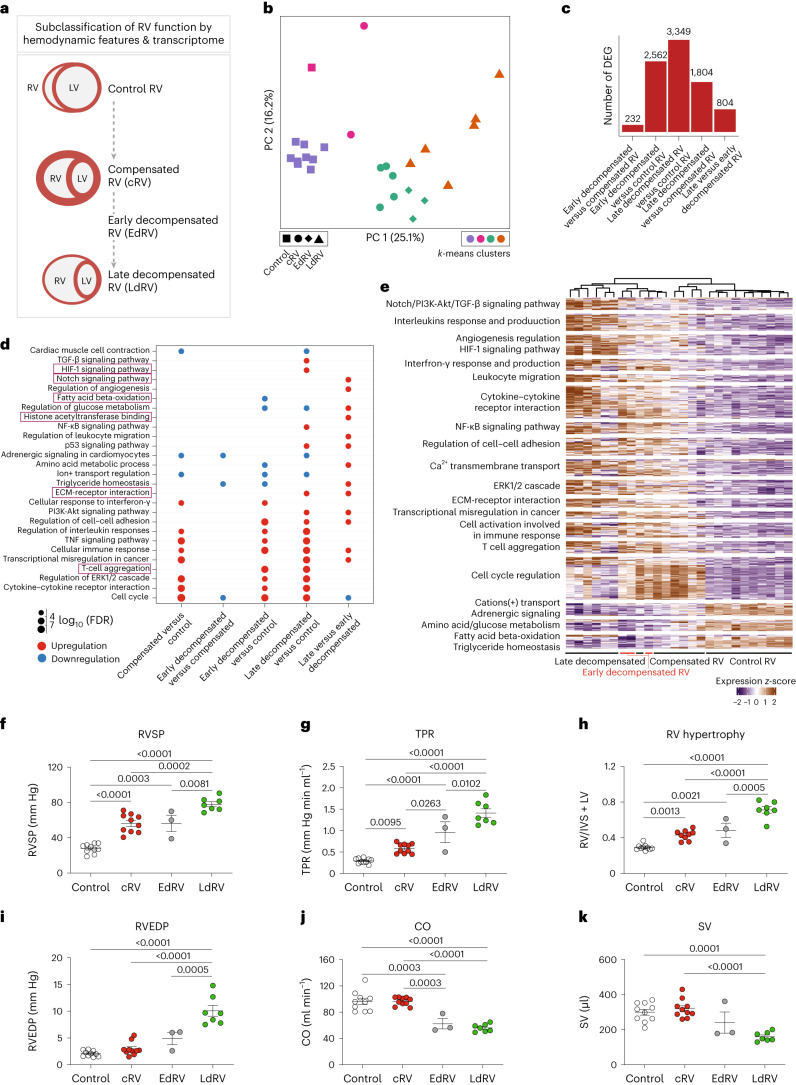
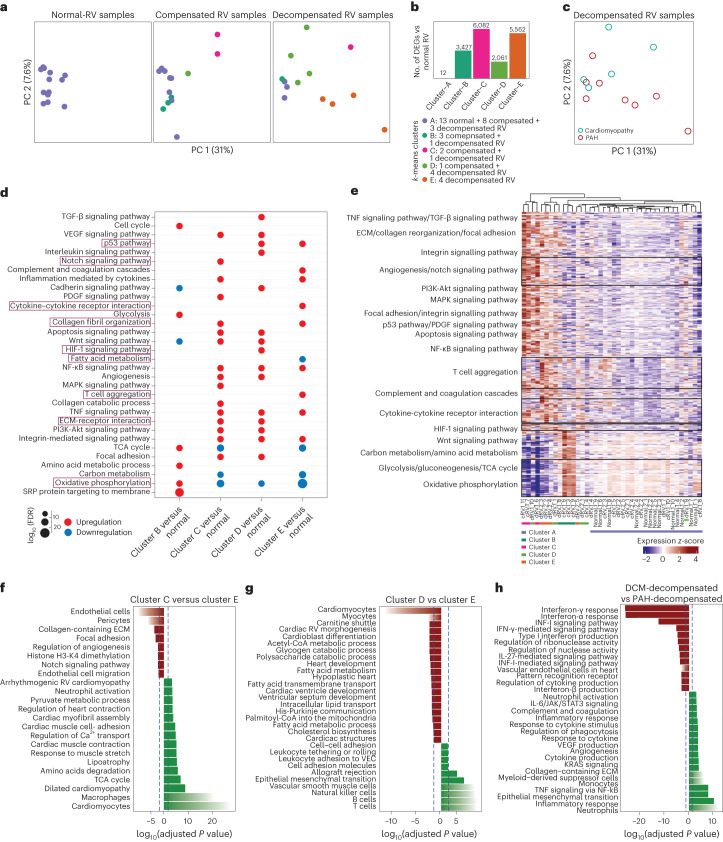
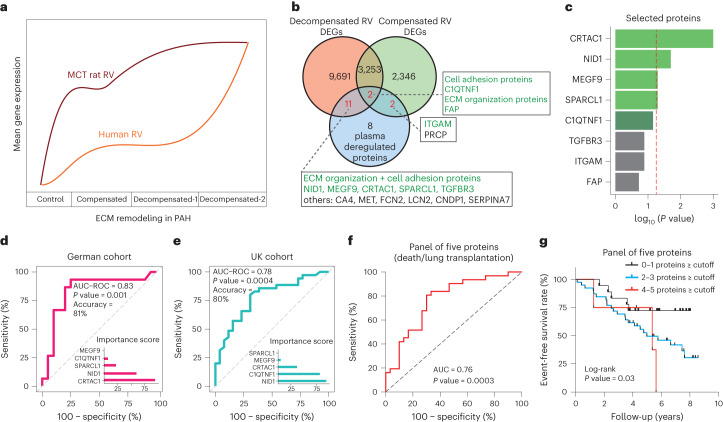
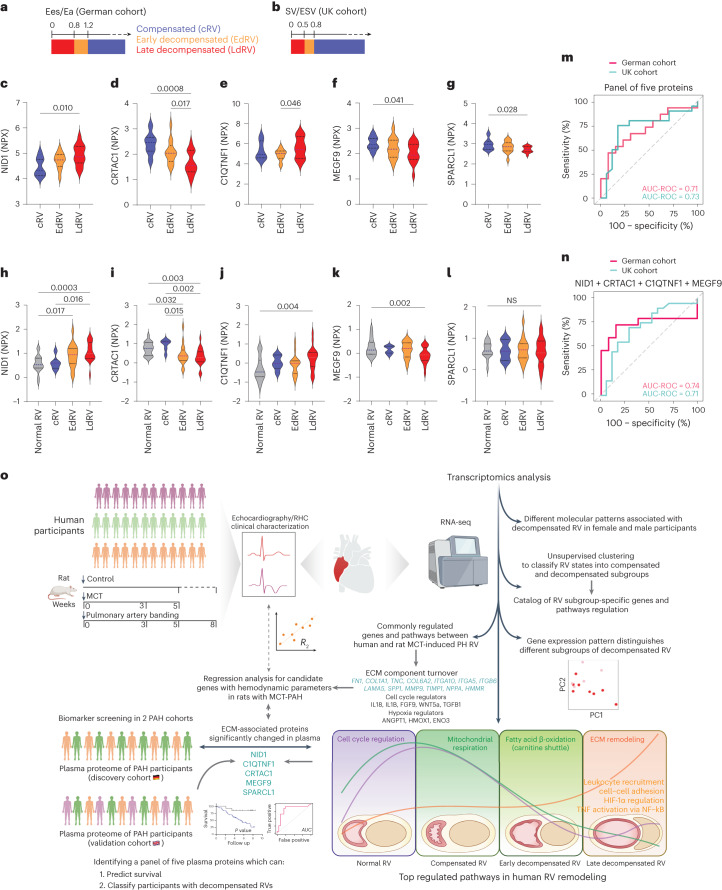
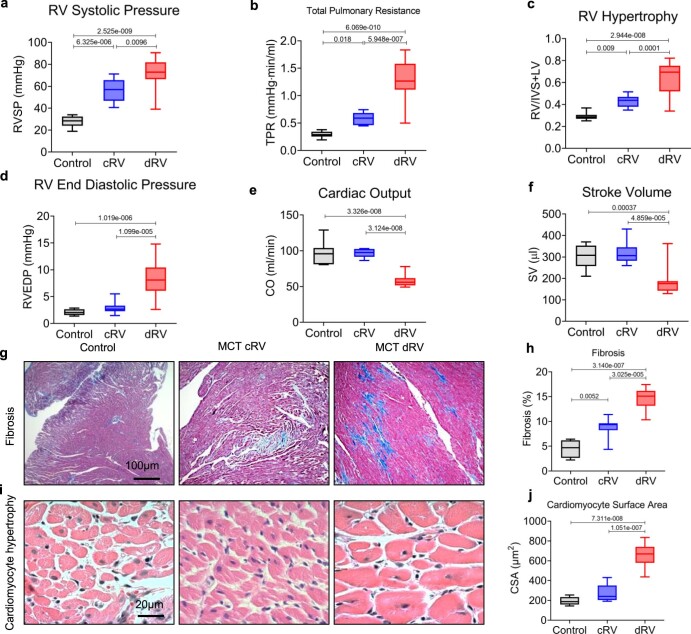
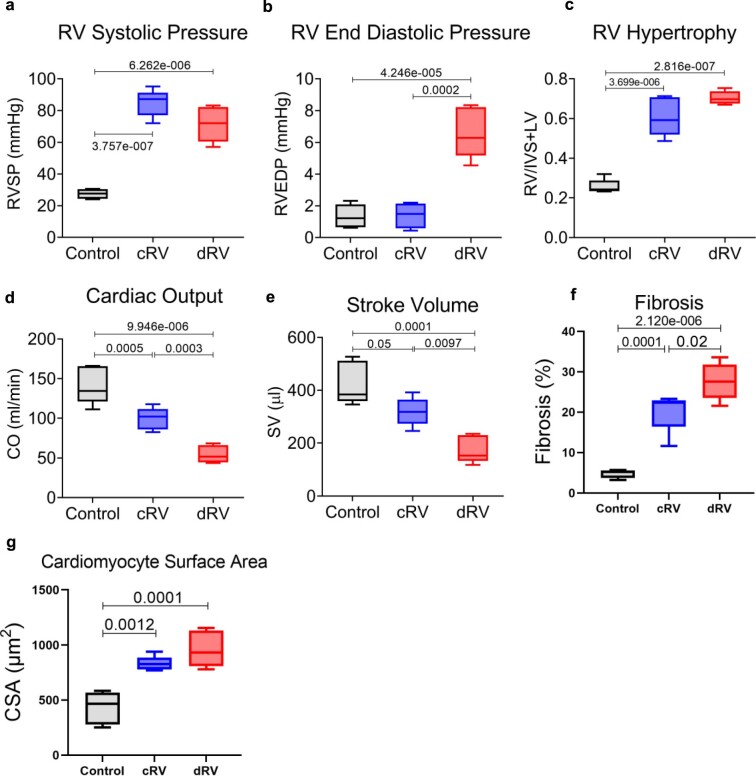
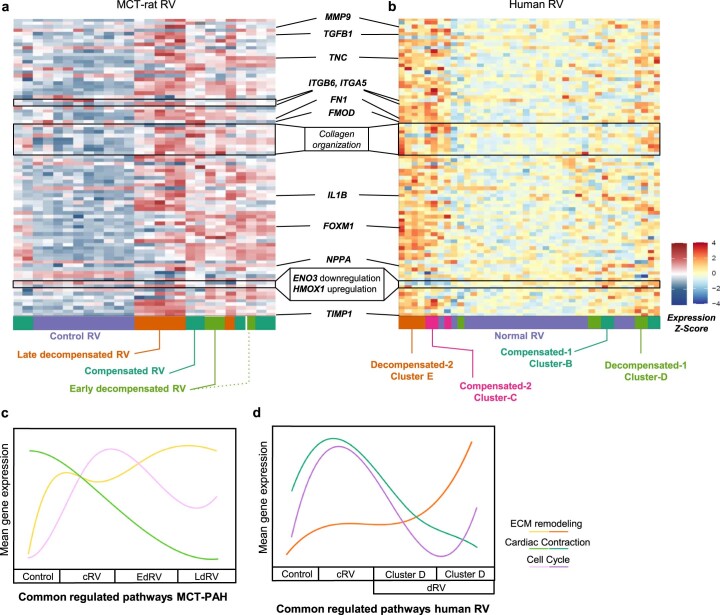
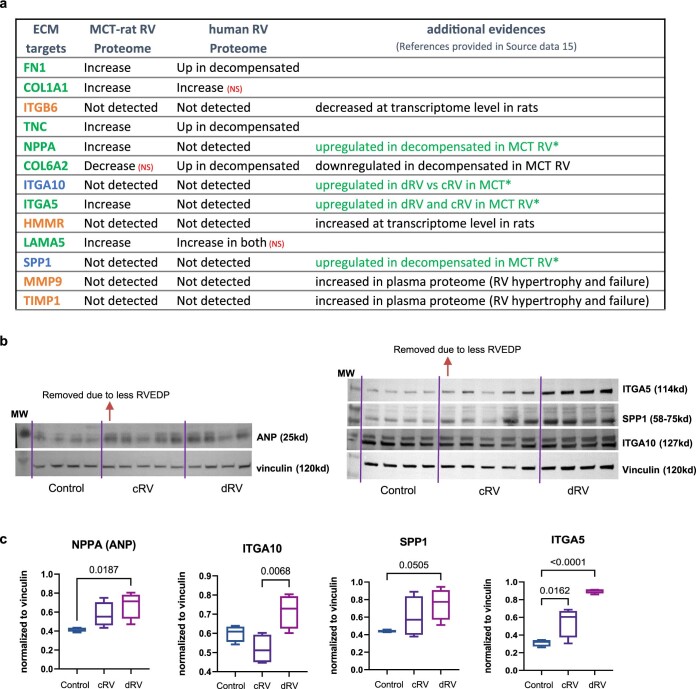
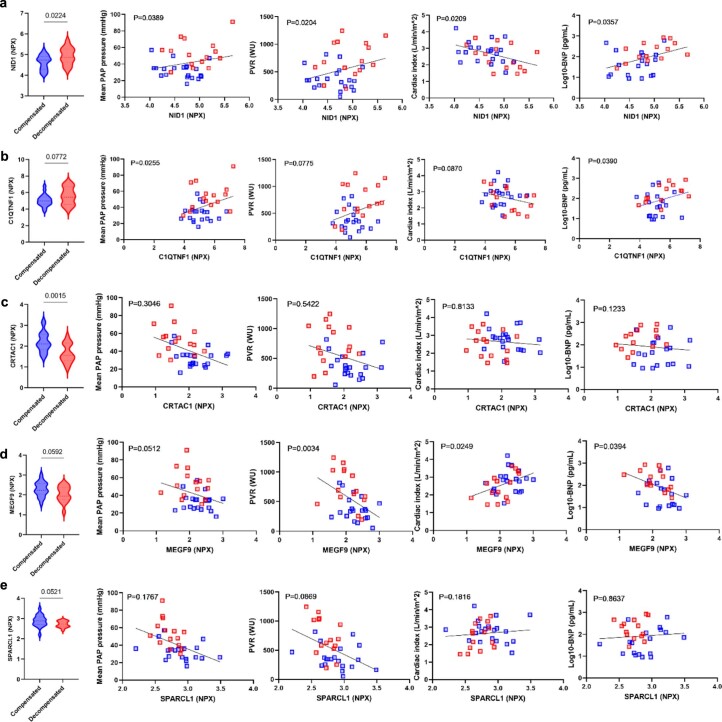
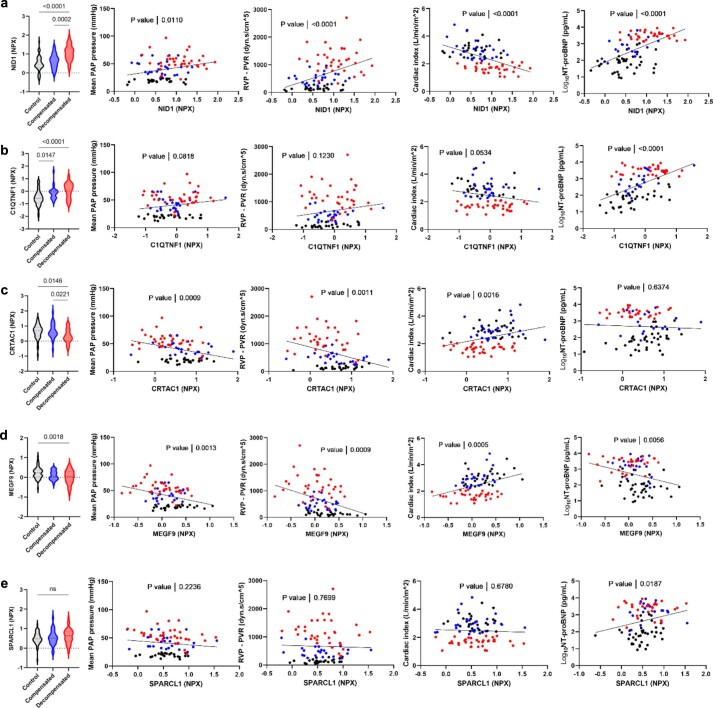
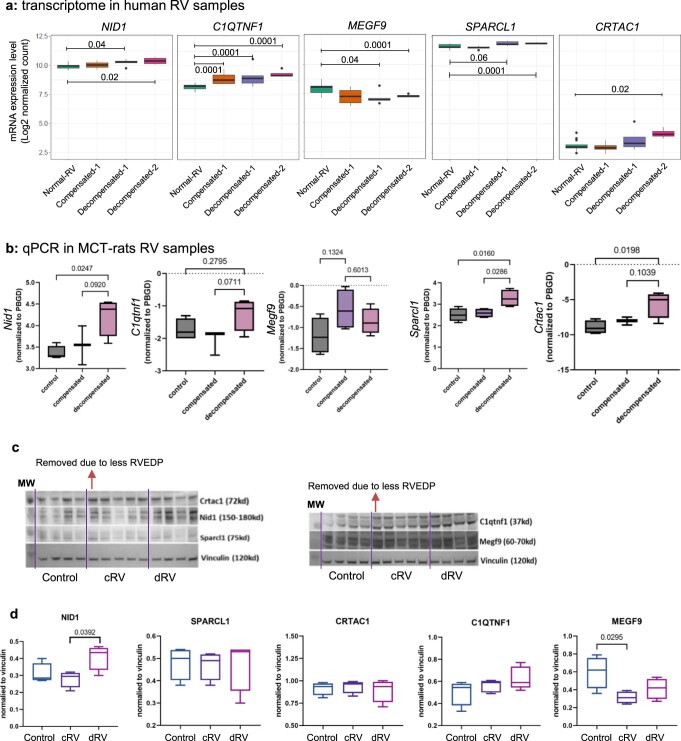
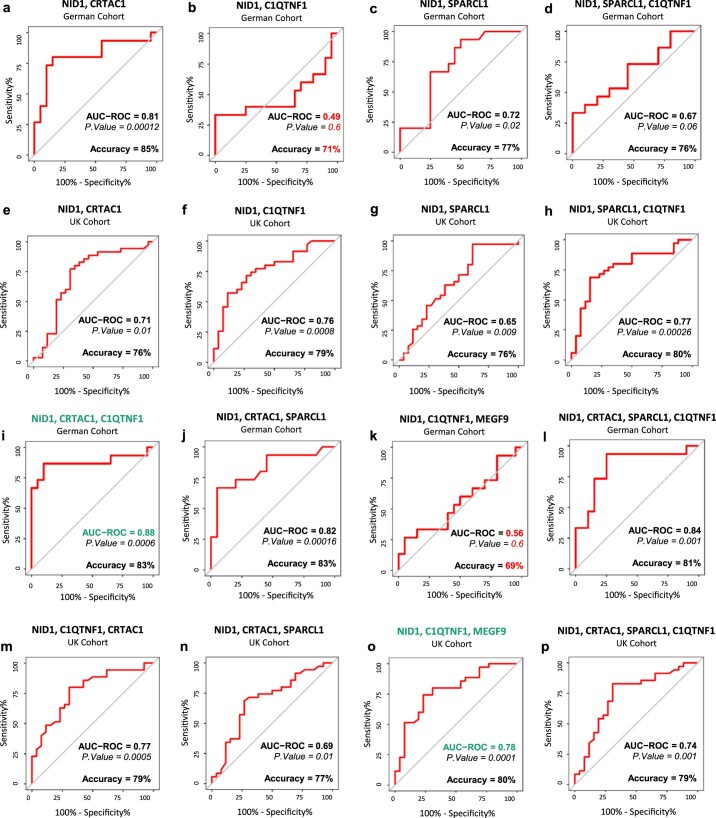
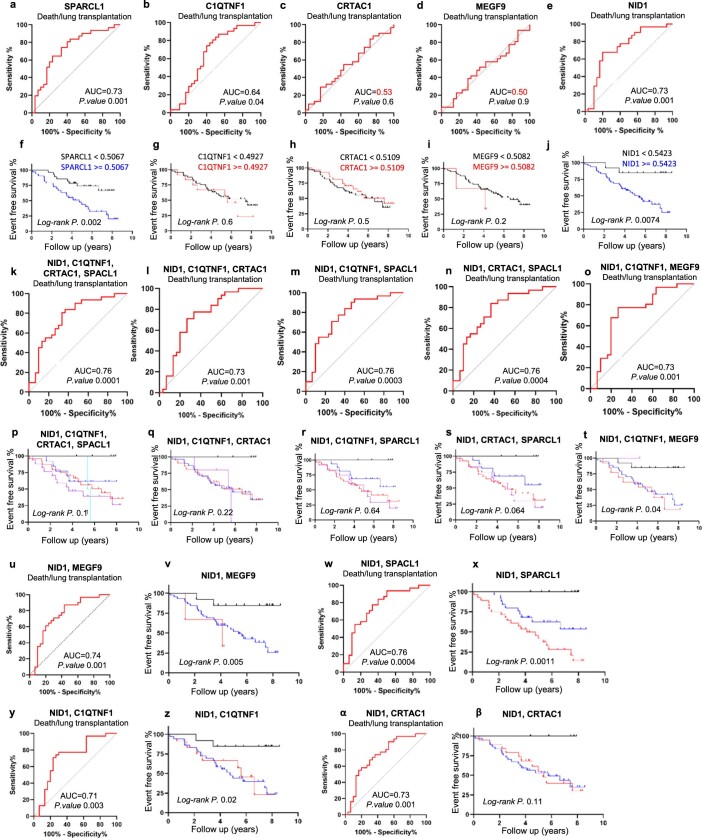
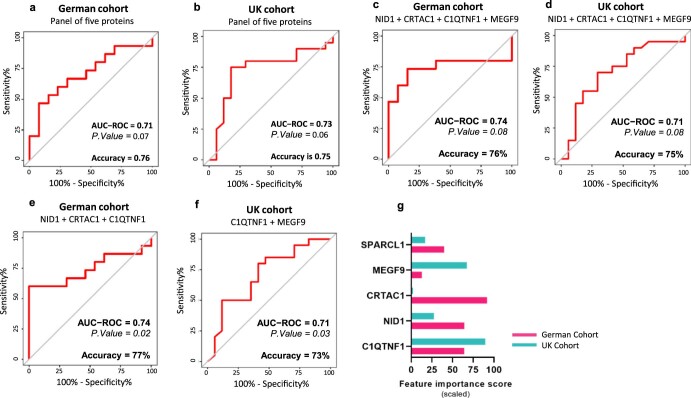
Right ventricular (RV) function is critical to prognosis in all forms of pulmonary hypertension. Here we perform molecular phenotyping of RV remodeling by transcriptome analysis of RV tissue obtained from 40 individuals, and two animal models of RV dysfunction of both sexes. Our unsupervised clustering analysis identified 'early' and 'late' subgroups within compensated and decompensated states, characterized by the expression of distinct signaling pathways, while fatty acid metabolism and estrogen response appeared to underlie sex-specific differences in RV adaptation. The circulating levels of several extracellular matrix proteins deregulated in decompensated RV subgroups were assessed in two independent cohorts of individuals with pulmonary arterial hypertension, revealing that NID1, C1QTNF1 and CRTAC1 predicted the development of a maladaptive RV state, as defined by magnetic resonance imaging parameters, and were associated with worse clinical outcomes. Our study provides a resource for subphenotyping RV states, identifying state-specific biomarkers, and potential therapeutic targets for RV dysfunction.


Conflict of interest statement

The authors declare no competing interests.

Figures

Fig. 1
Fig. 1. Transcriptomic analysis of right ventricle in a rat model of MCT-induced pulmonary hypertension.
a, Experimental design for the hemodynamic and transcriptomic characterization of RV samples in control (normal), compensated and decompensated states from MCT-induced PH rats. b, PC analysis was performed on the normalized RNA-seq data to visualize the gene expression profiles of all the RV samples. Control RV samples are shown in orange, compensated RV samples in green, and decompensated RV samples in purple. ce, Volcano plots show the significance of each expressed gene (−log10 false discovery rate (FDR) values on the y axis), plotted against the logarithmic fold change (log2FC values on the x axis), in each pair of comparisons. DEGs were identified by DESeq2 (base mean expression ≥ 5; −0.585 ≤ log2FC ≥ 0.585; FDR ≤ 0.05). c, Compensated (red) versus control RV (blue) (c), decompensated (red) versus control RV (blue) (d) and decompensated (red) versus compensated RV (blue) (e). fh, Top-selected differentially enriched pathways for each pair of comparisons. Compensated versus control RV (f), decompensated versus control RV (g) and decompensated versus compensated RV (h). The dashed line shows FDR = 0.05.
Fig. 2
Fig. 2. Transcriptomic analysis of the right ventricle in a rat model of pulmonary artery banding.
a, Experimental design for the hemodynamic and transcriptomic characterization of RV samples in control (normal), compensated and decompensated states from rats subjected to PAB. b, PC analysis was performed on normalized RNA-seq data to visualize the gene expression profiles of all the RV samples. Control RV samples are shown in purple, compensated RV samples in green, and decompensated RV samples in orange. ce, Volcano plots show the significance of each expressed gene (−log10 FDR values on the y axis), plotted against the logarithmic fold change (log2FC values on the x axis), in each pair of comparisons. DEGs were identified by DESeq2 (base mean expression ≥ 5; −0.585 ≤ log2FC ≥ 0.585; FDR ≤ 0.05). (c) Compensated (blue) versus control RV (red) (c), decompensated (blue) versus control RV (red) (d) and decompensated (blue) versus compensated RV (red) (e). fh, Top selected differentially enriched pathways for each pair of comparisons. Compensated versus control RV (f), decompensated versus control RV (g) and decompensated versus compensated RV (h). The dashed line shows FDR = 0.05.
Fig. 3
Fig. 3. Transcriptomic analysis of adaptive and maladaptive remodeling in the human right ventricle.
a, RNA-seq was performed on human RV tissues that were clinically classified by hemodynamic assessment and clinical symptoms into control/normal (n = 13), compensated (n = 14) and decompensated (n = 13) RV states, obtained and sequenced in two batches, underwent standard quality-control assessment, batch effect removal, and normalization. DEGs were identified by DESeq2 (base mean expression ≥ 5; −0.585 ≤ log2FC ≥ 0.585; FDR ≤ 0.05). b, PC analysis on the normalized/batch-corrected RNA-seq data from 40 human RV samples. Colors distinguish different RV states, and shapes show two different batches of data. c, Volcano plot highlighting the significant DEGs (−0.585 ≤ log2FC ≥ 0.585 and FDR ≤ 0.05 in decompensated (blue) versus normal RV (red). d, Top-selected pathways enriched for decompensated versus normal RV samples. e, Volcano plot highlighting the significant DEGs in decompensated (blue) versus compensated RV (red) samples. f, Top-selected pathways enriched for decompensated versus compensated RV samples. The dashed line shows FDR = 0.05. g, Common and distinct DEGs for decompensated RV versus normal RV samples in three transcriptome datasets displayed in the Venn diagram. Orange, MCT rat; red, PAB rat; blue, human decompensated RV versus normal. h, Top significantly enriched pathways for 259 common DEGs of decompensated versus normal samples between all three datasets. The dashed line shows FDR = 0.05. Source data
Fig. 4
Fig. 4. Effects of sex difference on human and MCT rat right ventricular remodeling associated with pulmonary hypertension.
a, Number of patients in each group, separated by sex, and the Fisher’s exact test P value for compensated-versus-decompensated RV and normal-versus-PAH RV pairs. b, Schematic of RV dysfunction in male and female participants, which shows a different route (longer) for female decompensated RV failure compared with males. Differentially enriched pathways in male compensated and decompensated RV samples and female decompensated RV demonstrate independent biological routes of maladaptive RV remodeling in female and male PAH participants. c, Regulation of 116 differentially regulated genes associated with estrogen and progesterone metabolism (FDR < = 0.05) in all human RV samples. n (normal RV) = F:5, M:8, n (compensated RV) = F:10, M:3, n (decompensated RV) = F:9, M:4. Colors represent the scaled gene expression (rows, z-score). d, Hemodynamics assessment of MCT rats RV functions for male and female animals. n (cRV male) = 5, n (dRV male) = 6, n (cRV female) = 7, n (dRV female) = 3, n (control F, M) = 4. Data are presented as the mean ± s.e.m. P value was calculated by one-way analysis of variance (ANOVA) followed by Tukey’s multiple-comparisons test. e,f, Genes and pathways that were specifically regulated in male (e) and female (f) decompensated RV samples, respectively. g, Schematic of RV remodeling in MCT-induced rat model, highlighting the main differentially regulated pathways in male and female animals (green, upregulated; orange, downregulated). cRV, compensated right ventricle; dRV, decompensated right ventricle; M, male; F, female; RVSP, right ventricle systolic pressure; CO, cardiac output; BW, body weight; NS, not significant. Source data
Fig. 5
Fig. 5. Subclassification of decompensated state based on the transcriptome in MCT-induced pulmonary hypertension.
a, Schematic of the classification of RV function into normal, compensated and decompensated, along with a further subclassification of the decompensated RV into early and late states, based on both transcriptome and hemodynamic features. b, PC analysis was performed on the normalized RNA-seq data, in which the k-means clusters are demonstrated by different colors. Three early-decompensated RV samples clustered with the compensated group, while separated from other decompensated samples on both PCs. Different shapes represent different RV states. c, The number of DEGs that are significantly regulated in each pairwise comparison (base mean expression ≥ 5, −0.585 ≤ log2FC ≥ 0.585, FDR ≤ 0.05). d, Cumulative enrichment analysis demonstrating the shortlisted important pathways differentially regulated in each pair of RV subgroups. The size of the dots represents the FDR, the red color shows upregulation, while blue represents downregulation of a pathway in the respective pair. Distinguishing pathways regarding early- to late-decompensated RV transition is highlighted in red. One-sided Fisher’s exact test was used for all the enrichment analysis, which assesses the independent probability of any genes belonging to any set. FDR-corrected P value with Benjamini Hochberg method was used for multiple-hypothesis testing. e, Scaled gene expression (z-score) representation of the 576 cumulative DEGs corresponding to all the altered pathways associated with the transition from compensated to early- and late-decompensated RV in MCT-induced PH. Different groups of biological terms with similar regulation levels are highlighted along the y axis. fk, Hemodynamic assessment of MCT-induced PH in rats confirmed changes in RV systolic pressure (RVSP; f), total pulmonary resistance (TPR; g), RV hypertrophy (right ventricular weight to left ventricular plus septal weight ratio; h), RV end-diastolic pressure (RVEDP; i), cardiac output (CO; j) and stroke volume (SV; k). n(control) = 10, n(compensated) = 10, n(early decompensated) = 3, n(late decompensated) = 7. Data are presented as the mean ± s.e.m. P values were calculated by one-way ANOVA followed by Tukey’s multiple-comparisons test. Source data
Fig. 6
Fig. 6. Subclassification of compensated and decompensated states based on the transcriptome in human right ventricle.
a, PC analysis shows the k-means clusters of human RV samples (n = 40, k = 5). In addition to cluster A, there were two subgroups within compensated samples and two subgroups within decompensated samples. Cluster A contains 13 normal RV, 8 compensated, and 3 decompensated RV samples. Cluster E contains only 4 samples from the decompensated group, while clusters B, D and C each contain a different combination of compensated and decompensated RV samples. b, Numbers of DEGs in pairwise comparisons for all clusters versus normal RVs (base mean expression ≥ 5; −0.585 ≤ log2FC ≥ 0.585; FDR ≤ 0.05). c, Two decompensated RV groups based on their different etiology (PAH or DCM) are shown on the same PCs. d, Cumulative enrichment analysis demonstrating the shortlisted important pathways differentially regulated in each cluster (versus control). Size of the dots represents FDR, the red color shows upregulation, while blue represents downregulation of a pathway in the respective pair. Distinguishing pathways are highlighted in red. One-sided Fisher’s exact test was used for all the enrichment analysis, which assesses the independent probability of any genes belonging to any set. FDR-corrected P value with Benjamini–Hochberg method was used for multiple-hypothesis testing. e, Scaled gene expression (z-score) value of 659 genes corresponding to selected dysregulated pathways in human RV clusters of compensated and decompensated samples. Different groups of biological terms with similar regulation are grouped along the y axis. fh, Pathway analysis of DEGs (P adjusted ≤ 0.05; log2FC ≥ 1 and ≤ −1) between cluster C (red) and cluster E (green; compensated-2 versus decompensated-2 RV) (f), between cluster D (red) and cluster E (green) (decompensated-1 versus decompensated-2 RV) (g) and between PAH-associated (green) and DCM-associated (red) decompensated RV subgroups (h). The dashed line shows FDR = 0.05. Source data
Fig. 7
Fig. 7. Plasma levels of five extracellular matrix regulatory proteins act as a potential prognostic biomarker for pulmonary arterial hypertension.
a, Transcriptome regulation of ECM-associated genes in both human and MCT rat RV samples. b, Venn diagram showing the inclusion of all dysregulated genes (base mean expression ≥ 5; −0.585 ≤ log2FC ≥ 0.585; FDR ≤ 0.05) from human RV transcriptomes, and top 25% of deregulated plasma proteins between participants with compensated and decompensated RV in the discovery PAH cohort. Proteins associated with ECM or cell adhesion are highlighted in green. c, Common ECM regulatory proteins between transcriptomes and the PAH proteome cohort, and their corresponding P value was calculated by unpaired t-test comparison between compensated and decompensated subgroups of participants in the discovery cohort (CRTAC1 = 0.001, NID1 = 0.02, MEGF9 = 0.05, SPARCL1 = 0.05, C1QTNF1 = 0.07, TGFBR3 = 0.13, ITGAM = 0.13, FAP = 0.19). P values were not corrected for multiple comparisons. Top five proteins selected to check for their biomarker capacity are highlighted in green. The dashed line highlights P value = 0.05. d,e, ROC analysis and the corresponding AUC and accuracy showing the performance of the random forest model for the panel of five proteins in classifying two groups of participants (decompensated versus compensated) in the discovery cohort (German) (d) and validation cohort (UK) (e). ROC P value was calculated using one-sided Mann–Whitney (Wilcoxon-based) test for the H0: AUC = 0.5, and not corrected for multiple comparisons. Feature (proteins) importance score measurement in each cohort, showing the relative influence of each protein in prediction performance. f, ROC curve measuring the risk of death/lung transplantation in participants from the second PAH cohort during years of follow-up counting for a combination of five proposed biomarkers to assess the optimal cutoff value and their performance in predicting transplant event-free survival. The ROC accuracy was tested with the one-sided Wilson/Brown method for 95% confidence intervals, and the P value was not corrected for multiple comparisons. g, Kaplan–Meier analysis shows the transplant event-free survival rate and a log-rank test P value for the comparisons between groups using a panel of five proteins based on optimal cutoff levels from the ROC curves of each protein. Participants were divided into three groups based on the total number of proteins that had cutoff levels equal to or greater than the optimal level. Black line, 0–1(proteins); blue line = 2–3 (proteins); red line, 4–5 (proteins).
Fig. 8
Fig. 8. NID1 and C1QTNF1 proteins can distinguish early- to late-decompensated right ventricle in pulmonary arterial hypertension.
ab, Representation of cutoff that was used for definition of early and late decompensation based on Ees/Ea ratio in the discovery cohort (a) and based on SV/ESV ratio in the validation cohort (b). cg, Plasma levels of five selected proteins in the discovery cohort (German). hl, Plasma levels of five selected proteins in the validation cohort (UK). P values were calculated by one-way ANOVA. m,n, ROC curve for both cohorts showing the prediction performance for the panel of five proteins (discovery P value = 0.07, validation P value = 0.06) (m) and for only four proteins, excluding SPARCL1 (discovery P value = 0.08, validation P value = 0.08) (n), in classifying participants with late- versus early-decompensated RV. EdRV, early-decompensated right ventricle; LdRV, late-decompensated right ventricle. o, Schematic summary of the study design and main results. Human participants and rat models were subjected to echocardiography and RHC, and RV samples were obtained for RNA profiling (top left). Workflow for the transcriptomic analysis of the RV samples indicating the subgrouping approach (top right). Identification and validation of five plasma proteins, associated with ECM which can predict survival and classify participants with different RV conditions (bottom left). Summary of the most dysregulated pathways in human RV remodeling during PAH. The RV samples were divided into four distinct phenotypes: normal, compensated, early decompensated and late decompensated, based on integrative findings in RVs from both human and MCT-PH rats (bottom right). Created with BioRender.com.
Extended Data Fig. 1
Extended Data Fig. 1. Hemodynamic assessment and RV function in MCT-induced PH rats.
Hemodynamic data collected by closed-chest right heart catheterization. RV hypertrophy was calculated as Fulton index (weight ratio of RV and (LV + septum)). (a) RV systolic pressure (RVSP), (b) total pulmonary resistance (TPR) (c) RV hypertrophy, (d) RV end-diastolic pressure (RVEDP), (e) cardiac output (CO). (f) Stroke volume (SV). Number of samples (n) in each group of comparison= 10. (g) Representative images of RV stained with Masson’s trichrome from control and MCT-treated rats with compensated RV (cRV) and decompensated RV (dRV) states. (h) Quantification of cardiac fibrosis in the same rat samples. (i) Representative images of RVs stained with H&E from control and MCT-treated rats. (j) Quantification of cardiomyocyte cross-sectional area (CSA) representing cardiomyocyte hypertrophy (from the same rat samples). (h, j) n(control)=4, n(compensated) = 9, n(decompensated)=9. Data are presented as mean ± SEM. (P value has been calculated by one-way ANOVA followed by Tukey’s multiple comparisons test). In all the box plots: Central bands represents 50% quantile (median), box interquartile ranges: 25–75%, and whiskers set to max/min, 1.5 IQR above/below the box. Source data
Extended Data Fig. 2
Extended Data Fig. 2. Hemodynamic assessment and RV function in rat PAB model.
(a) RV systolic pressure (RVSP), (b) RV end-diastolic pressure (RVEDP), (c) RV hypertrophy (RVH, calculated as Fulton index (weight ratio of RV to LV + septum)), (d) cardiac output (CO), (e) stroke volume (SV), (f) representative quantification of cardiac fibrosis from the PAB-rats RV samples stained with Masson’s trichrome for control, compensated RV (cRV) and decompensated RV (dRV) states. (g) Representative quantification of H&E staining for cardiomyocyte cross-sectional area (CSA) representing cardiomyocyte hypertrophy in the same RV samples. Data are presented as mean ± SEM. (P value has been calculated by one-way ANOVA followed by Tukey’s multiple comparisons test). In all the box plots: Central bands represents 50% quantile (median), box interquartile ranges: 25–75%, and whiskers set to max/min, 1.5 IQR above/below the box. Number of samples (n) in each group of comparison=5. PAB-induced PH has been evaluated by significant elevations of RVSP, TPR, and RV hypertrophy in compensated RV state, while RVEDP was distinctly altered in decompensated RV, which along with clinical RV failure signs enabled us to clearly distinguish the decompensated from compensated RV condition in PAB rats. However, cardiac output (CO), as well as stroke Volume (SV) were continuously reduced in PAB rats unlike the MCT model. Source data
Extended Data Fig. 3
Extended Data Fig. 3. Summary of pathways and genes regulated commonly in human RV dysfunction samples and in MCT-rat RVs.
(a, b) Heatmap for 85 common regulated genes in (a) MCT-rat RV and (b) human RV datasets. Colors shown on the bottom derived from k-means clustering, representing the samples subgroups of compensated and decompensated RVs. List of gene names are provided in source data. (c, d) Common regulated pathways in (c) MCT-rat and (d) human RVs. Human compensated-2 is removed from this representation as it was very similar to decompensated-2. Source data
Extended Data Fig. 4
Extended Data Fig. 4. Public proteome and Western blot validation of selected ECM proteins in MCT-RV and human RV.
(a) Summary of 13 non-biomarker targets associated with ECM from the transcriptome analysis, along with their evidence of protein expression levels in animal models and human RV from publicly available datasets. The western blot analysis results has been highlighted in green in the third column. (b) Western blot images for ANP, ITGA5, ITGA10, and SPP1, in control (n = 4), cRV (n = 5) and dRV (n = 4) samples from MCT-induced rats. ANP is loaded in a separate blot from three other proteins. (c) Western blot quantifications for ANP, ITGA5, ITGA10, and SPP1 normalized to the corresponding loading control of each blot (Vinculin). Protein expression levels has been tested by one-way ANOVA followed by Dunnett’s multiple comparisons test (exact P-value has been demonstrated when significant). Data are presented as mean ± SEM. In all the box plots: Central bands represents 50% quantile (median), box interquartile ranges: 25–75%, and whiskers set to max/min, 1.5 IQR above/below the box. Source data
Extended Data Fig. 5
Extended Data Fig. 5. Expression and functional correlation of selected biomarker candidates in German cohort.
Protein expression levels (NPX), and simple linear regression for each protein with RV functional parameters in two groups of PAH patients (compensated and decompensated). (a, b) NID1 and C1QTNF1 were two proteins with absolute circulating upregulation from compensated to decompensated RV conditions, while correlating significantly with all the all the functional parameters for NID1, and with mPAP and proBNP, for C1QTNF1 (c, d). CRTAC1 and MEGF9 show downregulation in decompensated vs compensated. MEGF9 correlates highly with PVR, CI, and proBNP levels (d), while CRTAC1 does not have significant correlation with any of the parameters (c). SPARCL1 shows slight downregulation in decompensated vs. compensated RV, with no significant functional correlation (e). Protein expression levels has been tested by two-tailed unpaired t-test, and p-value has not been corrected for multiple comparison as it does not apply. Data are presented as mean ± SEM. multiple linear regression has been applied for each protein vs RV functional parameter, while the variance analysis P-value has been adjusted for age and sex. (mPAP = mean pulmonary arterial pressure, PVR= pulmonary vascular resistance, CI = Cardiac Index). Source data
Extended Data Fig. 6
Extended Data Fig. 6. Expression and functional correlation of selected biomarker candidates in UK cohort.
Protein expression levels (NPX), and simple linear regression for each protein with RV functional parameters in two groups of PAH patients as well as controls. (a) NID1 expression was significantly correlated with all the hemodynamics parameters, negatively with Cardiac Index, while positively with mPAP and PVR as well as proBNP levels. (b) C1QTNF1 expression was positively correlated only with proBNP levels. (c, d) CRTAC1 and MEGF9 were both significantly correlated with all the clinical parameters, negatively with mPAP and PVR, and positively with Cardiac Index. (e) SPARCL1 did not show any significant correlation with measured clinical parameters except for a positive correlation with proBNP levels. Protein expression levels has been tested by one-way ANOVA followed by Turkey’s multiple comparison test. Data are presented as mean ± SEM. Simple linear regression has been applied to calculate the P-value of protein expression corrlation vs RV functional parameters. (mPAP = mean pulmonary arterial pressure, PVR = pulmonary vascular resistance, CI = Cardiac Index). Source data
Extended Data Fig. 7
Extended Data Fig. 7. Transcriptome, qPCR and Western blot validation of selected biomarkers in human and MCT-induced rat RV.
(a) Transcriptome level of five biomarker genes associated with ECM in normal (n = 13), compensated (n = 4) and decompensated-1 (n = 5), and decompensated-2 (n = 4) subgroups of RV. Central band: 50% quantile, box: interquartile range (25–75%); whiskers: max/min are 1.5 IQR above/below the box. (b) Relative mRNA expressions measured by qPCR for 5 selected biomarkers in control (n = 5), compensated (n = 5) and decompensated RVs (n = 5) from MCT-induced rats. (c) Western blot images for NID1, SPARCL1, CRTAC1, C1QTNF1, and MEGF9 in control (n = 4), cRV (n = 5) and dRV (n = 4) samples from MCT-induced rats. First three proteins are loaded in a separate blot from two others. (d) Western blot quantifications for 5 selected proteins, normalized to the corresponding loading control of each blot (Vinculin). Both mRNA and protein expression levels has been tested by one-way ANOVA followed by Tukey’s multiple comparisons test. Exact P-value has been demonstrated where significant. Data are presented as mean ± SEM. In all the box plots: Central bands represents 50% quantile (median), box interquartile ranges: 25–75%, and whiskers set to max/min, 1.5 IQR above/below the box. Source data
Extended Data Fig. 8
Extended Data Fig. 8. Combination of five proposed biomarkers can predict compensated vs decompensated in both cohorts.
ROC curves (associated AUCs and accuracy) indicating Random forest model performance in classifying patients with compensated or decompensated RV in each cohort independently. P-value has been calculated using one-sided Mann-Whitney (Wilcoxon-based) test for the H0: AUC = 0.5, and not corrected for multiple comparison as not applicable here. (a–p) Different combinations of proteins from panel of five has been tested to find the most effective features in prediction of RV states. Combination of NID1 + C1QTNF1 + CRTAC1 in German cohort (i) and NID1 + C1QTNF1 + MEG9 in validation cohort (o) are the most significant classifying features (highlighted in green).
Extended Data Fig. 9
Extended Data Fig. 9. Different combinations of five proposed biomarkers can predict death/lung transplantation in PAH patients.
(ae, k–o, u, w, y, α) ROC curve for the risk of death/lung transplantation in patients (UK cohort) during years of follow-up counting for each single or different combination of 5-proteins panel, to assess the optimal cut-off value and their performance in predicting event-free survival (fj, pt, v, x, z, β). The ROC accuracy has been tested with one-sided Wilson/Brown method for 95%CI, and P-value has not been corrected for multiple comparison as not applicable here. The Kaplan–Meier analysis shows the event-free survival rate and a log-rank test p-value for the comparisons between groups for each single or combination of proteins (survived vs death/transplantation) using the optimal cut-off from the ROC curves. The numbers of proteins that had equal or more expression than cut-off level was summed and patients divided into different groups based on the the summed values, (f, j) to two groups: black= SPARCL1/NID1 expression lower than cutoff and, blue = SPARCL1/NID1 expression higher than cutoff. (gi) two groups: Black = C1QTNF1/CRTAC1/MEGF9 lower than cutoff, red = C1QTNF1/CRTAC1/MEGF9 expression higher than cutoff. (v, x, z, ß) to three groups: black = both expression lower than cutoff, blue= one cutoff criteria met, red = both expression higher than cutoff. (qt) Patients were divided by the number proteins that have equal or more than cut-off level to four groups: Black = 0 Blue = 1 Red = 2 Purple = 3 proteins. (p) Patients were divided by the number proteins that have equal or more than cut-off level to five groups: Black = 0 Blue = 1 Red = 2 Purple= 3 Cyan = 4 proteins. NID1 + SPARCL1 have the most ROC-AUC, while NID1 + MEGF9 (also in combination with C1QTNF1/CRTAC1) shows a high AUC for death/lung transplant vs survival prediction. Event-free survival is better correlated with NID1, SPARCL1, and MEGF9.
Extended Data Fig. 10
Extended Data Fig. 10. Classification of PAH decompensated RVs to early and late using panel of five potential biomarkers.
Extended ROC curves (associated AUCs, accuracy, and P-values), using panel of five proteins; (a, b) for prediction of late vs. early decompensated in both cohorts, as well as four proteins excluding SPARCL1 (c, d), and the most effective factors of each cohort independently (e, f). ROC-AUC values indicate the random forest model performance for discriminating patients with early or late decompensated RV. P-value has been calculated using one-sided Mann-Whitney (Wilcoxon-based) test for the H0: AUC = 0.5, and not corrected for multiple comparison as not applicable here. (g) Relative feature importance score for the performance of each protein in prediction of late vs. early decompensated RV in patients in both cohorts (related to Fig. 8m).

Comment in

References

    1. Konstam, M. A. et al. Evaluation and management of right-sided heart failure: a scientific statement from the American Heart Association. Circulation137, e578–e622 (2018). - PubMed
    1. Keranov, S. et al. CILP1 as a biomarker for right ventricular maladaptation in pulmonary hypertension. Eur. Respir. J.57, 1901192 (2021). - PubMed
    1. van der Bruggen, C. E. E., Tedford, R. J., Handoko, M. L., van der Velden, J. & de Man, F. S. RV pressure overload: from hypertrophy to failure. Cardiovasc. Res.113, 1423–1432 (2017). - PubMed
    1. Ryan, J. J. et al. Right ventricular adaptation and failure in pulmonary arterial hypertension. Can. J. Cardiol.31, 391–406 (2015). - PMC - PubMed
    1. Park, J. F. et al. Transcriptomic analysis of right ventricular remodeling in two rat models of pulmonary hypertension: identification and validation of epithelial-to-mesenchymal transition in human right ventricular failure. Circ. Heart. Fail.14, e007058 (2021). - PMC - PubMed

Publication types

MeSH terms