

Latent Profiles of Childhood Adversity, Adolescent Mental Health, and Neural Network Connectivity
- PMID: 39196556
- PMCID: PMC11358864
- DOI: 10.1001/jamanetworkopen.2024.30711
Latent Profiles of Childhood Adversity, Adolescent Mental Health, and Neural Network Connectivity
Abstract
Importance: Adverse childhood experiences are pervasive and heterogeneous, with potential lifelong consequences for psychiatric morbidity and brain health. Existing research does not capture the complex interplay of multiple adversities, resulting in a lack of precision in understanding their associations with neural function and mental health.
Objectives: To identify distinct childhood adversity profiles and examine their associations with adolescent mental health and brain connectivity.
Design, setting, and participants: This population-based birth cohort used data for children who were born in 20 large US cities between 1998 and 2000 and participated in the Future Families and Child Well-Being Study. Families were interviewed when children were born and at ages 1, 3, 5, 9, and 15 years. At age 15 years, neuroimaging data were collected from a subset of these youths. Data were collected from February 1998 to April 2017. Analyses were conducted from March to December 2023.
Exposures: Latent profiles of childhood adversity, defined by family and neighborhood risks across ages 0 to 9 years.
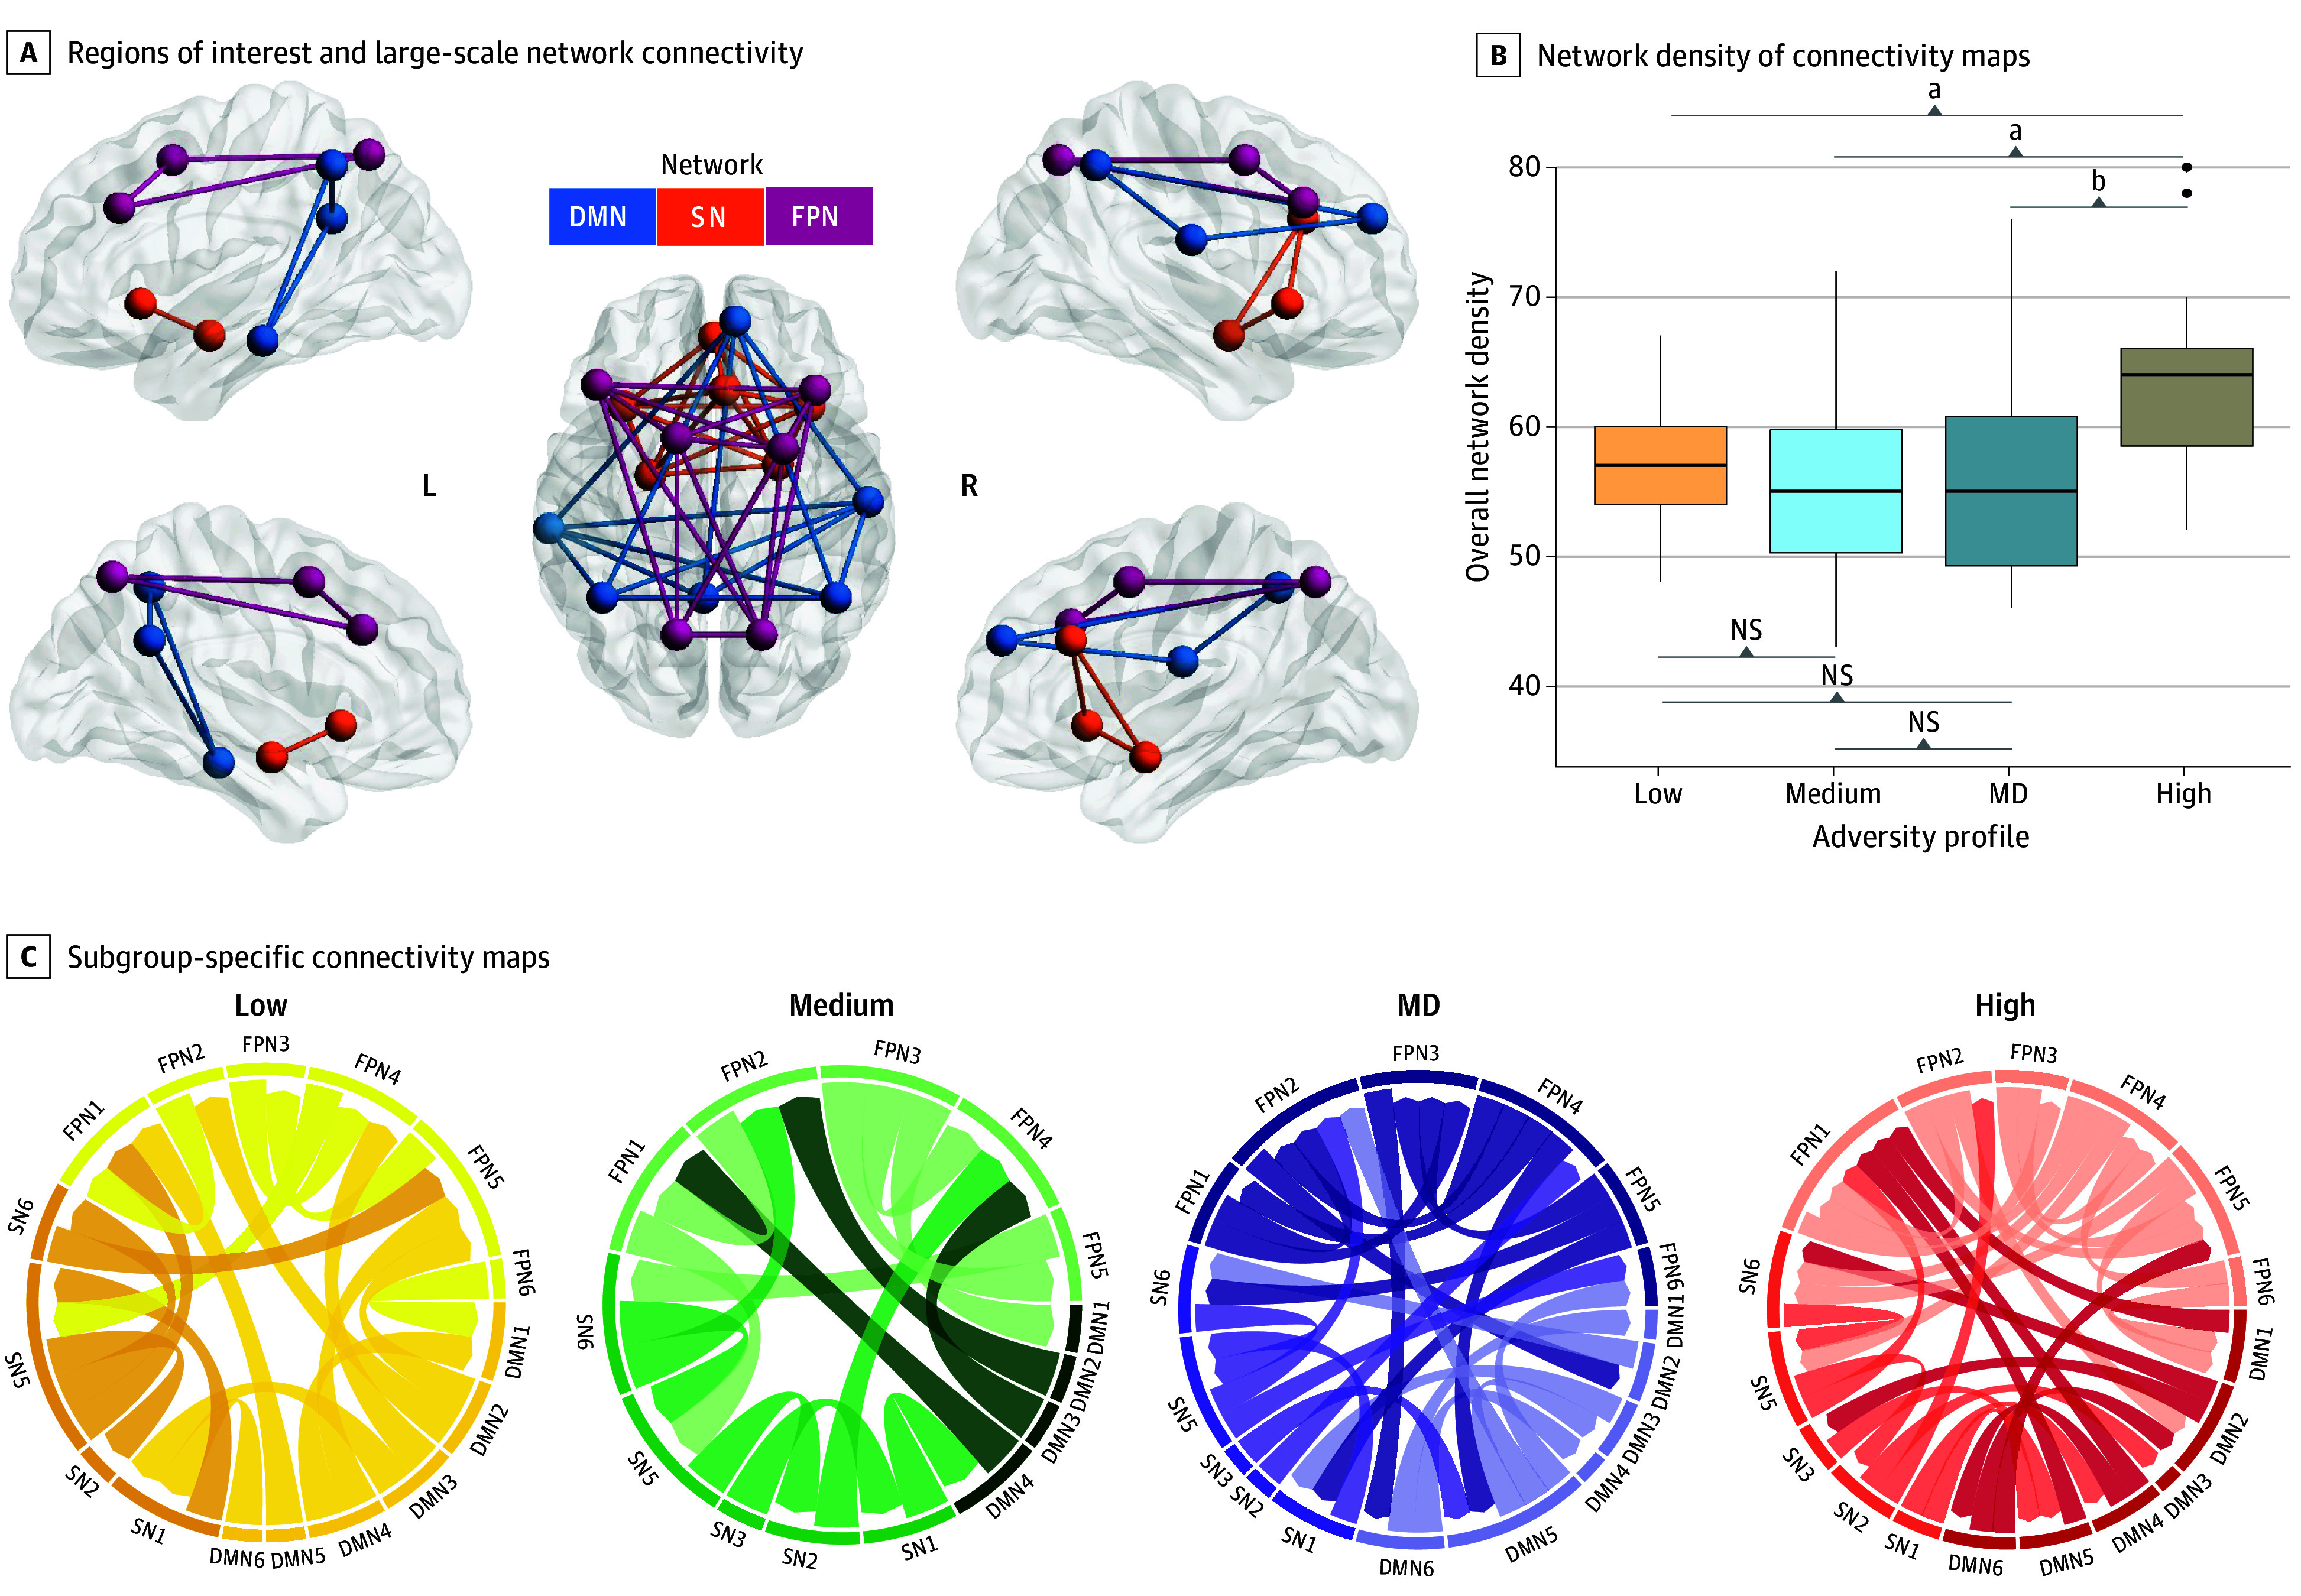
Main outcomes and measures: Internalizing and externalizing symptoms at age 15 years using parent- and youth-reported measures. Profile-specific functional magnetic resonance imaging connectivity across the default mode network (DMN), salience network (SN), and frontoparietal network (FPN).
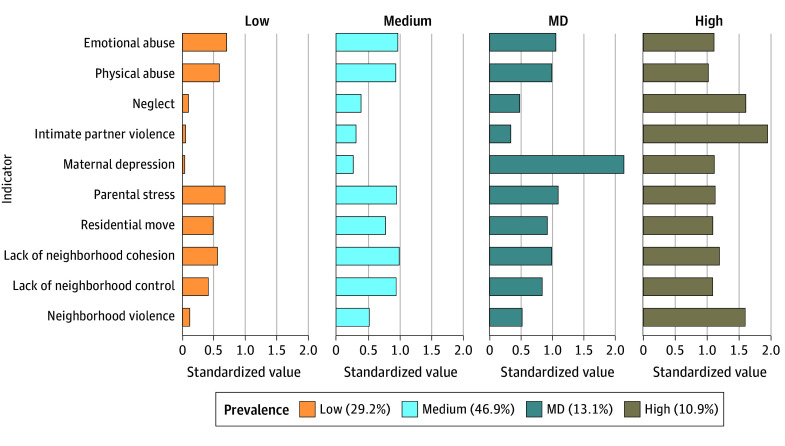
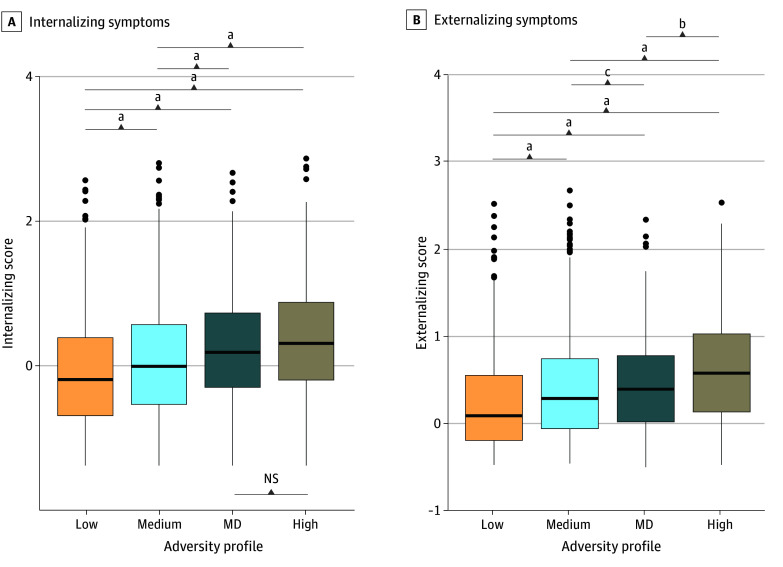
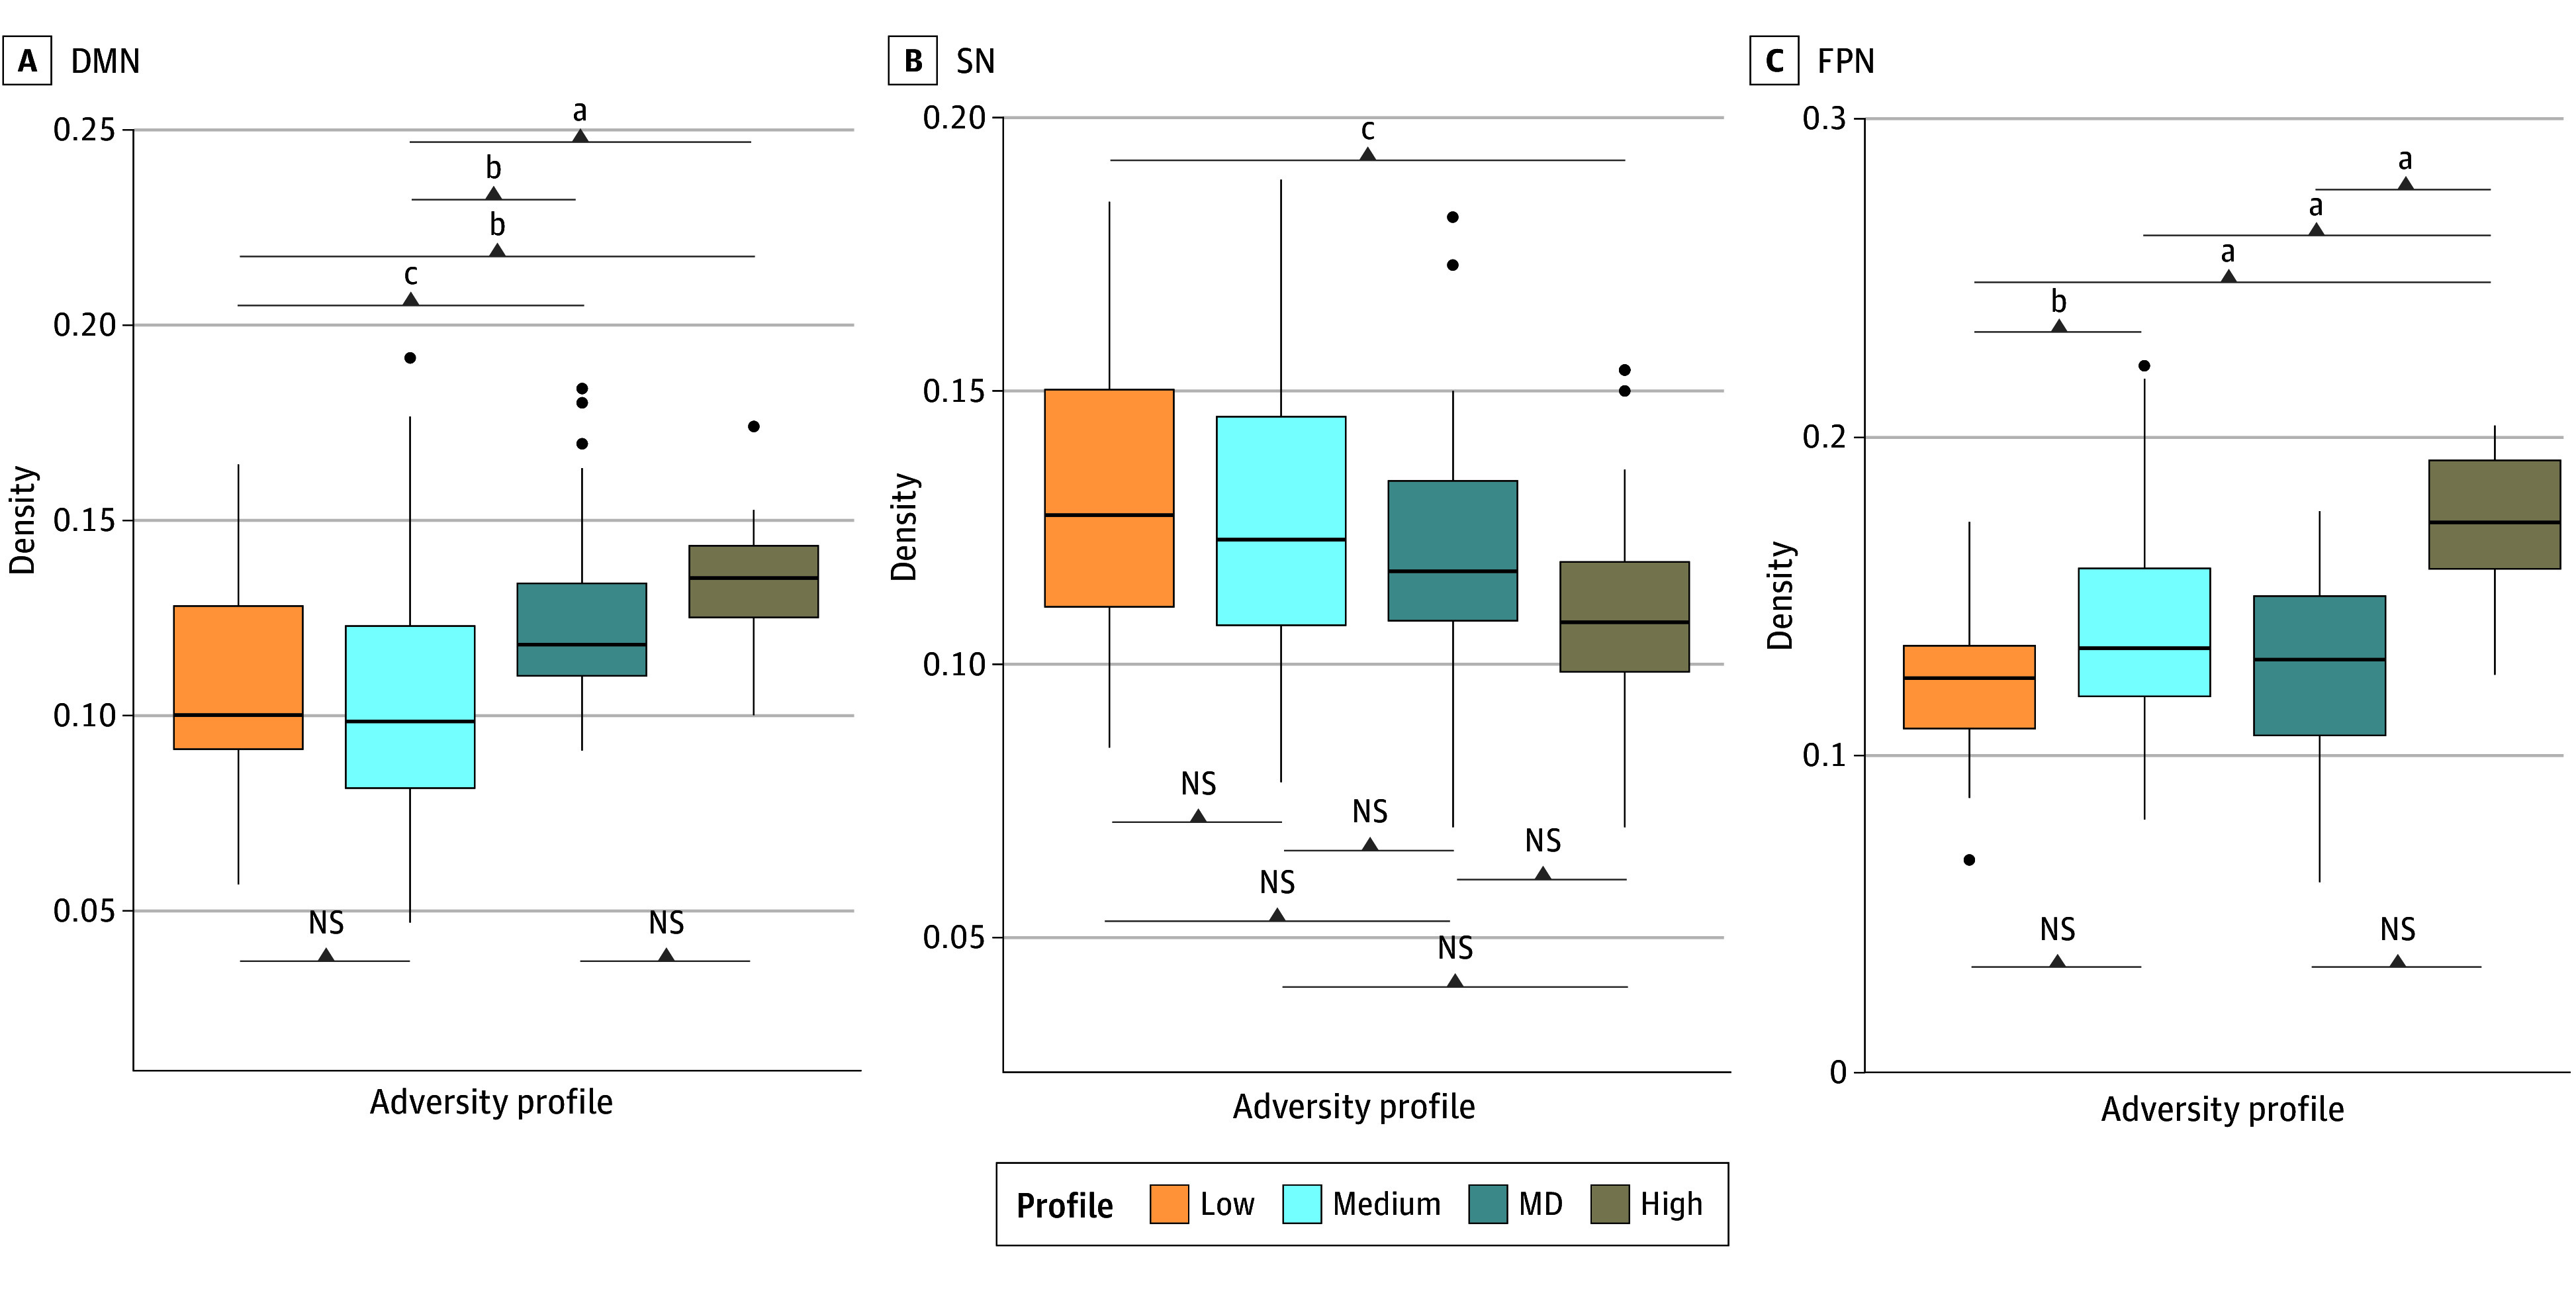
Results: Data from 4210 individuals (2211 [52.5%] male; 1959 [46.5%] Black, 1169 [27.7%] Hispanic, and 786 [18.7%] White) revealed 4 childhood adversity profiles: low-adversity (1230 individuals [29.2%]), medium-adversity (1973 [46.9%]), high-adversity (457 [10.9%]), and high maternal depression (MD; 550 [13.1%]). High-adversity, followed by MD, profiles had the highest symptoms. Notably, internalizing symptoms did not differ between these 2 profiles (mean difference, 0.11; 95% CI, -0.03 to 0.26), despite the MD profile showing adversity levels most similar to the medium-adversity profile. In the neuroimaging subsample of 167 individuals (91 [54.5%] female; 128 [76.6%] Black, 11 [6.6%] Hispanic, and 20 [12.0%] White; mean [SD] age, 15.9 [0.5] years), high-adversity and MD profiles had the highest DMN density relative to other profiles (F(3,163) = 11.14; P < .001). The high-adversity profile had lower SN density relative to the low-adversity profile (mean difference, -0.02; 95% CI, -0.04 to -0.003) and the highest FPN density among all profiles (F(3,163) = 18.96; P < .001). These differences were specific to brain connectivity during an emotion task, but not at rest.
Conclusions and relevance: In this cohort study, children who experienced multiple adversities, or only elevated MD, had worse mental health and different neural connectivity in adolescence. Interventions targeting multiple risk factors, with a focus on maternal mental health, could produce the greatest benefits.
Conflict of interest statement
Figures
References
-
- Green JG, McLaughlin KA, Berglund PA, et al. . Childhood adversities and adult psychiatric disorders in the national comorbidity survey replication I: associations with first onset of DSM-IV disorders. Arch Gen Psychiatry. 2010;67(2):113-123. doi:10.1001/archgenpsychiatry.2009.186 - DOI - PMC - PubMed
Publication types
MeSH terms
Grants and funding
LinkOut - more resources
Full Text Sources
Miscellaneous
