. 2024 Sep;602(17):4309-4326.
doi: 10.1113/JP286559. Epub 2024 Aug 28.

Loss of the alpha subunit distal furin cleavage site blunts ENaC activation following Na+ restriction

Affiliations

Loss of the alpha subunit distal furin cleavage site blunts ENaC activation following Na+ restriction

Andrew J Nickerson et al. J Physiol. 2024 Sep.

Abstract

Epithelial Na+ channels (ENaCs) are activated by proteolysis of the α and γ subunits at specific sites flanking embedded inhibitory tracts. To examine the role of α subunit proteolysis in channel activation in vivo, we generated mice lacking the distal furin cleavage site in the α subunit (αF2M mice). On a normal Na+ control diet, no differences in ENaC protein abundance in kidney or distal colon were noted between wild-type (WT) and αF2M mice. Patch-clamp analyses revealed similar levels of ENaC activity in kidney tubules, while no physiologically relevant differences in blood chemistry or aldosterone levels were detected. Male αF2M mice did exhibit diminished ENaC activity in the distal colon, as measured by amiloride-sensitive short-circuit current (ISC). Following dietary Na+ restriction, WT and αF2M mice had similar natriuretic and colonic ISC responses to amiloride. However, single-channel activity was significantly lower in kidney tubules from Na+-restricted αF2M mice compared with WT littermates. ENaC α and γ subunit expression in kidney and distal colon were also enhanced in Na+-restricted αF2M vs. WT mice, in association with higher aldosterone levels. These data provide evidence that disrupting α subunit proteolysis impairs ENaC activity in vivo, requiring compensation in response to Na+ restriction. KEY POINTS: The epithelial Na+ channel (ENaC) is activated by proteolytic cleavage in vitro, but key questions regarding the role of ENaC proteolysis in terms of whole-animal physiology remain to be addressed. We studied the in vivo importance of this mechanism by generating a mouse model with a genetic disruption to a key cleavage site in the ENaC's α subunit (αF2M mice). We found that αF2M mice did not exhibit a physiologically relevant phenotype under normal dietary conditions, but have impaired ENaC activation (channel open probability) in the kidney during salt restriction. ENaC function at the organ level was preserved in salt-restricted αF2M mice, but this was associated with higher aldosterone levels and increased expression of ENaC subunits, suggesting compensation was required to maintain homeostasis. These results provide the first evidence that ENaC α subunit proteolysis is a key regulator of channel activity in vivo.

Keywords: Ussing chamber; aldosterone; amiloride; cell biology; ion channels; nephrology; patch clamp; proteolysis.


Conflict of interest statement

Competing interests: The authors declare no competing interests.

The authors have declared that no conflict of interest exists.

Figures

Figure 1 –
Figure 1 –. Development of mice lacking the distal Furin cleavage site in ENaC’s α subunit (αF2M mice).
A: Genome editing strategy showing amino acid substitutions and inclusion of the Apal1 restriction site to facilitate genotyping. B: Representative image of Apal1-digested PCR products from wild type and mutant mice (see Methods for more details and primer sequences). C: Working model of ENaC activation by proteolysis of the α and γ subunits. Top left: uncleaved channels have very low activity. Top right: Furin cleaved channels have intermediate activity due to excision of the α subunit inhibitory tract, which resides between the F1 (proximal) and F2 (distal) furin consensus sequences. Bottom left: secondary cleavage of the γ subunit removes the γ inhibitory tract and fully activates the channel. Bottom right: αF2M mice, which lack the distal furin consensus site in the α subunit, are predicted to have low channel activity due to incomplete proteolysis and retention of the α subunit inhibitory tract.
Figure 2 –
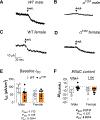
Figure 2 –. ENaC activity in the CNT/CCD is similar between WT and αF2M mice under normal dietary conditions.
A-B: Representative cell-attached recordings showing basal ENaC activity in connecting tubule/collecting duct (CNT/CCD) PC apical membranes patches from WT (A) and αF2M (B) mice fed a normal chow diet. Current amplitudes corresponding to channel “closed” and “open” states are indicated by dashed lines and labelled to the right of the traces. Both of the representative recordings were obtained from male mice. C-E: Group data showing total ENaC activity (NPO), number of observed channels/patch (N), and calculated single channel open probability (PO) from PC apical membrane patches using CNT/CCDs isolated from WT and αF2M mice of either sex under normal dietary conditions. Columns and error bars represent mean ± SD. n = 6–7 (N ≥ 3 animals) for each group. Data were analyzed via two-way ANOVA. Data were normalized by log-transforming prior to analysis.
Figure 3 –
Figure 3 –. ENaC activity in the distal colon is reduced in αF2M versus WT males, but not females, under normal dietary conditions.
A-D: Representative short-circuit current (ISC) responses to mucosal amiloride (100 μM), measured using distal colon segments isolated from WT and αF2M mice of either sex. All mice were maintained on a normal chow diet. E-F: Group data showing baseline (E) and amiloride-sensitive (ENaC-dependent; F) currents measured under normal dietary conditions. Columns and error bars represent mean ± SD. n = 5–6 animals for each group. Data were analyzed via two-way ANOVA and individual comparisons made with Tukey’s post-hoc.
Figure 4 –
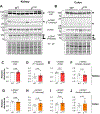
Figure 4 –. ENaC subunit expression in the kidney and distal colon is similar between αF2M and WT mice under normal dietary conditions.
A-B: Representative immunoblots of kidney (A) and distal colon (B) homogenates from male WT and αF2M mice maintained on a normal chow diet. Each target protein is indicated, and molecular weight markers are shown to the left of each blot, with weights given in kDa. Arrows and arrowheads to the right of each blot indicate full length and cleaved fragments of α-ENaC, respectively. Stain-free (S.F.) gel images showing even protein loading are included below the blots. C-J: Quantification of each indicated target protein from kidney or distal colon lysates. Columns and error bars represent mean ± SD. n = 5–6 animals for each group. Comparisons were made via unpaired, two-tailed Student’s t test.
Figure 5 –
Figure 5 –. ENaC single channel activity in the CNT/CCD is reduced in αF2M versus WT mice during dietary Na+ restriction.
A-B: Representative cell-attached recordings showing ENaC activity in PC apical membranes patches from male WT (A) and αF2M (B) mice fed a low Na+ (<0.01%) diet for 8 days. Current amplitudes corresponding to channel “closed” and “open” states are indicated by dashed lines and labelled to the right of the traces. C-E: Total ENaC activity (NPO), number of observed channels/patch (N), and calculated single channel open probability (PO) measured in CNT/CCDs isolated from Na+-restricted male WT and αF2M mice. For comparison of ENaC activity in CNT/CCDs from WT and αF2M mice under normal vs. low Na+ conditions, data from male mice fed a normal chow diet are re-plotted from Figure 2C-E (shaded gray panels). Columns and error bars represent mean ± SD. n = 6–8 (N ≥ 3 animals) for each group. Data were analyzed via two-way ANOVA and individual comparisons made with Tukey’s post-hoc. NPO and N data (C-D) were normalized by log-transforming prior to analysis.
Figure 6 –
Figure 6 –. Amiloride induces similar urinary responses in Na+-restricted WT and αF2M mice.
Male WT and αF2M mice were maintained on a low Na+ diet for 8 days prior to the experiment. Amiloride was given via intraperitoneal injection (2 mg/kg). Total urine output (A), as well as urinary Na+ (B), K+ (C), and Cl (D) excretion were measured over the following 3 hours. Columns and error bars represent mean ± SD. n = 6 animals for each group. Comparisons were made via unpaired, two-tailed Student’s t test.
Figure 7 –
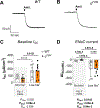
Figure 7 –. ENaC activity in the distal colon is similar between αF2M and WT mice during dietary Na+ restriction.
A-B: Representative short-circuit current (ISC) responses to mucosal amiloride (100 μM), measured using distal colon segments isolated from WT (A) and αF2M (B) male mice fed a low Na+ diet for 8 days. C-D: Group data showing baseline (C) and amiloride-sensitive (ENaC-dependent; D) currents. For comparison of ENaC activity in WT and αF2M mice under normal vs. low Na+ conditions, data from male mice fed a normal chow diet are re-plotted from Figure 3 E-F (shaded gray panels). Columns and error bars represent mean ± SD. n = 5–8 animals for each group. Data were analyzed via two-way ANOVA and individual comparisons made with Tukey’s post-hoc. Amiloride-sensitive ISC data (D) were normalized by log-transforming prior to analysis
Figure 8 –
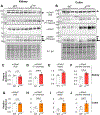
Figure 8 –. Dietary Na+ restriction induces greater ENaC α and γ subunit expression and processing in αF2M versus WT mice.
A-B: Immunoblots of kidney (A) and distal colon (B) homogenates from male WT and αF2M mice maintained on a low Na+ diet for 8 days. Each target protein is indicated, and molecular weight markers are shown to the left of each blot, with weights given in kDa. Arrows and arrowheads to the right of each blot indicate full length and cleaved fragments, respectively. Double arrowhead indicates double (fully) cleaved γ-ENaC in PNGase F-treated lysates. Stain-free (S.F.) gel images showing even protein loading are included below the blots. C-F: Quantification of each indicated target protein from kidney lysates. G-J: Quantification of each indicated target protein from distal colon lysates. Columns and error bars represent mean ± SD. n = 4 animals for each group. Comparisons were made via unpaired, two-tailed Student’s t test.

References

    1. Al-Qusairi L, Basquin D, Roy A, Stifanelli M, Rajaram RD, Debonneville A, Nita I, Maillard M, Loffing J, Subramanya AR & Staub O. (2016). Renal tubular SGK1 deficiency causes impaired K+ excretion via loss of regulation of NEDD4–2/WNK1 and ENaC. Am J Physiol Renal Physiol 311, F330–342. - PMC - PubMed
    1. Alzamora R, O’Mahony F, Bustos V, Rapetti-Mauss R, Urbach V, Cid LP, Sepulveda FV & Harvey BJ. (2011). Sexual dimorphism and oestrogen regulation of KCNE3 expression modulates the functional properties of KCNQ1 K(+) channels. J Physiol 589, 5091–5107. - PMC - PubMed
    1. Amasheh S, Epple HJ, Mankertz J, Detjen K, Goltz M, Schulzke JD & Fromm M. (2000). Differential regulation of ENaC by aldosterone in rat early and late distal colon. Ann N Y Acad Sci 915, 92–94. - PubMed
    1. Asher C, Wald H, Rossier BC & Garty H. (1996). Aldosterone-induced increase in the abundance of Na+ channel subunits. Am J Physiol 271, C605–611. - PubMed
    1. Bhalla V & Hallows KR. (2008). Mechanisms of ENaC regulation and clinical implications. J Am Soc Nephrol 19, 1845–1854. - PubMed

LinkOut - more resources