. 2024 Aug 28:13:RP91745.
doi: 10.7554/eLife.91745.

Recent evolutionary origin and localized diversity hotspots of mammalian coronaviruses

Affiliations

Recent evolutionary origin and localized diversity hotspots of mammalian coronaviruses

Renan Maestri et al. Elife. .

Abstract

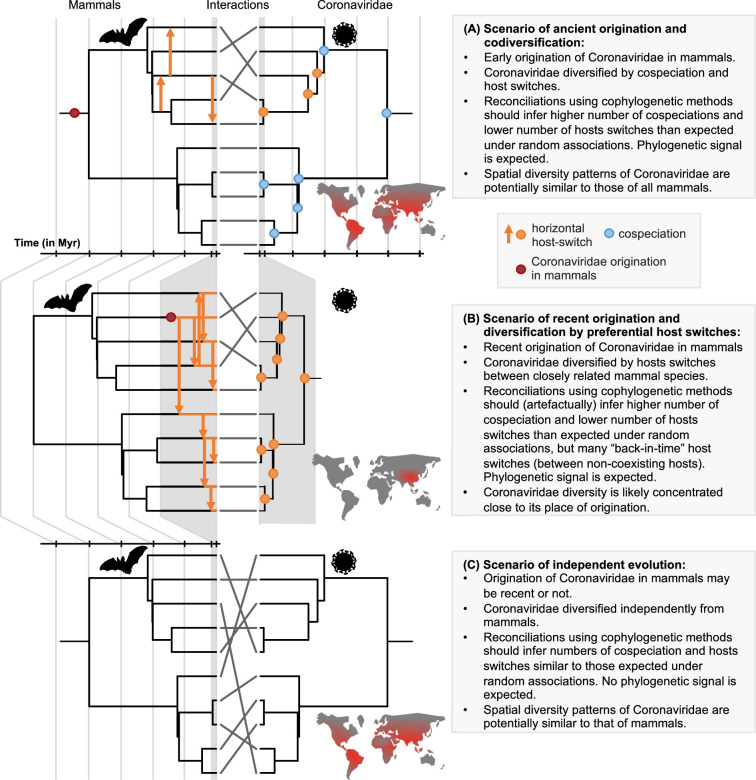
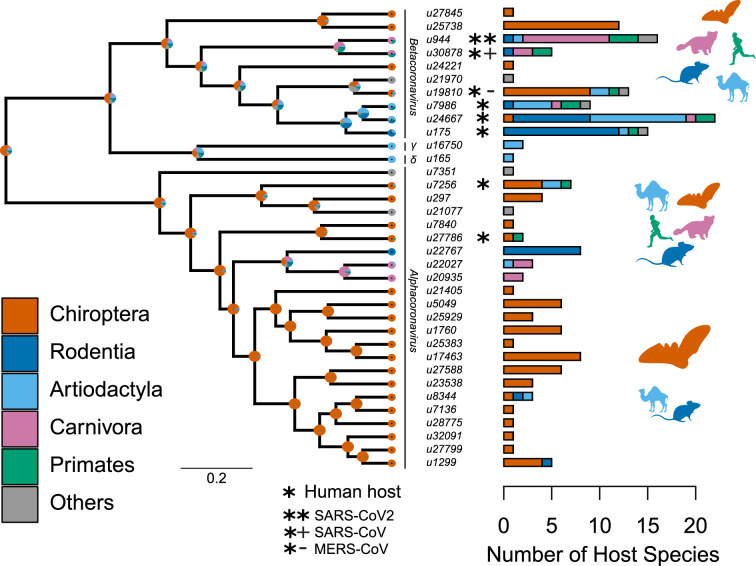
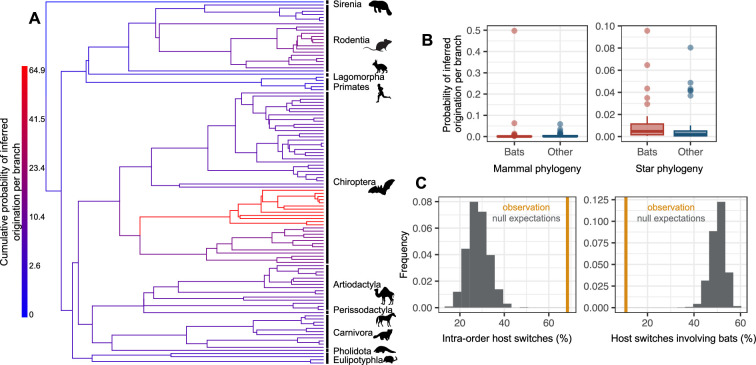
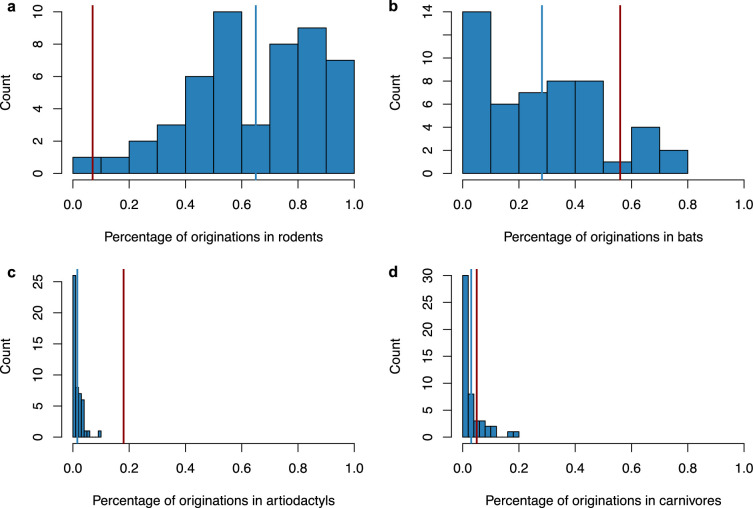
Several coronaviruses infect humans, with three, including the SARS-CoV2, causing diseases. While coronaviruses are especially prone to induce pandemics, we know little about their evolutionary history, host-to-host transmissions, and biogeography. One of the difficulties lies in dating the origination of the family, a particularly challenging task for RNA viruses in general. Previous cophylogenetic tests of virus-host associations, including in the Coronaviridae family, have suggested a virus-host codiversification history stretching many millions of years. Here, we establish a framework for robustly testing scenarios of ancient origination and codiversification versus recent origination and diversification by host switches. Applied to coronaviruses and their mammalian hosts, our results support a scenario of recent origination of coronaviruses in bats and diversification by host switches, with preferential host switches within mammalian orders. Hotspots of coronavirus diversity, concentrated in East Asia and Europe, are consistent with this scenario of relatively recent origination and localized host switches. Spillovers from bats to other species are rare, but have the highest probability to be towards humans than to any other mammal species, implicating humans as the evolutionary intermediate host. The high host-switching rates within orders, as well as between humans, domesticated mammals, and non-flying wild mammals, indicates the potential for rapid additional spreading of coronaviruses across the world. Our results suggest that the evolutionary history of extant mammalian coronaviruses is recent, and that cases of long-term virus-host codiversification have been largely over-estimated.

Keywords: codiversification; coevolution; coronavirus evolution; diversity of coronaviruses; epidemiology; evolutionary biology; global health; human; parasite diversification; preferential host switching; virus.

Plain language summary

The SARS-CoV-2 virus, which caused the recent global coronavirus pandemic, is the latest in a string of coronaviruses that have caused serious outbreaks. This group of coronaviruses can also infect other mammals and likely jumped between species – including from non-humans to humans – over the course of evolution. Determining when and how viruses evolved to infect humans can help scientists predict and prevent outbreaks. However, tracking the evolutionary trajectory of coronaviruses is challenging, and there are conflicting views on how often coronaviruses crossed between species and when these transitions likely occurred. Some studies suggest that coronaviruses originated early on in evolution and evolved together with their mammalian hosts, only occasionally jumping to and from different species. While others suggest they appeared more recently, and rapidly diversified by regularly transferring between species. To determine which is the most likely scenario, Maestri, Perez-Lamarque et al. developed a computational approach using already available data on the genetics and evolutionary history of mammals and coronaviruses. This revealed that coronaviruses originated recently in bats from East Asia and Europe, and primarily evolved by rapidly transferring between different mammalian species. This has led to geographical hotspots of diverse coronaviruses in East Asia and Europe. Maestri, Perez-Lamarque et al. found that it was rare for coronaviruses to spill over from bats to other types of mammals. Most of these spillovers resulted from coronaviruses jumping from bats to humans or domesticated animals. Humans appeared to be the main intermediary host that coronaviruses temporarily infected as they transferred from bats to other mammals. These findings – that coronaviruses emerged recently in evolution, jumped relatively frequently between species, and are geographically restricted – suggest that future transmissions are likely. Gathering more coronavirus samples from across the world and using even more powerful analysis tools could help scientists understand more about how these viruses recently evolved. These insights may lead to strategies for preventing new coronaviruses from emerging and spreading among humans.


Conflict of interest statement

RM, BP, AZ, HM No competing interests declared

Figures

Figure 1.
Figure 1.. A framework for testing scenarios of virus-host evolution, illustrated with the example of Coronaviridae and their mammalian hosts.
In (A), a scenario of ancient origination and codiversification; in (B) a scenario of recent origination and diversification by preferential host switches; and in (C) a scenario of independent evolution. For each scenario, we indicate the associated predictions in the grey boxes. Contrary to scenario C, both scenarios A and B are expected to generate a cophylogenetic signal, i.e. closely-related coronaviruses tend to infect closely-related mammals, resulting in significant reconciliations when using topology-based probabilistic cophylogenetic methods, such as the undated version of ALE, Jane, or eMPRess. However, we expect scenario B to be distinguishable from scenario A in terms of the time consistency of host-switching events. Under scenario B, cophylogenetic methods wrongly estimate a combination of cospeciations and ‘back-in-time’ host switches (see Materials and methods and Results). We also expect different biogeographic patterns under the different scenarios, as illustrated by the maps, where the color gradient represents diversity levels (red: high diversity, grey: low diversity).
Figure 2.
Figure 2.. Species-level relationships among coronaviruses and their associated mammalian hosts.
The Maximum Clade Credibility phylogenetic tree of coronaviruses, reconstructed with BEAST2 based on 150-aa palmprint amino acid sequences of the RdRp gene, is shown on the left. sOTUs of Coronaviridae followed the definition of the Serratus project. The branching order of four genera of coronaviruses, Beta, Gamma, Delta, and Alphacoronaviruses, is shown. Bar scale is in units of aa substitution. On the right, a barplot gives the number of total mammalian host species and the number of host species by main mammalian order. Ancestral states on the left were obtained for illustrative purposes with the make.simmap function of the phytools R package (Revell, 2012). Mammal silhouettes taken from open-to-use sources in https://www.phylopic.org, detailed credits given in Supplementary file 1h.
Figure 2—figure supplement 1.
Figure 2—figure supplement 1.. Phylogenetic relationships among coronaviruses sOTUs.
Consensus Coronaviridae tree constructed in (a) BEAST2 and (b) PhyloBayes using the palmprint amino acid sequence information of the 35 sOTUs of coronaviruses infecting mammals. We pruned out multiple sequences per sOTU in the PhyloBayes tree (that we included for reconciliation analyses) to represent a OTU-level tree comparable the one obtained with BEAST2. u16750 corresponds to gammacoronaviruses, and u165 to deltacoronaviruses; the top subtrees correspond to alphacoronaviruses while the bottom subtrees correspond to betacoronaviruses.
Figure 2—figure supplement 2.
Figure 2—figure supplement 2.. Mammalian hosts of coronaviruses are shown within the full mammalian tree.
Mammalian tree with tip branches painted in red according to the species that are hosts of coronaviruses. Ancestral branches directly linked to the path toward terminal hosts were painted as well. Mammal silhouettes taken from open-to-use sources in https://www.phylopic.org, detailed credits given in Supplementary file 1h.
Figure 2—figure supplement 3.
Figure 2—figure supplement 3.. The association between coronaviruses and their mammalian hosts.
Coronaviruses tree on the left and mammalian tree on the right. The connections between coronaviruses and their hosts are shown with lines. Lines of different colors indicate different genera of coronaviruses (Betacoronaviruses in blue, Alphacoronaviruses in Orange). Mammal silhouettes taken from open-to-use sources in https://www.phylopic.org/, detailed credits given in Supplementary file 1h.
Figure 3.
Figure 3.. A network visualization of mammal-coronavirus interactions reveals the presence of phylogenetic signal, the isolation of bats, and the centrality of humans.
Species-level network representation of the interactions between mammal species and coronavirus sOTUs. Colored round nodes represent mammal species (colors indicate the mammalian order) and grey squared nodes correspond to coronavirus sOTUs. The position of the nodes reflects their similarity in interaction partners, i.e. the tendency of clustering of mammals belonging to the same order can be interpreted as the presence of phylogenetic signal in species interactions. Humans and SARS-Cov-2 are presented using bigger nodes. The plot was obtained using the Fruchterman-Reingold layout algorithm from the igraph R-package.
Figure 3—figure supplement 1.
Figure 3—figure supplement 1.. Phylogenetic signal in the association between coronaviruses and their mammalian hosts.
Coronaviruses tree on the left and mammalian tree on the right. Subclades tested for phylogenetic signal in the association matrix using Mantel tests are shown (see main text).
Figure 4.
Figure 4.. The origination of coronaviruses in mammals is estimated among bats, which tend to form a closed reservoir.
(A) Phylogenetic tree of the mammals with branches colored as the percentage of ALE reconciliations which inferred this branch or its ancestral lineages as the origination of coronaviruses in mammals. Red branches are likely originations, whereas blue branches are unlikely. (B) Boxplots recapitulating the probability of inferred origination per branch in bats versus other mammal orders, with ALE applied on the original mammal tree (left panel) or on the mammal tree transformed into a star phylogeny (right panel), therefore assuming an origination in extant species. (C) Distributions of the percentages of host switches occurring within mammalian orders (left panel) and between-orders involving bats (right panel). Observed values (in orange) are compared to null expectations if host switches were happening at random (in grey). Mammal silhouettes taken from open-to-use sources in https://www.phylopic.org/, detailed credits given in Supplementary file 1h.
Figure 4—figure supplement 1.
Figure 4—figure supplement 1.. ALE inferred significant reconciliations.
The number of cospeciation events (a), number of host switches (b), or number of losses (c) estimated on the original dataset (in orange) are significantly different from the numbers of events inferred when randomly shuffling the dataset (grey histograms; top row) or when shuffling by conserving mammal biogeography (by only shuffling species belonging the same biogeographic realm; bottom row).
Figure 4—figure supplement 2.
Figure 4—figure supplement 2.. Time-inconsistent host-switches.
ALE inferred a large proportion of time-inconsistent host switches (a–b), which can be not be explained by the uncertainty in node age estimates (c–d). (a) Histogram of the percentage of time-inconsistent host switches in each reconciliation obtained with ALE on the original dataset with the consensus mammal phylogeny. (b) Histogram of the time inconsistency (in Myr) of the inconsistent host switches. (c) Histogram of the percentage of time-inconsistent host switches in each reconciliation obtained with ALE on the original dataset accounting for the 95% credible interval of the node age estimates. Although the mean number of time-inconsistent host switches decreased from 20% to 17% (meaning that 3% of the time-inconsistent host switches may be due to uncertainty in node age estimates), the reconciliations still contain frequent and large time-inconsistencies. (d) Histogram of the time inconsistency (in Myr) of the inconsistent host switches accounting for the 95% credible interval of the node age estimates.
Figure 4—figure supplement 3.
Figure 4—figure supplement 3.. The origination of coronaviruses in mammals is not estimated among bats anymore when shuffling the dataset.
Phylogenetic trees of the mammals with branches colored as the percentages of ALE reconciliations which inferred this branch as the origination of coronaviruses in mammals when the dataset is randomly shuffled (a) or shuffled by conserving mammal biogeography by only shuffling species belonging to the same biogeographic realm; (b). Red branches are likely originations, whereas blue branches are unlikely.
Figure 4—figure supplement 4.
Figure 4—figure supplement 4.. The origination of coronaviruses in mammals is estimated among bats.
The boxplots indicated the probability of inferred origination per branch based on ALE reconciliations for bats lineages or non-bat lineages. ALE was either run on: (a) the original dataset with the mammal phylogeny, (b) a star phylogeny instead of the mammal phylogeny, (c) on randomly-shuffled datasets, or (d) on datasets shuffled based on mammal biogeography (i.e. by only shuffling species belonging the same biogeographic realm).
Figure 4—figure supplement 5.
Figure 4—figure supplement 5.. Validation of the interpretation of our results on the mammalian phylogeny using simulations of codiversification (left) or diversification by preferential host switches (right).
For each type of simulation – coronavirus-mammal codiversification (left) or coronavirus diversification by preferential host switches (right) –, we performed 50 independent simulations, ran ALE on the mammal phylogeny, and reported. (a) The percentage of reconciliations inferring an origination within bats. (b) The ratio of time-inconsistent host switches. (c) Time inconsistencies (in Myr). When simulating codiversification, ALE correctly infers an origination within bats, and few time-inconsistent host switches; when simulating preferential host switches, ALE correctly infers an origination within bats but with less certainty, and a significant fraction of time-inconsistent host switches. For each plot, the vertical red line corresponds to the results obtained on the original data (empirical mammal-coronaviruses associations) using ALE on the mammal phylogenetic tree. Results on the mammalian tree are consistent with a scenario of recent origination within bats and preferential host switches.
Figure 4—figure supplement 6.
Figure 4—figure supplement 6.. Validation of the interpretation of our results on the star phylogeny using simulations of diversification by preferential host switches.
For each type of simulation – coronavirus-mammal codiversification (left) or coronavirus diversification by preferential host switches (right) –, we performed 50 independent simulations, ran ALE on a star phylogeny, and reported. (a) The percentage of reconciliations happening within bats. (b) The percentages of within-order host switches. When simulating preferential host switches, ALE correctly infers a significant fraction of preferential host switches. For each plot, the vertical red line corresponds to the results obtained on the original data (empirical mammal-coronaviruses associations) using ALE on a star phylogeny.
Figure 4—figure supplement 7.
Figure 4—figure supplement 7.. Simulating a scenario of origination in rodents followed by a diversification by preferential host switches with higher diversification of coronaviruses within bats did not generate a spurious origination in bats.
We performed 50 independent simulations, ran ALE on a star phylogeny, and reported the percentage of originations within the main mammalian orders: rodents (a), bats (b), artiodactyls (c), and carnivores (d). For each plot, the vertical red line corresponds to the results obtained on the original data (empirical mammal-coronaviruses associations) using ALE on a star phylogeny, while the vertical blue line corresponds to the mean of the simulations. Originations were correctly inferred in rodents in the majority of the simulations (average percentage: 65%+/-s.d. 22%), and only in a minority of cases within bats (average percentage: 28%+/-s.d. 21%), artiodactyls (average percentage: 2%+/-s.d. 2%), or carnivores (average percentage: 3%+/-s.d. 4%).
Figure 4—figure supplement 8.
Figure 4—figure supplement 8.. Evidence of preferential host switches in coronaviruses.
(a) Numbers of within-order host switches estimated by ALE on the star mammal phylogeny (in orange) compared with the null expectations if host switches happen at random (grey histogram; obtained when randomizing the mammal species). (b) For some clades, the numbers of between-order host switches estimated by ALE on the star mammal phylogeny (in orange) are higher than expected by chance.
Figure 4—figure supplement 9.
Figure 4—figure supplement 9.. Host switches are less likely than expected by chance between bats (Chiroptera) and Artiodactyla or Rodentia.
Numbers of between-order host switches estimated by ALE on the star mammal phylogeny (in orange) compared with the null expectations if host switches happen at random (grey histogram; obtained when randomizing the mammal species).
Figure 4—figure supplement 10.
Figure 4—figure supplement 10.. The frequency of host switches seems to vary according to the coronavirus lineages.
On the top, we represented the phylogenetic tree of the coronavirus sOTUs reconstructed using BEAST2. For each extant sOTUs, we reported using boxplots, the total number of host switches that this OTU experienced since the coronavirus MRCA based on ALE reconciliations performed on a star phylogeny of mammals.
Figure 5.
Figure 5.. Maps of the diversity of coronaviruses and their mammal hosts.
In (A), the richness of species of coronaviruses; geographic range maps of coronaviruses were constructed after applying the host-filling method on the geographic range maps of mammalian hosts of coronaviruses. In (B), Faith, 1992 phylogenetic diversity of coronaviruses, calculated using the phylogenetic tree of coronaviruses (see main text). In (C) and (D), the richness and phylogenetic diversity of mammal hosts of coronaviruses, respectively. All maps are on the Mollweide projection.
Figure 5—figure supplement 1.
Figure 5—figure supplement 1.. Maps of the diversity of alpha and betacoronaviruses.
In (a), the richness of sOTUs of alphacoronaviruses and in (b) the richness of sOTUs of betacoronaviruses; geographic range maps of coronaviruses were constructed after applying the host-filling method on the geographic range maps of mammalian hosts of coronaviruses.
Author response image 1.

Update of

  • doi: 10.1101/2023.03.09.531875
  • doi: 10.7554/eLife.91745.1
  • doi: 10.7554/eLife.91745.2

Similar articles

Cited by

References

    1. Adams MJ, Lefkowitz EJ, King AMQ, Harrach B, Harrison RL, Knowles NJ, Kropinski AM, Krupovic M, Kuhn JH, Mushegian AR, Nibert ML, Sabanadzovic S, Sanfaçon H, Siddell SG, Simmonds P, Varsani A, Zerbini FM, Orton RJ, Smith DB, Gorbalenya AE, Davison AJ. 50 years of the International Committee on Taxonomy of Viruses: progress and prospects. Archives of Virology. 2017;162:1441–1446. doi: 10.1007/s00705-016-3215-y. - DOI - PubMed
    1. Alekseev KP, Vlasova AN, Jung K, Hasoksuz M, Zhang X, Halpin R, Wang S, Ghedin E, Spiro D, Saif LJ. Bovine-like coronaviruses isolated from four species of captive wild ruminants are homologous to bovine coronaviruses, based on complete genomic sequences. Journal of Virology. 2008;82:12422–12431. doi: 10.1128/JVI.01586-08. - DOI - PMC - PubMed
    1. Anthony SJ, Johnson CK, Greig DJ, Kramer S, Che X, Wells H, Hicks AL, Joly DO, Wolfe ND, Daszak P, Karesh W, Lipkin WI, Morse SS, Mazet JAK, Goldstein T, PREDICT Consortium Global patterns in coronavirus diversity. Virus Evolution. 2017;3:vex012. doi: 10.1093/ve/vex012. - DOI - PMC - PubMed
    1. Babaian A, Edgar R. Ribovirus classification by a polymerase barcode sequence. PeerJ. 2022;10:e14055. doi: 10.7717/peerj.14055. - DOI - PMC - PubMed
    1. Bailly-Bechet M, Martins-Simões P, Szöllosi GJ, Mialdea G, Sagot M-F, Charlat S. How long does wolbachia remain on board? Molecular Biology and Evolution. 2017;34:1183–1193. doi: 10.1093/molbev/msx073. - DOI - PubMed

LinkOut - more resources