. 2024 Aug 28;20(8):e1012436.
doi: 10.1371/journal.ppat.1012436. eCollection 2024 Aug.

Determinants of pegivirus persistence, cross-species infection, and adaptation in the laboratory mouse

Affiliations

Determinants of pegivirus persistence, cross-species infection, and adaptation in the laboratory mouse

Kylie Nennig et al. PLoS Pathog. .

Abstract

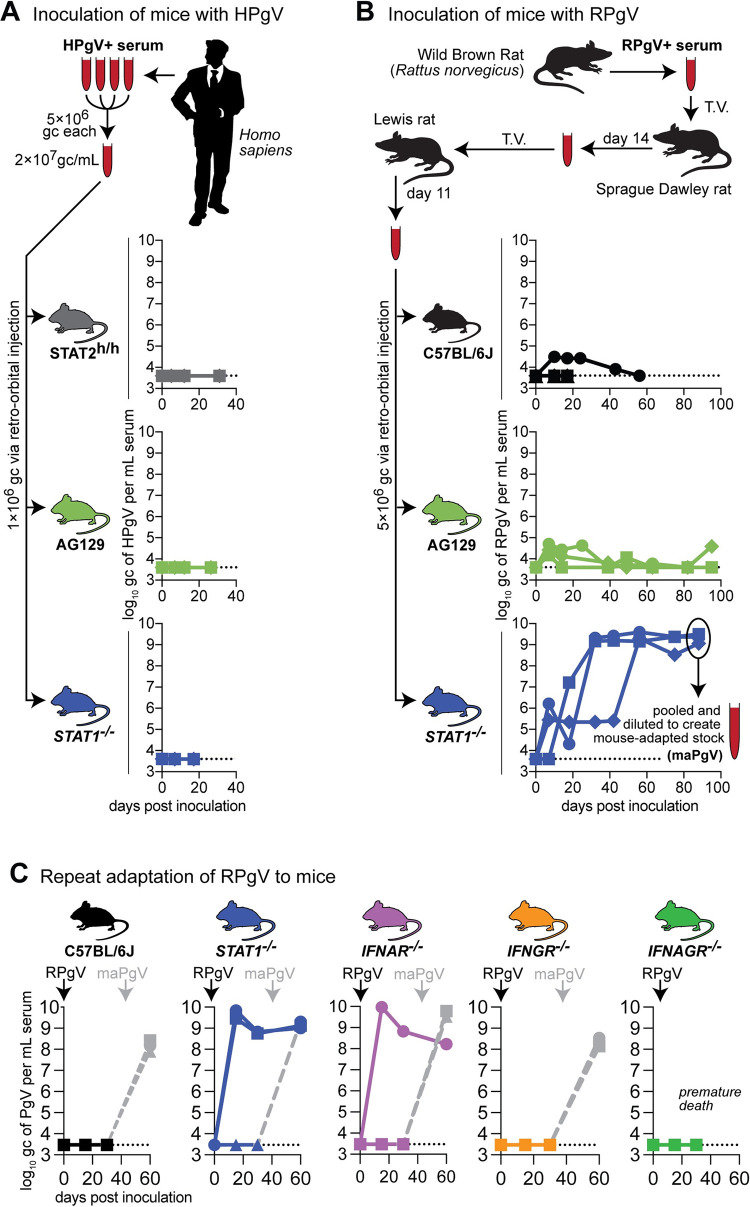
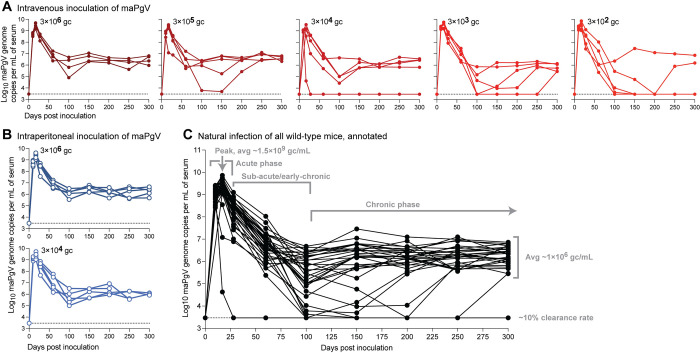
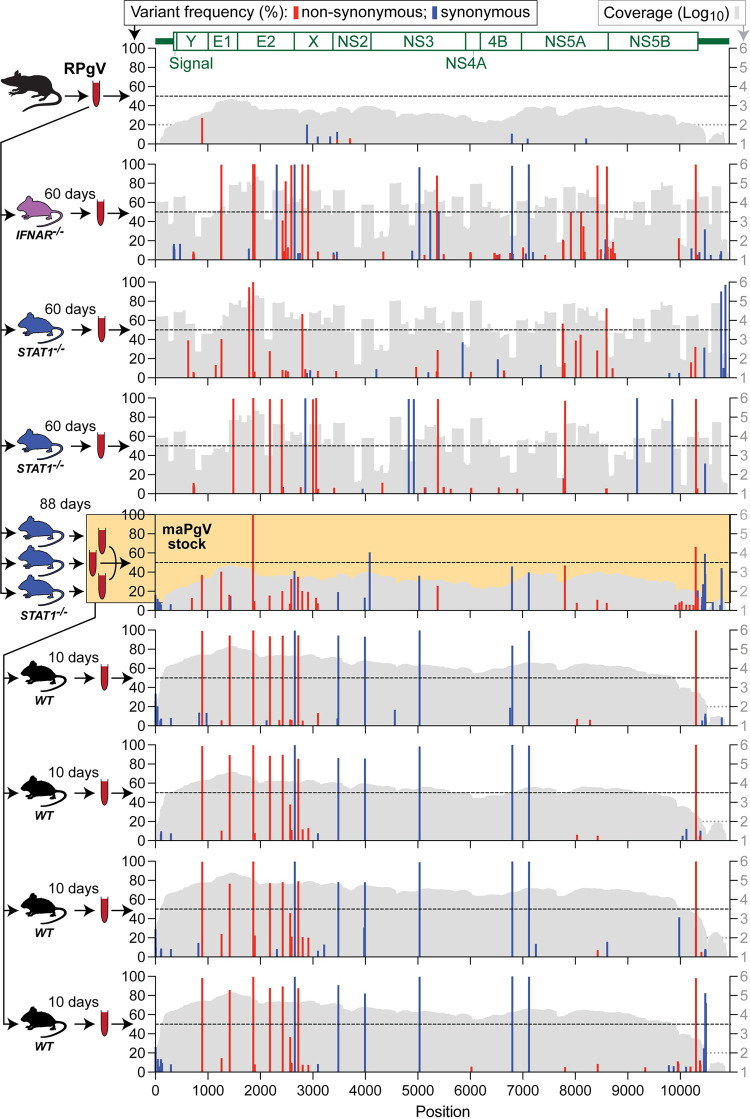
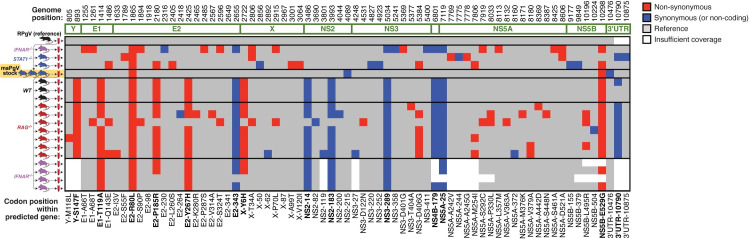
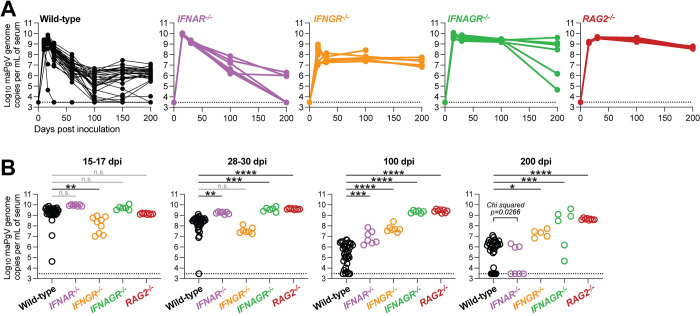
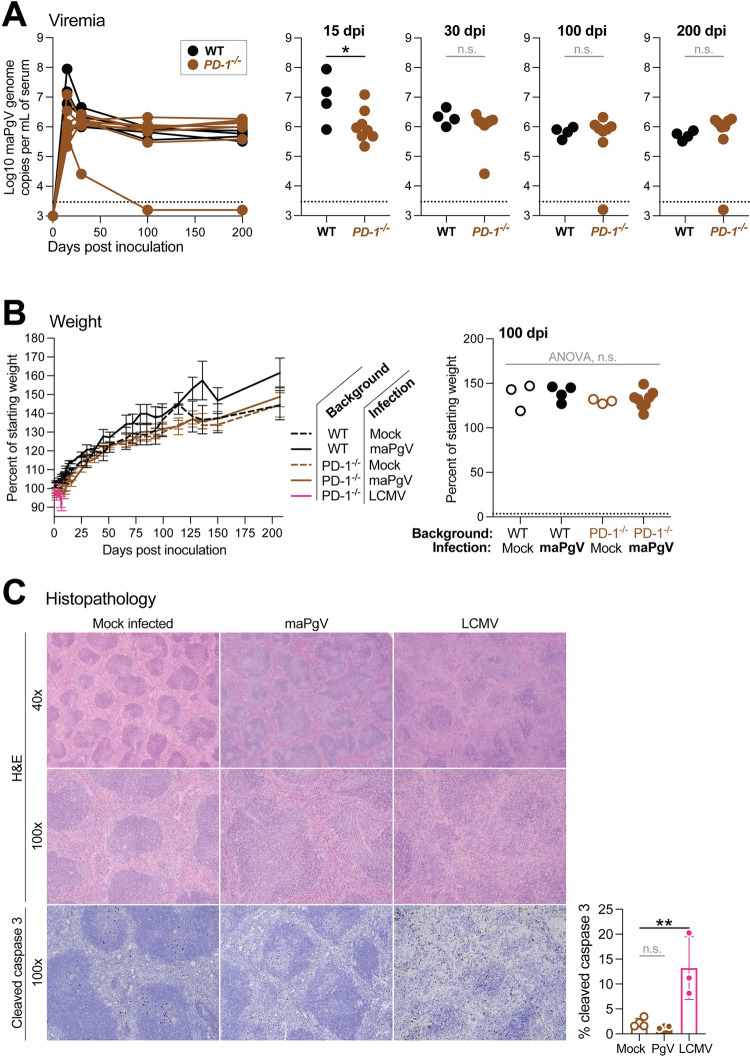
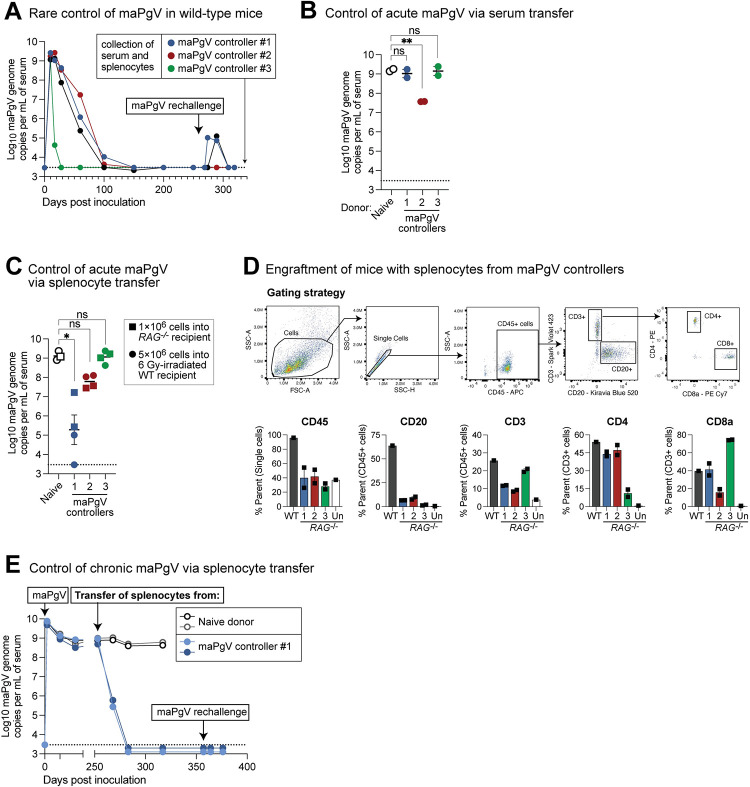
Viruses capable of causing persistent infection have developed sophisticated mechanisms for evading host immunity, and understanding these processes can reveal novel features of the host immune system. One such virus, human pegivirus (HPgV), infects ~15% of the global human population, but little is known about its biology beyond the fact that it does not cause overt disease. We passaged a pegivirus isolate of feral brown rats (RPgV) in immunodeficient laboratory mice to develop a mouse-adapted virus (maPgV) that established persistent high-titer infection in a majority of wild-type laboratory mice. maRPgV viremia was detected in the blood of mice for >300 days without apparent disease, closely recapitulating the hallmarks of HPgV infection in humans. We found a pro-viral role for type-I interferon in chronic infection; a lack of PD-1-mediated tolerance to PgV infection; and multiple mechanisms by which PgV immunity can be achieved by an immunocompetent host. These data indicate that the PgV immune evasion strategy has aspects that are both common and unique among persistent viral infections. The creation of maPgV represents the first PgV infection model in wild-type mice, thus opening the entire toolkit of the mouse host to enable further investigation of this persistent RNA virus infections.


Conflict of interest statement

David O’Connor is a founder of Pathogenuity LLC. All other authors have no competing interests to disclose.

Figures

Fig 1
Fig 1. Disabling the interferon-alpha–Stat-1 pathway enables adaptation of RPgV to mice.
(A) Pooled serum from multiple donors was inoculated into mice via retro-orbital injection: human STAT2-knock-in c57BL6/J mice (grey), IFNAGR-/- “AG”129 mice (green), or STAT1-/- mice (blue), n = 3 per group, with unique symbols for each individual. Serum HPgV loads were measured using an HPgV-specific RT-qPCR assay, with the dashed line demarcating the limit of detection. (B) Serum containing RPgV was inoculated into mice via retro-orbital injection: wild-type c57BL6/J (black), IFNAGR-/- “AG”129 mice (green), and STAT1-/- mice (blue), n = 3 per group, with unique symbols for each individual. Serum from the 3 STAT1-knockout mice was collected and pooled to create a large “mouse-adapted” pegivirus (maPgV) virus stock. (C) Repeat of the RPgV adaptation study was performed via via retro-orbital injection of RPgV into: human wild-type c57BL6/J mice (black), STAT1-/- mice (blue), IFNAR-/- “AG”129 mice (purple), IFNGR-/- “AG”129 mice (yellow), or IFNAGR-/- “AG”129 mice (green), n = 3 per group. Re-inoculation with maPgV to examine RPgV-induced immunity is shown in gray.
Fig 2
Fig 2. Persistent infection of wild-type mice with maPgV.
Serum viral loads in wild-type mice inoculated with maPgV via (A) retro-orbital (i.e., intravenous) injection (red) or (B) intraperitoneal injection (blue), n = 5 mice per group. (C) Viral loads of all animals in the route × dose study, with key phases of infection annotated in gray. Limit of detection for the viral load assay is shown as a dashed line.
Fig 3
Fig 3. A single mutation in the E2 envelope glycoprotein (R80L) is important for murine adaptation of RPgV.
Illumina deep sequencing of RPgV at various points during mouse adaptation. The genome position of RPgV/maPgV is shown along the X-axis, with a schematic of predicted mature proteins shown in green across the top. The frequency of non-synonymous mutations (red) and synonymous variants >5% relative to the RPgV consensus sequence are shown along the left Y-axis, with a dashed black line denoting 50% frequency (i.e., consensus-level variants). Coverage is shown in gray on a log10 scale along the right Y-axis with a read-depth cutoff of 100 shown as a gray dashed line, below which variants were not called. The pooled “maPgV stock” described in Fig 1 is highlighted in yellow. Note that some samples were sequenced via unbiased deep sequencing and others were sequenced by multiplexed PCR amplicon sequencing, generating the “mountainous” versus “city-scape” appearing coverage plots, respectively.
Fig 4
Fig 4. Thirteen mutations confer full murine adaptation of RPgV.
Summary of all consensus-level variants detected in the expanded sequencing dataset. Equivalent analysis to that shown for a subset in Fig 3 can be found in S1 Fig. Non-synonymous and synonymous variants are shown in red and blue, respectively. Coverage > 100 reads is shown in gray. The thirteen mutations that consistently accumulate during adaptation to the murine host are in bold along the bottom.
Fig 5
Fig 5. Predicted E1/E2 glycoprotein structures and mouse-adapting mutations.
(A) ColabFold-AlphaFold2 prediction of the E1/E2 heterodimeric envelope glycoprotein complex for RPgV. Color scale indicates the confidence of the prediction (predicted local distance differences test [pLDDT] red = low confidence; blue = high confidence). Interface predicted template modeling (ipTM) score provides a metric of the quality of heterodimer modeling, values closer to one are higher confidence. Curved lines indicate the approximate location of the viral membrane. (B) Annotations of the separated E1 and E2 glycoproteins, with previously described features common to hepaciviruses and pegiviruses highlighted in green and the observed mouse-adapting mutations shown in red. Inset displays the outward facing location of P184R and R80L on E2 (C) E1/E2 complex highlighting each subunit (E1:gold; E2: blue). (D) E1-E2 interaction interface, residues are color coded by their shortest distance to the partner protein (C⍺ to C⍺ distance [Å], as shown in the key) with gold denoting areas of contact and blue denoting those that are distant.
Fig 6
Fig 6. Predicted RPgV RNA genome structure and mouse-adapting mutations.
(A) RNAfold analysis comparing RPgV (pink) to maPgV (black) across the entire PgV genome, with genomic architecture depicted above the graph. Predicted RNA secondary structure of 200 nucleotide windows (step size = 1 nt) were computed using RNAfold and the RNA structure score (RSS; frequency of the MFE/ensemble diversity) and z-score of the RSS were calculated. Regions where structural stability differs significantly between RPgV and maPgV are identified and RNA structures are shown in greater detail, with the SNP highlighted in blue (B-D).
Fig 7
Fig 7. Type-I interferon signaling contributes to PgV persistence.
(A) Serum viral loads of maPgV in various immunocompromised mouse strains over time (wild-type: black, n = 25; IFNAR-/-: purple, n = 7; IFNGR-/-: orange, n = 7; IFNAGR-/-: green, n = 6; RAG-/-: red, n = 8). Combined data from two independent cohorts are shown. (B) Comparison of maPgV serum viral loads in immunocompromised mice strains at various time points during infection using one-way ANOVA in relation to wild-type mice, corrected for multiple comparisons (*:p≤0.05; **:p≤0.01; ***:p≤0.001; ****:p≤0.0001). Note: data from Wild-type mice is from the same data-set shown in Fig 2; data from immunocompromised mice is combined from two independent cohorts.
Fig 8
Fig 8. PgVs do not require PD-1-mediated immune tolerance for persistence.
Fig 9
Fig 9. Natural PgV immunity can be achieved via multiple immune mechanisms.
(A) Trajectories of viremia in 4 mice that ultimately cleared maPgV infection and were resistant to rechallenge. (B) Transfer of serum (100μL, via retro-orbital injection) from the maPgV-immune donors in part “A” into wild-type mice two days prior to maPgV inoculation. Colors correspond to the donors from part “A” throughout the figure. Viral loads are from 15 dpi (i.e., “peak”) maPgV viremia; one-way ANOVA with correction for multiple comparisons (**:p≤0.01). (C) Transfer of splenocytes from donors in part “A” into sublethally-irradiated (6 Gy) wild-type mice (5×10⁶ cells via retro-orbital injection, circular symbols) or RAG-/- mice four days prior to maPgV inoculation. Viral loads are from 15 dpi (i.e., “peak”) maPgV viremia; one-way ANOVA with correction for multiple comparisons (*:p≤0.05). (D) Flow cytometry plots demonstrating engraftment of donor lymphocytes in the maPgV-infected RAG-/- mice from part “C.” (E) Transfer of cryopreserved splenocytes from donor #1 (see part “A”) into chronically-infected RAG-/- mice (closed circles), with transfer of splenocytes from a naive donor (open circles) serving as a control.

References

    1. Postler TS, Beer M, Blitvich BJ, Bukh J, de Lamballerie X, Drexler JF, et al. Renaming of the genus Flavivirus to Orthoflavivirus and extension of binomial species names within the family Flaviviridae. Arch Virol. 2023;168: 224. doi: 10.1007/s00705-023-05835-1 - DOI - PubMed
    1. Stapleton JT, Foung S, Muerhoff AS, Bukh J, Simmonds P. The GB viruses: a review and proposed classification of GBV-A, GBV-C (HGV), and GBV-D in genus Pegivirus within the family Flaviviridae. The Journal of general virology. 2011;92: 233–246. doi: 10.1099/vir.0.027490-0 - DOI - PMC - PubMed
    1. Tacke M, Schmolke S, Schlueter V, Sauleda S, Esteban JI, Tanaka E, et al. Humoral immune response to the E2 protein of hepatitis G virus is associated with long-term recovery from infection and reveals a high frequency of hepatitis G virus exposure among healthy blood donors. Hepatology. 1997;26: 1626–1633. doi: 10.1002/hep.510260635 - DOI - PubMed
    1. Zhang W, Chaloner K, Tillmann HL, Williams CF, Stapleton JT. Effect of early and late GB virus C viraemia on survival of HIV-infected individuals: a meta-analysis. HIV medicine. 2006;7: 173–180. doi: 10.1111/j.1468-1293.2006.00366.x - DOI - PubMed
    1. Williams CF, Klinzman D, Yamashita TE, Xiang J, Polgreen PM, Rinaldo C, et al. Persistent GB virus C infection and survival in HIV-infected men. The New England journal of medicine. 2004;350: 981–990. doi: 10.1056/NEJMoa030107 - DOI - PubMed

LinkOut - more resources