. 2024 Aug 30;10(35):eadn0164.
doi: 10.1126/sciadv.adn0164. Epub 2024 Aug 28.

Tumor-induced natural killer cell dysfunction is a rapid and reversible process uncoupled from the expression of immune checkpoints

Affiliations

Tumor-induced natural killer cell dysfunction is a rapid and reversible process uncoupled from the expression of immune checkpoints

Kévin Pouxvielh et al. Sci Adv. .

Abstract

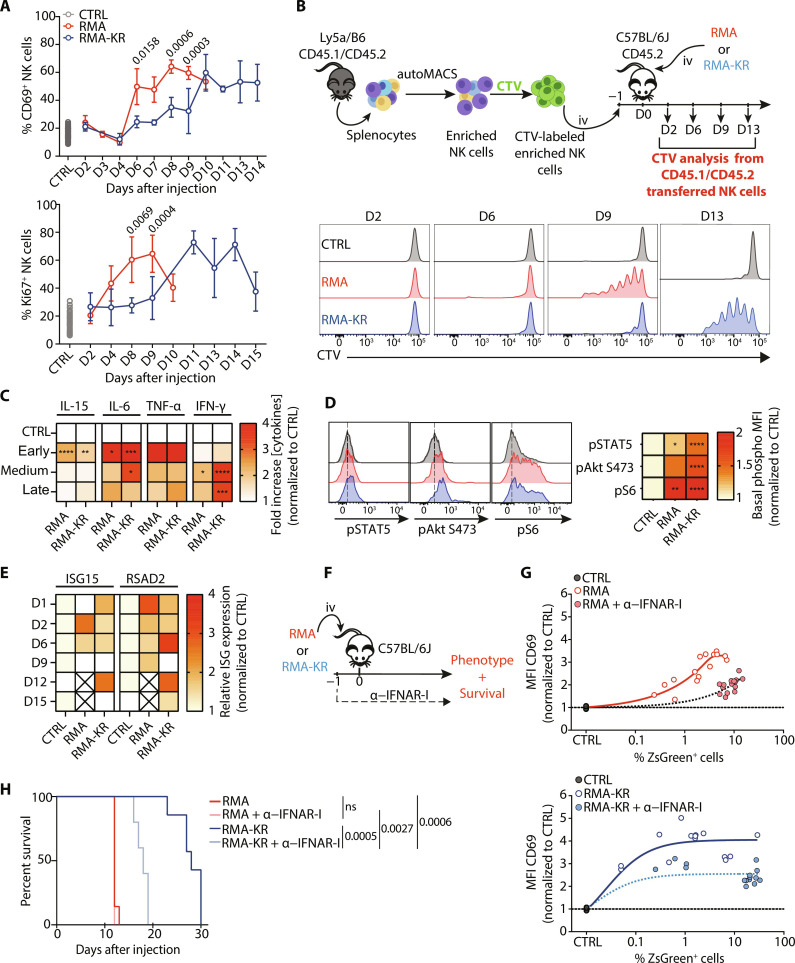
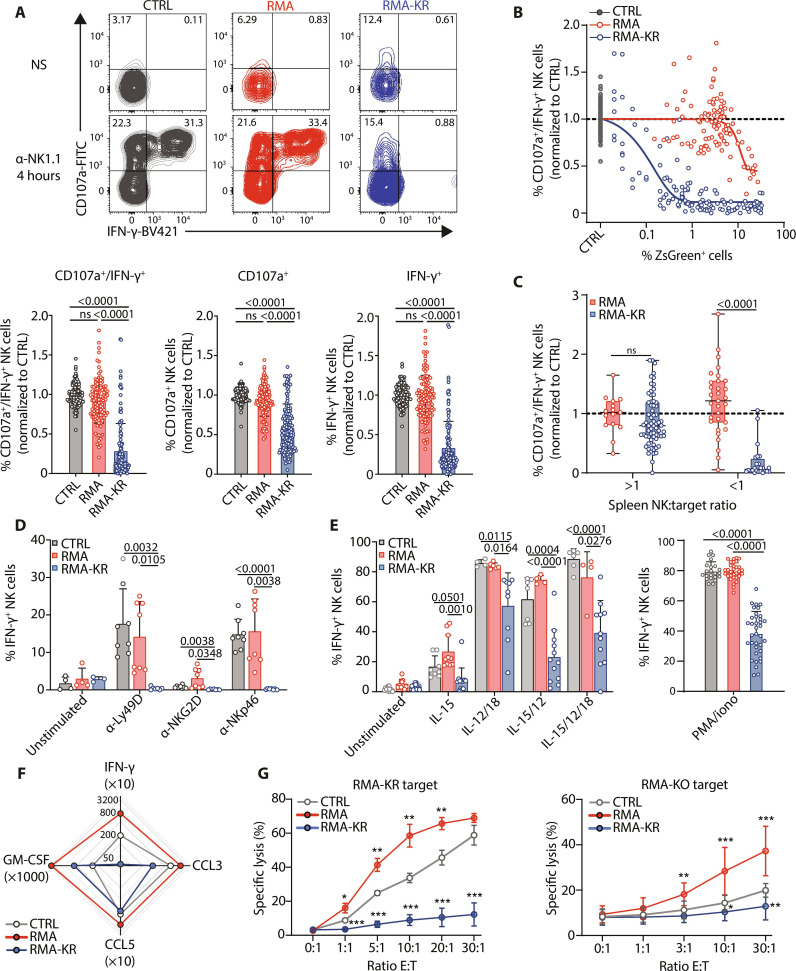
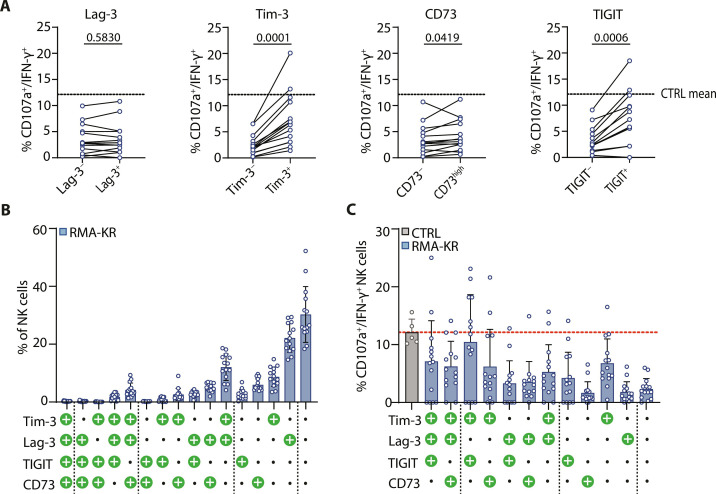
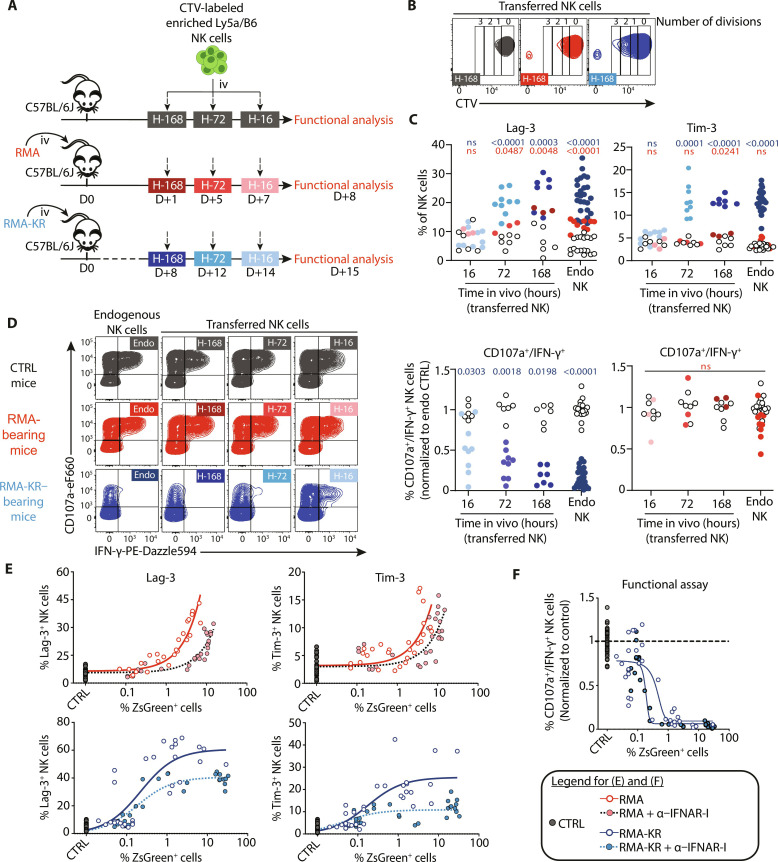
Natural killer (NK) cells often become dysfunctional during tumor progression, but the molecular mechanisms underlying this phenotype remain unclear. To explore this phenomenon, we set up mouse lymphoma models activating or not activating NK cells. Both tumor types elicited type I interferon production, leading to the expression of a T cell exhaustion-like signature in NK cells, which included immune checkpoint proteins (ICPs). However, NK cell dysfunction occurred exclusively in the tumor model that triggered NK cell activation. Moreover, ICP-positive NK cells demonstrated heightened reactivity compared to negative ones. Furthermore, the onset of NK cell dysfunction was swift and temporally dissociated from ICPs induction, which occurred as a later event during tumor growth. Last, NK cell responsiveness was restored when stimulation was discontinued, and interleukin-15 had a positive impact on this reversion. Therefore, our data demonstrate that the reactivity of NK cells is dynamically controlled and that NK cell dysfunction is a reversible process uncoupled from the expression of ICPs.


Figures

Fig. 1.
Fig. 1.. NK cells control of RMA-KR tumors.
(A) Flow cytometry analysis of H2Db and Rae1-β expression by RMA and RMA-KR cells. PE, phycoerythrin. (B) Survival analysis of mice injected intravenously (iv) with different numbers of RMA or RMA-KR cells, as indicated (n = 5 mice per group). Kaplan-Meier curves are shown and analyzed using the log-rank (Mantel-Cox) test (right). (C) Flow cytometry analysis of ZsGreen and CD3/19 (combined staining) in spleen cells from mice previously injected with tumor cells. (D) Kinetic analysis of the percentage of RMA or RMA-KR tumor cells among spleen cells in mice previously injected with tumor cells (total of 74 mice for RMA and 115 for RMA-KR). (E) RMA-KR cells were FACS-sorted from the spleen of C57BL/6J mice at late stages of tumor growth and used as targets in a cytotoxicity assay using resting NK cells as effectors; the original RMA-KR cultured line was used as the control (CTRL) (n = 3 mice per group). Two-way analysis of variance (ANOVA) followed by Sidak’s multiple comparison test. (F) Survival curve of mice previously depleted or not of NK cells by means of anti-NK1.1 injection [day −1 (D-1)] and injected with RMA or RMA-KR cells (day 0). The pictogram above the graph describes how the experiment was performed (n = 5 mice per group). (G) Survival curve of mice previously depleted or not of NK cells by means of anti-NK1.1 injection (timing as indicated) and injected with RMA or RMA-KR cells (day 0) (n = 5 mice per group). The pictogram above the graph describes how the experiment was performed. (H) RMA-KR cells were injected intravenously into Prf1−/− mice or control mice previously treated or not at day −1 with anti–IFN-γ and the overall survival was followed (n = 8 to 12 mice per group). The pictogram above the graph describes how the experiment was performed. In (F) to (H), Kaplan-Meier curves are shown and analyzed using the log-rank (Mantel-Cox) test (right). ns, not significant.
Fig. 2.
Fig. 2.. NK cells are activated by IFN-I and proliferate upon tumor growth.
(A) The percentage of CD69+ or Ki67+ splenic NK cells was measured by flow cytometry following tumor injection [(top) n = 39 to 72 mice per group]. Graphs show means ± SD. The Mann-Whitney test was used for group comparisons. (B) NK cells purified from Ly5a x C57BL/6J mice were stained with CTV and transferred into C57BL/6J mice. A total of 5 × 10⁷ RMA or RMA-KR cells were then injected, and mice were euthanized at the indicated time points to monitor NK cell proliferation. The pictogram above the graphs describes the experiment. Representative CTV histograms are shown (n = 3 mice per group per time point). (C) ELISA measurement of cytokine levels in the spleen exudate at early (day 2), intermediate (day 4 for RMA and day 6 for RMA-KR), and late time points (day 9 for RMA and day 12 for RMA-KR). Results are expressed as heatmaps normalized to control (n = 8 to 42 mice per group). Two-way ANOVA followed by Sidak’s multiple comparison test was performed for group comparisons (*P < 0.05; **P < 0.01; ***P < 0.001; ****P < 0.0001). (D) Flow cytometry analysis of STAT5, Akt, and S6 phosphorylation in spleen NK cells from mice injected with RMA or RMA-KR cells 9 or 15 days before, respectively. Results are expressed as heatmaps normalized to control NK cells (n = 6 to 33 mice per group). A Kruskal-Wallis analysis followed by Dunn’s multiple comparison test was used for group comparisons (*P < 0.05; **P < 0.01; ****P < 0.0001). MFI, mean fluorescence intensity. (E) RT-qPCR analysis of ISG15 and RSAD2 expression in spleen cells from mice injected with RMA or RMA-KR cells at the indicated time points. Results are expressed as heatmaps, normalized to control NK cells (n = 12 to 18 mice per group). (F to H) Mice were treated or not with IFNAR blocking antibody before tumor injection as depicted in (F). (G) Kinetic analysis of CD69 expression in NK cells (n = 5 to 15 mice per group). The curves were fitted using a nonlinear model. (H) Kaplan-Meier graph of mouse survival (n = 5 to 7 mice per group), analyzed according to the log-rank (Mantel-Cox) test (right).
Fig. 3.
Fig. 3.. RMA-KR tumor progression induces broad NK cell dysfunction.
Spleen NK cells from RMA- or RMA-KR–bearing mice were analyzed for different effector functions at different stages of tumor growth. (A to C) Spleen cells were stimulated for 4 hours with plate-bound NK1.1 antibody, and surface CD107a and intracellular IFN-γ were measured by flow cytometry. (A) (Top) Representative FACS plot of CD107/IFN-γ expression in spleen NK cells at late stages of tumor growth (n = 93 to 131 mice per group). NS, nonstimulated. (Bottom) Histogram analysis of means ± SD expression of CD107/IFN-γ. A Kruskal-Wallis analysis followed by Dunn’s multiple comparison test was used for group comparisons. (B) Analysis of the percentage of CD107a+ IFN-γ+ NK cells after NK1.1 stimulation relative to the percentage of tumor cells in the spleen (n = 90 to 215 mice per group). The curves were fitted using a nonlinear model. (C) Analysis of the percentage of CD107a+ IFN-γ+ NK cells after NK1.1 stimulation relative to the ratio between spleen NK cells and tumor cells (n = 15 to 66 mice per group). Graphs show means ± SD and a Mann-Whitney analysis. (D and E) The percentage of IFN-γ+ NK cells was measured in response to stimulation by anti-NKG2D, anti-Ly49D, or anti-NKp46 antibodies (n = 7 to 8 mice per group) (D) or different cytokines (n = 4 to 21 mice per group) or PMA/ionomycin (n = 22 to 36 mice per group) (E). Graphs show means ± SD and two-way ANOVA analysis followed by Tukey’s multiple comparison test [(D), left, and (E)] or Kruskal-Wallis analysis followed by Dunn’s multiple comparison test [(D), right]. (F) Levels of different cytokines produced by NK cells from the indicated mice (late stages of tumor growth) after stimulation with NK1.1 antibody (n = 5 to 7 mice per group). (G) Cytotoxicity assay of NK cells from the indicated conditions (late stages of tumor growth) against RMA-KR or RMA-KO (n = 4 to 15 mice per group) cell lines. Graphs show means ± SD and a two-way ANOVA analysis followed by Tukey’s multiple comparison test (*P < 0.05; **P < 0.01; ***P < 0.001).
Fig. 4.
Fig. 4.. NK cell dysfunction is not induced through transcriptional mechanisms.
(A to C) NK cells from RMA- or RMA-KR–bearing mice at late stages of tumor growth or from control mice were sorted by flow cytometry and subjected to RNA-seq analysis. (A) Volcano plots showing differential gene expression [fold change (FC) > 2 and adj. P value < 0.05] between RMA and control, RMA-KR and control, or RMA and RMA-KR conditions. (B) GSEA of the indicated gene modules [NK cell activation by cytokines (33)] in NK cells from RMA- or RMA-KR–bearing mice compared to controls. NES, Normalized Enrichment Scores. (C) GSEA of the indicated T cell exhaustion gene modules in NK cells from RMA- or RMA-KR–bearing mice compared to controls [(A) to (C) n = 3 mice per group]. For (B) to (C), the false discovery rate q values were determined compared to control (*P < 0.05; **P < 0.01; ****P < 0.0001). (D) Flow cytometry analysis of the percentage of NK cells expressing the indicated ICPs at the indicated time after tumor injection (n = 15 to 24 mice per group). Graphs show means ± SD, and a Kruskal-Wallis analysis followed by Dunn’s multiple comparison test was performed (P values are presented). (E) Coexpression of different ICPs (n = 6 to 14 mice per group).
Fig. 5.
Fig. 5.. ICP-positive NK cells are more reactive than ICP-negative NK cells.
Spleen cells were stimulated for 4 hours with plate-bound cross-linking NK1.1 antibody and stained for surface CD107a, various ICPs, and intracellular IFN-γ before analysis by flow cytometry. (A) Coexpression of CD107a and IFN-γ relative to the expression of the indicated ICPs in NK cells from RMA-KR–bearing mice is shown (n = 14). (B) Proportion of NK cells from RMA-KR–bearing mice expressing indicated different ICP combinations. (C) Coexpression of CD107a and IFN-γ relative to the combined expression of different ICPs from RMA-KR–bearing mice compared to control NK cells (n = 5 to 14 mice per group).
Fig. 6.
Fig. 6.. Dynamics of NK cell dysfunction, ICP induction, and proliferation in tumor-bearing mice.
(A to D) NK cells purified from Ly5a x C57BL/6J mice were stained with CTV and injected 16, 72, or 168 hours before end stage of tumor growth in RMA- or RMA-KR–bearing mice, as outlined in (A); control mice not injected with tumors were also included (N = 3 to 9 per condition). At the indicated time point (day 8 after RMA injection or day 15 after RMA-KR injection), spleen cells from transferred mice were analyzed by flow cytometry. (B) FACS plots of CTV fluorescence in transferred NK cells after 168 hours in recipient mice. (C) Percent of Lag-3+ and Tim-3+ cells among endogenous or transferred NK cells at the indicated time point (blue, RMA-KR recipient mice; red, RMA recipient mice; white, control recipient mice). (D) Reactivity of transferred NK cells to NK1.1-mediated stimulation, as determined by coexpression of CD107a and IFN-γ. Representative FACS plots of CD107a/IFN-γ expression in endogenous or transferred NK cells are shown for the different conditions on the left, and graphs of CD107a+/IFN-γ+ NK cells in individual mice (normalized to control NK cells) are shown on the right. Each point represents a single mouse, and a Kruskal-Wallis analysis followed by Dunn’s multiple comparison test was performed. (E and F) Mice were treated intraperitoneally with IFNAR blocking antibody (200 μg) at day −1 and injected intravenously with RMA or RMA-KR cells at day 0. The percentage of NK cells expressing Lag-3 or Tim-3 (E) was monitored at different stages of tumor growth. NK cell reactivity (F) expressed as the percentage of CD107a+ IFN-γ+ NK cells in response to NK1.1 antibody and relative to control NK cells was also measured relative to the percentage of tumor cells in the spleen (n = 27 to 33 mice per group). The curves in (E) to (F) were fitted using a nonlinear model.
Fig. 7.
Fig. 7.. NK cell dysfunction is reversible upon discontinuation of stimulation or upon cytokine treatment.
(A to C) NK cells were sorted from RMA-KR–bearing mice at late stages of tumor growth and then treated with cytokines before analysis. (A) Outline of the experiment. (B) FACS analysis of NK cell viability (n = 3 to 18 mice per group). (C) Reactivity of NK cells to NK1.1-mediated stimulation, as determined by coexpression of CD107a/IFN-γ. “Ex vivo” indicates NK cell reactivity before sorting and cytokine treatment (n = 3 to 18 mice per group). (D and E) Control and RMA-KR–bearing mice were injected twice with IL-15cplx as outlined in (D). (E) Reactivity of NK cells from the indicated groups to NK1.1-mediated stimulation (N = 5 per group). A Kruskal-Wallis analysis followed by Dunn’s multiple comparison test was used for statistical analysis. (F and G) Spleen cells from control or RMA- or RMA-KR–bearing mice at late stages of tumor growth were stimulated for 15 min (F) or different times (G) under the indicated conditions. (F) FACS analysis of different phosphoproteins (n = 6 to 33 mice per group). The left panels show the representative staining, and the heatmap (right) shows fold changes compared to nonstimulated NK cells (statistical analysis: two-way ANOVA followed by Tukey’s multiple comparison test, ****P < 0.0001). FMO, Fluorescence Minus One. (G) FACS analysis of CD122 surface expression (n = 3 to 8 mice per group). Statistical analysis: two-way ANOVA followed by Sidak’s multiple comparison test. (H to J) NK cells sorted from RMA-KR–bearing mice at late stages of tumor growth or control mice were transferred into Ly5a x C57BL/6J mice. They were analyzed before and after transfer. (H) Outline of the experiment. (I) FACS analysis of the percentage of ICP+ NK cells, expressed as a heatmap (n = 3 to 12 mice per group). **P < 0.01; ****P < 0.0001. (J) Coexpression of CD107a/IFN-γ in NK cells after 4-hour stimulation with NK1.1 antibody before and after transfer under the indicated conditions (n = 10 to 15 mice per group). Two-way ANOVA (I) or Kruskal-Wallis (J) analysis followed by Dunnett’s multiple comparison test were performed.

References

    1. Hammer Q., Rückert T., Romagnani C., Natural killer cell specificity for viral infections. Nat. Immunol. 19, 800–808 (2018). - PubMed
    1. Huntington N. D., Cursons J., Rautela J., The cancer-natural killer cell immunity cycle. Nat. Rev. Cancer 20, 437–454 (2020). - PubMed
    1. Costello R. T., Fauriat C., Sivori S., Marcenaro E., Olive D., NK cells: Innate immunity against hematological malignancies? Trends Immunol. 25, 328–333 (2004). - PubMed
    1. Viel S., Charrier E., Marçais A., Rouzaire P., Bienvenu J., Karlin L., Salles G., Walzer T., Monitoring NK cell activity in patients with hematological malignancies. Oncoimmunology 2, e26011 (2013). - PMC - PubMed
    1. Sivori S., Meazza R., Quintarelli C., Carlomagno S., Della Chiesa M., Falco M., Moretta L., Locatelli F., Pende D., NK cell-based immunotherapy for hematological malignancies. J. Clin. Med. 8, 1702 (2019). - PMC - PubMed

Publication types