. 2024 Aug 28;16(762):eadp1720.
doi: 10.1126/scitranslmed.adp1720. Epub 2024 Aug 28.

An autoimmune transcriptional circuit drives FOXP3+ regulatory T cell dysfunction

Affiliations

An autoimmune transcriptional circuit drives FOXP3+ regulatory T cell dysfunction

Tomokazu S Sumida et al. Sci Transl Med. .

Abstract

Autoimmune diseases, among the most common disorders of young adults, are mediated by genetic and environmental factors. Although CD4+FOXP3+ regulatory T cells (Tregs) play a central role in preventing autoimmunity, the molecular mechanism underlying their dysfunction is unknown. Here, we performed comprehensive transcriptomic and epigenomic profiling of Tregs in the autoimmune disease multiple sclerosis (MS) to identify critical transcriptional programs regulating human autoimmunity. We found that up-regulation of a primate-specific short isoform of PR domain zinc finger protein 1 (PRDM1-S) induces expression of serum and glucocorticoid-regulated kinase 1 (SGK1) independent from the evolutionarily conserved long PRDM1, which led to destabilization of forkhead box P3 (FOXP3) and Treg dysfunction. This aberrant PRDM1-S/SGK1 axis is shared among other autoimmune diseases. Furthermore, the chromatin landscape profiling in Tregs from individuals with MS revealed enriched activating protein-1 (AP-1)/interferon regulatory factor (IRF) transcription factor binding as candidate upstream regulators of PRDM1-S expression and Treg dysfunction. Our study uncovers a mechanistic model where the evolutionary emergence of PRDM1-S and epigenetic priming of AP-1/IRF may be key drivers of dysfunctional Tregs in autoimmune diseases.


Conflict of interest statement

D.A.H. has received research funding from Bristol-Myers Squibb, Novartis, Sanofi, and Genentech. He has been a consultant for Bayer Pharmaceuticals, Bristol Myers Squibb, Compass Therapeutics, EMD Serono, Genentech, Juno Therapeutics, Novartis Pharmaceuticals, Proclara Biosciences, Sage Therapeutics, and Sanofi Genzyme. B.E.B. declares outside interests in Fulcrum Therapeutics, Arsenal Biosciences, HiFiBio, Cell Signaling Technologies, and Chroma Medicine.

Figures

Fig. 1.
Fig. 1.. Deep transcriptomic analysis of mTregs and Tconvs highlights PRDM1 up-regulation in MS.
(A) Schematic of study design. mTconvs or mTregs were sorted by FACS from peripheral blood CD4+ T cells from individuals with MS and HCs. Bulk RNA-seq was performed on the discovery cohort, and DEGs were identified (HC, n = 20; MS, n = 26). The selected DEGs were validated by an independent validation cohort (HC, n = 23; MS, n = 16). (B) Volcano plots showing DEGs for mTregs and mTconvs between individuals with MS and HCs. (C) Overlapped DEGs between mTregs and mTconvs. (D) qPCR validation for PRDM1 expression in both discovery and validation cohorts. (E) Protein validation for BLIMP1 expression using flow cytometry (HC, n = 12; MS, n = 9). APC, allophycocyanin; gMFI, geometric mean fluorescence intensity. (F) Heatmap depicting expression patterns of the selected six genes in mTreg/Fr2 eTreg across 12 autoimmune diseases. Fr2 eTreg and Fr1 nTreg in the study by Ota et al. correspond to our mTregs and nTregs, respectively. Other autoimmune diseases included SLE, IIM, systemic sclerosis (SSc), mixed connective tissue disease (MCTD), Sjögren’s syndrome (SjS), rheumatoid arthritis (RA), Behçet’s disease (BD), adult-onset Still’s disease (AOSD), AAV, and Takayasu arteritis (TAK). Data were extracted from Ota et al. (30) and Gao et al. (31). *P < 0.05, **P < 0.01. Statistical significance was computed by unpaired t test in (D) and (E).
Fig. 2.
Fig. 2.. Single-cell dual-omics analysis reveals elevated PRDM1 in effector Tregs in MS.
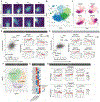
CD4+ T cells isolated from 10 individuals (five HCs and five with MS) were analyzed and shown. (A) Surface protein–guided CD4+ T cell subtype annotation. Four CD4+ T cell subtypes were distinguished by CD25, CD127, CD45RO, and CD45RA protein expression. (B) tSNE based on gene expression for CD4+ T cells. (C) FOXP3, IKZF2, PRDM1, and BACH2 expression is shown by tSNE visualization (all cells that passed quality control are plotted). (D) Combined differential analysis for bulk- and scRNA-seq in mTregs. Representative DEGs with pseudobulk analysis with scRNA-seq are shown. Gene expression changes in MS relative to control samples for the indicated genes were computed at the single-cell level (gray and red lines represent the average of HC or MS, respectively). The effect sizes of bulk (t-statistics) and scRNA-seq DEG analysis were compared, reporting Spearman’s rank correlation values between the two types. Correlation analyses were conducted separately in mTregs and mTconvs. The correlations across 8272 (mTreg) and 8262 (mTconv) genes that were marginally significant in the bulk-level analysis were assessed. The size of dots is scaled proportionally to the average number of mRNA reads quantified within each batch and condition; the y axis (disease effect) shows average gene expression after adjusted by confounding factors by matching; the error bars capture 1 SD for the disease effects in Bayesian inference. (E) Combined differential analysis for bulk- and scRNA-seq in mTconvs. Data are shown as in (D). (F) Subcell type annotation of mTregs based on CITE-seq. (G) Heatmaps showing the marker genes (italic font) and proteins (regular font) to define subcell types for mTregs. Standardized logarithm-transformed gene expression (log1p) values were calculated and summarized at each subcell type level. (H) The changes in PRDM1 and FOXP3 expression are shown at subcell type level for mTregs from individuals with MS and controls. Data are shown as in (D).
Fig. 3.
Fig. 3.. The alternative short PRDM1 isoform is elevated in MS mTregs.
(A) Schematic of PRDM1 short and long isoforms. PR; PR domain, Pro/Ser; proline/serine-rich region, ZnF; five C2H2 zinc fingers. (B) ATAC-seq [mTregs and nTregs from HC (n = 8)], DHS (ENCODE primary Tregs, Roadmap primary T cells, ENCODE monocytes, Roadmap primary B cells), and HiDRA peaks at PRDM1 locus. Accessible chromatin regions of human mTregs are highlighted in orange. (C) PRDM1-S and PRDM1-L isoform expression across nine different immune cell types in peripheral blood was assessed by bulk RNA-seq (n = 6 HCs). (D) Western blot analysis of BLIMP1 expression from eight different immune cell types in peripheral blood of HCs. Conventional BLIMP1 and alternative BLIMP1-S are distinguished by different sizes. (E) PRDM1-S and PRDM1-L gene expression was assessed by bulk RNA-seq in mTregs between MS and HC samples. **P < 0.01; statistical significance was computed by one-way analysis of variance (ANOVA) with Dunn’s multiple comparisons tests. (F) Heatmaps depicting Spearman’s correlation for curated immune-related genes with PRDM1-S or PRDM1-L in peripheral blood samples from HCs or individuals with MS. Different patterns of correlation for PRDM1-S and PRDM1-L with HC or MS samples are highlighted in three boxes (boxes 1 to 3).
Fig. 4.
Fig. 4.. PRDM1-S induces SGK1 expression and Treg dysfunction.
(A) Volcano plot showing statistical significance and FC for genes differentially expressed by PRDM1-S OE primary mTregs. (B) SGK1 expression was assessed by qPCR for OE of PRDM1-S and PRDM1-L with primary human mTregs (top) and Jurkat T cells (bottom). ***P < 0.001, ****P < 0.0001; Statistical significance was computed by one-way ANOVA with Dunn’s multiple comparisons tests. (C) The top track illustrates BLIMP1-S binding sites (positive signal, purple) over control IgG binding (negative signal, gray), as determined by the MACS2 bdgcomp function. Significant peaks in BLIMP1-S binding over IgG control were identified using SEACR (blue bars). BLIMP1 ChIP-seq data from H549 cells (light blue track) and ATAC-seq data from human primary Tregs (green track) were obtained from ENCODE and included in the figure. In addition, as a positive control, H3K4me3 CUT&RUN was performed concurrently with BLIMP1-S and IgG control CUT&RUN and is depicted at the bottom (magenta track). BLIMP1-S binding regions are highlighted in red boxes. (D) In vitro Treg suppression assay with human primary Tregs. T effector cell proliferation was assessed after 5 days of coculture with Tregs transduced with GFP control vector or PRDM1-S OE vector. **P < 0.01; statistical significance was computed by two-way repeated measures ANOVA. (E) Flow cytometry analysis for FOXP3 in primary Tregs overexpressing PRDM1-S compared with GFP control (n = 10). **P < 0.01; statistical significance was computed by paired t test.
Fig. 5.
Fig. 5.. AP-1 and IRF TF binding are enriched in MS mTregs.
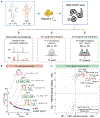
(A) Schematic of ATAC-seq experiments on mTregs from individuals with MS (n = 26) and HCs (n = 21). (B) TF motif enrichment analysis in mTregs between MS and HC by HINT. IRF and AP-1 motifs are highlighted in red and blue, respectively. (C) TF footprint enrichment analysis in mTreg isolated from individuals with MS and HCs by HINT and TOBIAS. TF footprints that are significantly enriched in mTregs from individuals with MS are highlighted in red.
Fig. 6.
Fig. 6.. Identification of active enhancer element for PRDM1-S with AP-1 and IRF binding.
(A) Schematic experimental overview. (B) CRISPRa validation for top 20 PRDM1-associated regulatory elements. Top: Top 20 accessible chromatin elements that are associated with PRDM1 expression are highlighted in orange. Potential interactions of regulatory elements with the PRDM1 gene are analyzed with the GeneHancer database and shown on the top. Middle and bottom: CRISPRa-induced expression of PRDM1-S (middle) and PRDM1-L (bottom) was assessed by qPCR. Detailed information for all 20 regions is shown in table S4. (C) Validation CRISPRa and CRISPRi experiments for the #2 peak using peak #2–targeted sgRNA-1 (n = 4). (D) Top: H3K27ac, H3K4me1, and H3K4me3 MINT-ChIP signal on the #2 peak region in mTregs from HC and MS samples. Four replicates of HC mTregs and two replicates of MS mTregs are merged into one representative track, respectively. Middle: Footprint analysis on #2 peak region with TOBIAS footprint score. Bottom: AP-1 and IRF ChIP-seq signals identified on #2 peak region in ENCODE data are shown. AP-1/IRF composite motif identified in #2 peak region is highlighted. *P < 0.05, **P < 0.01, and ****P < 0.0001; statistical significance was computed by one-way ANOVA with Dunn’s multiple comparisons tests.

References

    1. Maurano MT, Humbert R, Rynes E, Thurman RE, Haugen E, Wang H, Reynolds AP, Sandstrom R, Qu H, Brody J, Shafer A, Neri F, Lee K, Kutyavin T, Stehling-Sun S, Johnson AK, Canfield TK, Giste E, Diegel M, Bates D, Hansen RS, Neph S, Sabo PJ, Heimfeld S, Raubitschek A, Ziegler S, Cotsapas C, Sotoodehnia N, Glass I, Sunyaev SR, Kaul R, Stamatoyannopoulos JA, Systematic localization of common disease-associated variation in regulatory DNA. Science 337, 1190–1195 (2012). - PMC - PubMed
    1. Yoshida H, Lareau CA, Ramirez RN, Rose SA, Maier B, Wroblewska A, Desland F, Chudnovskiy A, Mortha A, Dominguez C, Tellier J, Kim E, Dwyer D, Shinton S, Nabekura T, Qi Y, Yu B, Robinette M, Kim KW, Wagers A, Rhoads A, Nutt SL, Brown BD, Mostafavi S, Buenrostro JD, Benoist C, Immunological Genome Project, The cis-regulatory atlas of the mouse immune system. Cell 176, 897–912.e820 (2019). - PMC - PubMed
    1. Farh KK, Marson A, Zhu J, Kleinewietfeld M, Housley WJ, Beik S, Shoresh N, Whitton H, Ryan RJ, Shishkin AA, Hatan M, Carrasco-Alfonso MJ, Mayer D, Luckey CJ, Patsopoulos NA, De Jager PL, Kuchroo VK, Epstein CB, Daly MJ, Hafler DA, Bernstein BE, Genetic and epigenetic fine mapping of causal autoimmune disease variants. Nature 518, 337–343 (2015). - PMC - PubMed
    1. Hellberg S, Eklund D, Gawel DR, Kopsen M, Zhang H, Nestor CE, Kockum I, Olsson T, Skogh T, Kastbom A, Sjowall C, Vrethem M, Hakansson I, Benson M, Jenmalm MC, Gustafsson M, Ernerudh J, Dynamic response genes in CD4+ T cells reveal a network of interactive proteins that classifies disease activity in multiple sclerosis. Cell Rep. 16, 2928–2939 (2016). - PubMed
    1. Brorson IS, Eriksson A, Leikfoss IS, Celius EG, Berg-Hansen P, Barcellos LF, Berge T, Harbo HF, Bos SD, No differential gene expression for CD4(+) T cells of MS patients and healthy controls. Mult. Scler. J. Exp. Transl. Clin 5, 2055217319856903 (2019). - PMC - PubMed

Publication types

MeSH terms

Substances