. 2024 Dec 14;120(16):2017-2030.
doi: 10.1093/cvr/cvae193.

Insulin receptors in vascular smooth muscle cells regulate plaque stability of atherosclerosis

Affiliations

Insulin receptors in vascular smooth muscle cells regulate plaque stability of atherosclerosis

Qian Li et al. Cardiovasc Res. .

Abstract

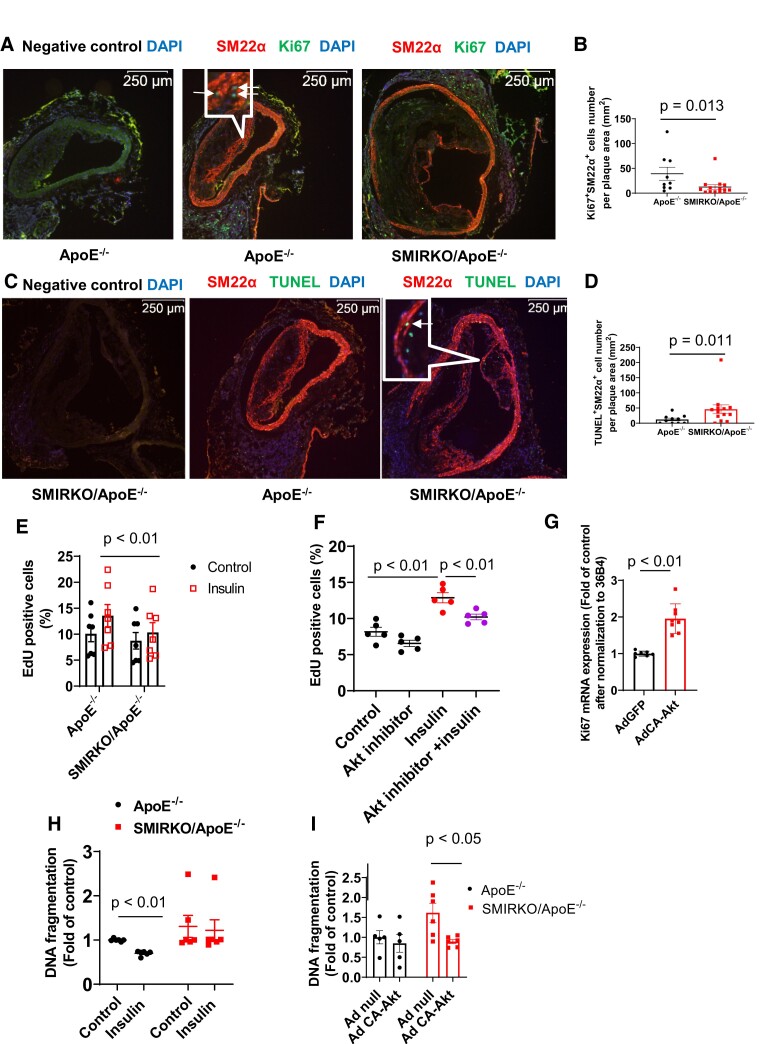
Aims: Increased prevalence of acute myocardial infarction related to diabetes and insulin resistance is associated with an elevated risk of unstable atherosclerotic plaques, which are characterized by reduced vascular smooth muscle cells (VSMCs) and extracellular matrix (ECM) and increased inflammation. Thus, insulin resistance may reduce plaque stability, as deleting insulin receptors (IRs) in VSMCs decreases their proliferation and enhances apoptosis.

Methods and results: Direct effects of insulin on VSMCs to alter plaque composition were studied using mice with double knockout of ApoE and IR genes in VSMCs with SMIRKO/ApoE-/-, Myh11-CreERT2EYFP+/ApoE-/-, and Myh11-CreERT2EYFP+IRKO/ApoE-/- mice, which were also used for lineage tracing studies. Compared with ApoE-/- mice, SMIRKO/ApoE-/- mice exhibited more atherosclerotic plaques, which contained less VSMCs and collagen but increased levels of VSMC apoptosis and necrotic areas. Lineage tracing studies showed that Icam1+ Vcam1+ VSMC was inflammatory, which increased in the aortas of Myh11-CreERT2EYFP+IRKO/ApoE-/- mice compared with control mice. Isolated VSMCs lacking IRs expressed higher inflammatory cytokines than cells with IRs. Cell-based studies indicated that insulin's anti-apoptotic and pro-proliferative effects in VSMCs were mediated via activation of the IR/Akt pathway, which were decreased in VSMCs from SMIRKO or high-fat diet mice. An analysis of the IR targets that regulated inflammatory cytokines in VSMCs showed that thrombospondin 1 (Thbs1) and Mmp2 were consistently increased with a loss of IRs. Insulin inhibited Thbs1 expression, but not Mmp2 expression, through p-Akt/p-FoxO1 pathways in VSMCs from ApoE-/- mice, and was impaired in cells from SMIRKO/ApoE-/- mice. Thbs1 further induced Icam1 and Mmp2 expressions in VSMCs.

Conclusion: Insulin via IRs has significant actions in VSMCs to decrease inflammation, apoptosis, and ECM turnover via the activation of Akt and FoxO1 pathways. The inhibition of insulin actions and related pathways related to insulin resistance and diabetes may contribute to the formation of unstable atherosclerotic plaques.

Keywords: Atherosclerosis; Insulin receptor; Smooth muscle cells; Thrombospondin 1.


Conflict of interest statement

Conflict of interest: none declared.

Figures

Graphical Abstract
Graphical Abstract
Figure 1
Figure 1
Insulin resistance in the aortas of HFD mice and SMIRKO/ApoE−/− mice. (AC) Insulin signalling in the aortas of ApoE−/− mice on NC or HFD. Male ApoE−/− mice on NC or HFD for 5 months were administrated insulin through retro-orbital injection (10 IU/kg body weight) and the aortas were isolated 10 min after injection. (A) IRβ and p-Akt (Ser 473) were determined by western blotting. Data represent mean ± standard error of the mean (SEM). (B) NC n = 10; HFD n = 11. A comparison was made using an unpaired Student’s t-test. (C) NC vehicle n = 5; HFD vehicle n = 6; NC insulin n = 5; HFD insulin n = 5. A comparison was made using two-way ANOVA. (D and E) Insulin signalling in the aortas of ApoE−/− and SMIRKO/ApoE−/− mice. Mice were administrated insulin through retro-orbital injection (10 IU/kg body weight) and the aortas were isolated 10 min after injection. p-Akt was determined by western blotting. Data represent mean ± SEM. n = 5 per group. Comparison was made using two-way ANOVA.
Figure 2
Figure 2
The characterization of an atherosclerotic lesion in the aortas of male mice on NC for 11 months. (A) Atherosclerosis in the aortas was determined by en face Sudan IV staining. The left panel shows representative images and the right panel presents quantitative data. Data represent mean ± SEM. N = 13 per group. A comparison was made using an unpaired Student’s t-test. (B) An immunofluorescence staining of SM22α and Mac2. Data represent mean ± SEM. ApoE−/−  n = 11 mice; SMIRKO/ApoE−/−  n = 15 mice. A comparison was made using an unpaired Student’s t-test. (C) H&E staining. Data represent mean ± SEM. N = 6 mice per group. A comparison was made using an unpaired Student’s t-test. (D and E) Sirius red staining. D shows representative images and E presents quantitative data. Data represent mean ± SEM. N = 8 mice per group. A comparison was made using an unpaired Student’s t-test. (F) Analyses of leucocytes in aorta by flow cytometry. Aortas were digested into single cells, and the number of leucocytes in the aorta was determined by flow cytometry. Data represent mean ± SEM. N = 9 mice per group. A comparison was made using an unpaired Student’s t-test. * P < 0.05.
Figure 3
Figure 3
VSMC proliferation and apoptosis in the atherosclerotic plaques of male mice on NC for 11 months and in cultured VSMCs. (A and B) An immunofluorescence staining of SM22α and Ki67 in the atherosclerotic plaque. Data represent mean ± SEM. ApoE−/−  n = 9 mice; SMIRKO/ApoE−/−  n = 13 mice. A comparison was made using a non-parametric Mann–Whitney U test. (C and D) TUNEL and SM22α co-staining. Data represent mean ± SEM. ApoE−/−  n = 10 mice; SMIRKO/ApoE−/−  n = 13 mice. A comparison was made using a non-parametric Mann–Whitney U test. (E) VSMC proliferation. Starved VSMCs were treated with a vehicle or 5 nM insulin for 48 h, and EdU incorporation was measured by flow cytometry. Data represent mean ± SEM, n = 7 per group. A comparison was made using two-way ANOVA. (F) Starved VSMCs cultured from the aortas of ApoE−/− mice were treated with a vehicle or 1 μM Akt inhibitor GDC-0068 for 48 h and EdU incorporation was measured by flow cytometry. Data represent mean ± SEM, n = 5 per group. A comparison was made using two-way ANOVA. (G) Starved VSMCs were infected with adenovirus carrying a constitutively activated Akt gene. The expression of Ki67 was determined by qPCR. Data represent mean ± SEM, ApoE−/−  n = 7; SMIRKO/ApoE−/−  n = 8. A comparison was made using an unpaired Student’s t-test. (H) VSMC apoptosis. Starved VSMCs were treated with or without insulin. Then, DNA fragmentation of VSMCs was measured by Cell Death ELISA. Data represent mean ± SEM. n = 6 per group. A comparison was made using a non-parametric Mann–Whitney U test. (I) A VSMC was infected with adenovirus carrying a constitutively activated Akt gene. The VSMC was starved for 24 h and apoptosis was assessed by DNA fragmentation, which was quantified by Cell Death ELISA. Data represent mean ± SEM. ApoE−/− Ad null n = 5; ApoE−/− Ad CA-Akt n = 5; SMIRKO/ApoE−/− Ad null n = 6; SMIRKO/ApoE−/− Ad CA-Akt n = 6. A comparison was made using two-way ANOVA.
Figure 4
Figure 4
The characterization of Icam1+Vcam1+ VSMCs and atherosclerotic lesion in the aortas of Myh11EYFP+IRKO/ApoE−/− mice. (A) Gene expression profiles in Icam1Vcam1 and Icam1+Vcam1+ VSMCs. The aortas of male VSMC lineage tracing Myh11EYFP+/ApoE−/− mice on HFD for 5 months were digested into single cells. DAPIEYFP+Icam1Vcam1 VSMCs and DAPIEYFP+Icam1+Vcam1+VSMCs were sorted by flow cytometry. Gene expression levels in these cells were determined by qPCR. Data represent mean ± SEM. N = 6 per group. *P < 0.05, **P < 0.01 vs. Aortic EYFP+ Icam1Vcam1 VSMCs. Comparisons of Acta2, Myh11, Icam1, IL6, and Cxcl12 were made by using a non-parametric Mann–Whitney U test. Comparisons of IR, Vcam1, Ccl2, Cxcl1, Thbs1, and C3 were made using an unpaired Student’s t-test. (B) PITer119CD45CD31Icam1+ cells in aorta media. The media layer of the thoracic aorta was isolated after Collagenase II digestion. Then, the aorta media was digested into single cells, and the ratio of PITer119CD45CD31Icam1+ cells in PITer119CD45CD31 cells, which were mainly VSMCs, was determined by flow cytometry. Data represent mean ± SEM. n = 5 for each group. A comparison was made using an unpaired Student’s t-test. (C and D) Atherosclerosis in the aortas of Myh11EYFP+IRKO/ApoE−/− mice. Male Myh11EYFP+IRKO/ApoE−/− mice and control mice were fed with HFD for 5 months. Atherosclerosis in aortas was determined by en face Sudan IV staining. The left panel shows representative images and the right panel presents quantitative data. Data represent mean ± SEM. n = 13 per group. A comparison was made using an unpaired Student’s t-test. (E) The percentage of DAPIEYFP+Icam1+Vcam1+VSMCs in a DAPIEYFP+ VSMC in the aortas of VSMC lineage tracing mice. The aortas of male VSMC lineage tracing Myh11EYFP+/ApoE−/− and Myh11EYFP+IRKO/ApoE−/− mice on HFD for 5 months were digested into single cells. The percentage of DAPIEYFP+Icam1+Vcam1+VSMCs in a DAPIEYFP+ VSMC in the aortas was determined by flow cytometry. Data represent mean ± SEM. n = 17 per group. A comparison was made using an unpaired Student’s t-test. (F) The expression levels of inflammatory genes in a VSMC. The aortas of male VSMC lineage tracing Myh11EYFP+/ApoE−/− and Myh11EYFP+IRKO/ApoE−/− mice on HFD for 5 months were digested into single cells. The DAPIEYFP+ VSMC was sorted by flow cytometry, and the expression levels of inflammatory genes in the sorted VSMC were determined by qPCR. Data represent mean ± SEM. Myh11EYFP+/ApoE−/−, n = 11; Myh11EYFP+IRKO/ApoE−/−, n = 12. Comparisons of IR, ccl2, and Cxcl1 were made using an unpaired Student’s t-test. A comparison of Thbs1 was made using a non-parametric Mann–Whitney U test.
Figure 5
Figure 5
Differentially expressed genes in aorta media. (A) Gene expression in the media layer of thoracic aortas of male SMIRKO/ApoE−/− mice and control mice on NC for 11 months. Data represent mean ± SEM. ApoE−/− IR, Mmp2, and Sfrp3, n = 6 per group; ApoE−/− Comp, Igfbp4, and Thbs1, n = 9 per group; SMIRKO/ApoE−/− IR, Mmp2, and Sfrp3, n = 7 per group; SMIRKO/ApoE−/− Comp, Igfbp4 and Thbs1, n = 8 per group. *P < 0.05, **P < 0.01 vs. ApoE−/−. A comparison was made using an unpaired Student’s t-test. ## P < 0.01. A comparison was made using a non-parametric Mann–Whitney U test. (B) Gene expression in the media layer of the thoracic aortas of male C57/6J mice on NC, HFD for 5 months, or streptozotocin injection–induced diabetic C57/6J mice for 5 months. Data represent mean ± SEM. control n = 5; HFD n = 5; STZ n = 5; *P < 0.05, **P < 0.01 vs. control. A comparison was made using an unpaired Student’s t-test. (C) Western blotting of Thbs1 and Mmp2 in the aorta media of male mice on NC for 11 months. Data represent mean ± SEM. ApoE−/−  n = 7; SMIRKO/ApoE−/−  n = 6, **P < 0.01 vs. ApoE−/−. A comparison was made using an unpaired Student’s t-test.
Figure 6
Figure 6
The effects of insulin and Thbs1 on cultured VSMCs. (A) The cultured VSMCs were stimulated with 100 nM insulin for 24 h. Gene expression was determined by qPCR. Data represent mean ± SEM. n = 6 per group, **P < 0.01 vs. control. A comparison was made using an unpaired Student’s t-test. (B) Insulin inhibited Thbs1 protein expression. VSMCs were treated with insulin for 2 days and Thbs1 in the cell culture medium was determined by western blotting. Data represent mean ± SEM. ApoE−/−, n = 9 per group; SMIRKO/ApoE−/−, n = 6 per group. A comparison was made using an unpaired Student’s t-test. (C) VSMCs were stimulated with the Thbs1 protein (1 µg/mL) for 4 h and gene expression levels were determined by qPCR. Data represent mean ± SEM. n = 6–8 for each group, ## P < 0.01. A comparison was made using a non-parametric Mann–Whitney U test. *P < 0.05, **P < 0.01, vs. ApoE−/− control. A comparison was made using an unpaired Student’s t-test. (D) Thbs1 expression in a VSMC was knocked down by adenovirus-mediated shRNA transfection. The VSMC was harvested 2 days after adenovirus transfection and gene expression levels were determined by qPCR. Data represent mean ± SEM. N = 5 per group, **P < 0.01 vs. ApoE−/− AdScramble shRNA. A comparison was made using an unpaired Student’s t-test.
Figure 7
Figure 7
Mechanisms of insulin inhibiting Thbs1 expression. (A) Insulin signalling in VSMCs. The VSMCs were stimulated with 5 nM insulin in a time-dependent manner. The protein expression levels were determined by western blotting. Data represent mean ± SEM. n = 6 for each group. A comparison was made using two-way ANOVA. (B) Akt-regulated Thbs1 gene expression in VSMCs. Akt was knocked down by Akt shRNA lentivirus, and Thbs1 gene expression was determined by qPCR. Data represent mean ± SEM. n = 5–6 per group. A comparison was made using two-way ANOVA. (CF) Akt and FoxO1 regulated Thbs1 expression in VSMCs. (C) The VSMCs were overexpressed with constitutively activated Akt by adenovirus-mediated transfection. Thbs1 gene expression was determined by qPCR. Data represent mean ± SEM. n = 5 per group. A comparison was made using an unpaired Student’s t-test. (D) VSMCs were overexpressed with FoxO1 by adenovirus-mediated transfection. Thbs1 gene expression was determined by qPCR. Data represent mean ± SEM. n = 11 per group. A comparison was made using an unpaired Student’s t-test. (E and F) VSMCs were overexpressed with constitutively activated Akt or FoxO1 by adenovirus-mediated transfection. Thbs1 protein expression was determined by western blotting. E shows the representative image and F presents the summary data. Data represent mean ± SEM. n = 5 for each group. A comparison was made using an unpaired Student’s t-test. (G) Insulin and FoxO1 inhibitor reduced Thbs1 gene expression. VSMCs were treated with 100 nM insulin for 48 h or FoxO1 inhibitor AS1842856 at 300 nM every 12 h for 24 h and then AS1842856 for 4 h. The gene expression of Thbs1 was determined by qPCR. Data represent mean ± SEM. n = 5 per group. A comparison was made using one-way ANOVA.

References

    1. Rawshani A, Rawshani A, Franzen S, Eliasson B, Svensson AM, Miftaraj M, McGuire DK, Sattar N, Rosengren A, Gudbjornsdottir S. Mortality and cardiovascular disease in type 1 and type 2 diabetes. N Engl J Med 2017;376:1407–1418. - PubMed
    1. Burke AP, Kolodgie FD, Zieske A, Fowler DR, Weber DK, Varghese PJ, Farb A, Virmani R. Morphologic findings of coronary atherosclerotic plaques in diabetics: a postmortem study. Arterioscler Thromb Vasc Biol 2004;24:1266–1271. - PubMed
    1. Virmani R, Burke AP, Kolodgie FD, Farb A. Vulnerable plaque: the pathology of unstable coronary lesions. J Interv Cardiol 2002;15:439–446. - PubMed
    1. Howard G, O'Leary DH, Zaccaro D, Haffner S, Rewers M, Hamman R, Selby JV, Saad MF, Savage P, Bergman R. Insulin sensitivity and atherosclerosis. The Insulin Resistance Atherosclerosis Study (IRAS) Investigators. Circulation 1996;93:1809–1817. - PubMed
    1. Bonora E, Kiechl S, Willeit J, Oberhollenzer F, Egger G, Meigs JB, Bonadonna RC, Muggeo M. Insulin resistance as estimated by homeostasis model assessment predicts incident symptomatic cardiovascular disease in Caucasian subjects from the general population: the Bruneck study. Diabetes Care 2007;30:318–324. - PubMed

Publication types

MeSH terms