. 2024 Oct 2;44(40):e0122242024.
doi: 10.1523/JNEUROSCI.0122-24.2024.

Low-Frequency Oscillations in Mid-rostral Dorsolateral Prefrontal Cortex Support Response Inhibition

Affiliations

Low-Frequency Oscillations in Mid-rostral Dorsolateral Prefrontal Cortex Support Response Inhibition

Anas U Khan et al. J Neurosci. .

Abstract

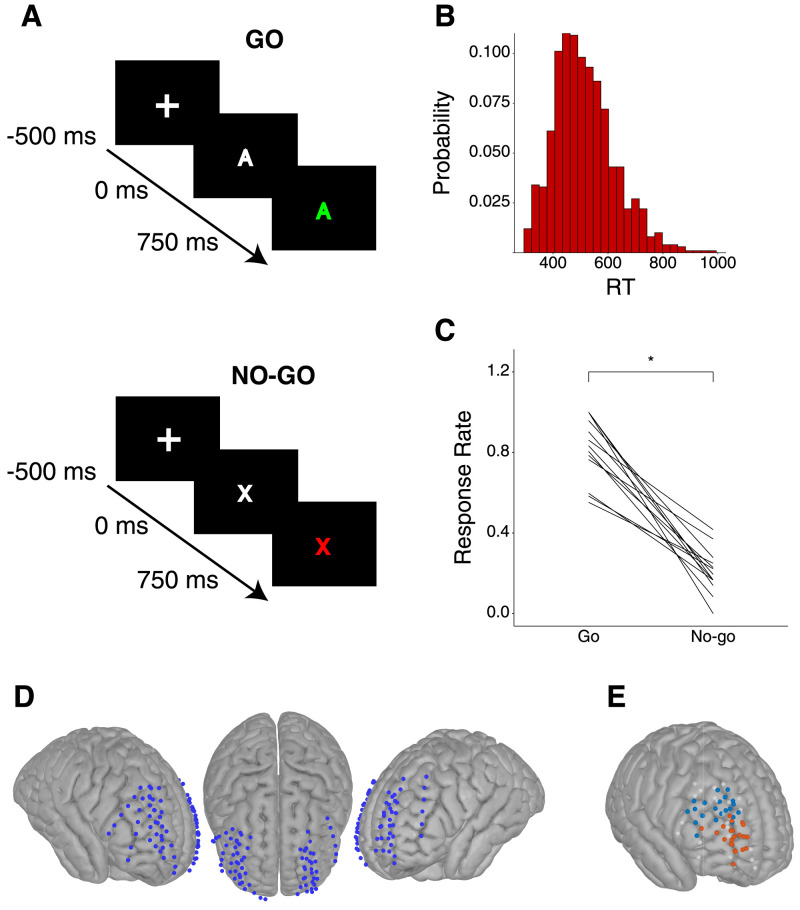
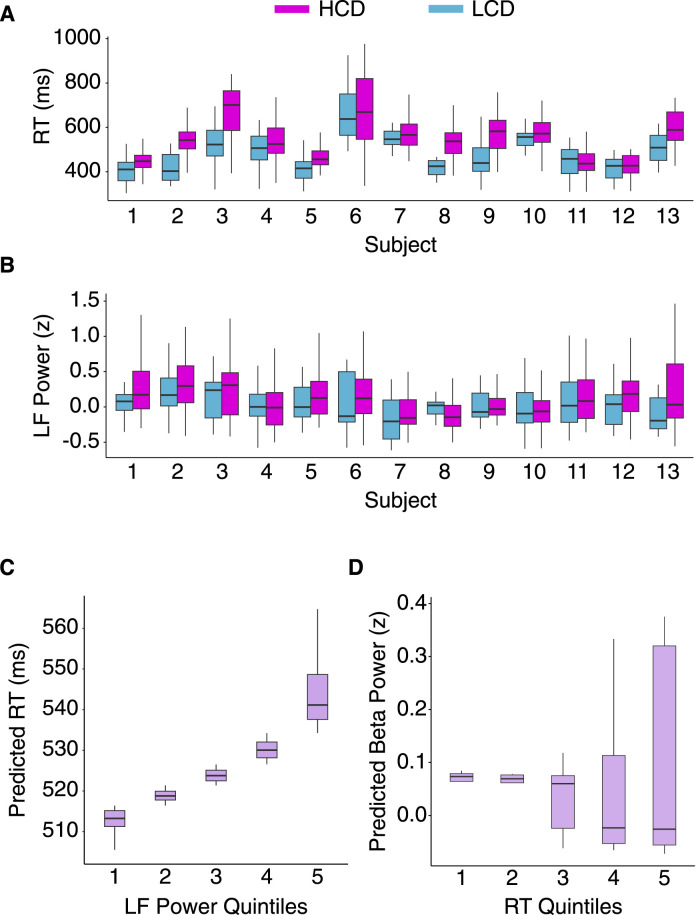
Executive control of movement enables inhibiting impulsive responses critical for successful navigation of the environment. Circuits mediating stop commands involve prefrontal and basal ganglia structures with fMRI evidence demonstrating increased activity during response inhibition in the dorsolateral prefrontal cortex (dlPFC)-often ascribed to maintaining task attentional demands. Using direct intraoperative cortical recordings in male and female human subjects, we investigated oscillatory dynamics along the rostral-caudal axis of dlPFC during a modified Go/No-go task, probing components of both proactive and reactive motor control. We assessed whether cognitive control is topographically organized along this axis and observed that low-frequency power increased prominently in mid-rostral dlPFC when inhibiting and delaying responses. These findings provide evidence for a key role for mid-rostral dlPFC low-frequency oscillations in sculpting motor control.

Keywords: cognitive control; dorsolateral prefrontal cortex; electrocorticography; local field potentials; response inhibition.


Conflict of interest statement

The authors declare no competing financial interests.

Figures

Figure 1.
Figure 1.
Go/No-go task structure and behavioral metrics. A, Top panel, Successful Go trial during which subjects are shown non-“X” letters and respond within 1,000 ms with a button press. Correct responses are indicated by green color change during the feedback period. Bottom panel, The No-go condition is illustrated in which subjects are shown the letter “X” and with prior instruction to withhold their response. An example of an incorrect response with the color of the letter changing to red is shown. Trial times ranged from 750 to 1,000 ms, titrated to 80% accuracy during a practice block. The intertrial interval ranged from 500 to 1,000 ms, with a subsequent feedback period of 250 ms. B, Histogram illustrating distribution of Go reaction times across subjects, with mean time of 543.9 ± 21.8 ms. C, Response rate rates for Go and No-go conditions across subjects showing significantly more responses during Go trials, indicating successful task understanding and completion (Pearson's chi-squared test, all 13 subjects responded more in Go than No-go, p = 0.035). D, Three different views of ECoG electrode coverage: right hemisphere (left), center view (middle), and left hemisphere (right). E, Locations of bipolar virtual electrodes in dlPFC reflected to right hemisphere for visual clarity, with mid-rostral electrodes labeled red-orange and caudal electrodes labeled as blue. White, translucent electrodes are those excluded either due to excess noise/artifacts or not being within the dlPFC as determined by the Desikan–Killiany atlas. The MNI y-coordinate used to classify mid-rostral versus caudal electrodes across subjects was 47.17 ± 1.89.
Figure 2.
Figure 2.
Response Inhibition increases low-frequency power in mid-rostral but not caudal dlPFC. A, Mean cue-aligned, z-scored power spectra in Go and No-go conditions with No-go–Go difference spectrogram. Dashed lines indicate the mean EMG signal across subjects for each condition, indicating successful withheld responses during No-go trials. Statistical significance indicated by black contour lines in the difference spectrogram; low-frequency (p = 0.001, permutation test, cluster corrected) and beta band power (p = 0.016, permutation test, cluster corrected) showed significance condition-specific differences. B, Left, Same as in A but narrowband low-frequency (2–6 Hz) power in caudal dlPFC electrodes showing no significant difference between conditions (p > 0.05, permutation test, cluster corrected). B, Right, The same as in B, left, but mid-rostral dlPFC electrodes showing a significant difference in low-frequency power between Go and No-go conditions (p = 0, permutation test, cluster corrected) indicated by the horizontal solid black bar and star. Vertical black dashed lines indicate the mean Go reaction time over all subjects included (528.7 ms for mid-rostral group and 540.1 ms for caudal group). C, Box plots (box length, IQR; whiskers, 1.5 × IQR; and transecting lines, medians) of distance quintiles versus low-frequency power predicted values from the LMM with regression lines for the Go and No-go conditions (n = 57 electrodes, 701 Go trials, and 351 No-go trials). D, Mean low-frequency power averaged over 200–700 ms mapped onto each electrode projected onto left hemisphere for visual clarity with cortical vertices taking on color values corresponding to weighted average of neighboring electrodes for Go trials (left), NoGo trials (middle), and difference between NoGo and Go (right).
Figure 3.
Figure 3.
Late-trial (postresponse) beta does not strictly track motor activity. A, 12–30 Hz power averaged across subjects (n = 12) for error (red) versus correct (blue) NoGo trials showing no significant difference (permutation test, cluster corrected, p > 0.05). B, Same as in A but for the Go condition (n = 10) with no significant difference (Permutation test, cluster corrected, p > 0.05). C, Comparing across conditions where a response was made showing significant beta suppression in error NoGo trials (red) compared with correct Go trials (blue; permutation test, cluster corrected, p = 0.007). D, Same is in C but for trials without a response showing no significant difference (permutation test, cluster corrected, p > 0.05).
Figure 4.
Figure 4.
dlPFC low-frequency power is a substrate for proactive control. A, Box plots (box length, IQR; whiskers, IQR × 1.5; and transecting lines, medians) of response time versus block type across all 13 subjects (LMM; F(1,985) = 88.24; p = 2.2 × 10−16; n = 701 cognitive Go trials and 298 motor Go trials). B, Same as in A but low-frequency (2–6 Hz) power versus block type. C, Box plots (box length, IQR; whiskers, IQR × 1.5; and transecting lines, medians) of predicted reaction times from the LMM versus low-frequency power quintiles (LMM; F(1,987) = 5.105; p = 0.02; n = 999 Go trials). D, Box plots (box length, IQR; whiskers, IQR × 1.5; and transecting lines, medians) of predicted beta power from the LMM versus reaction time quintiles (LMM; F(1,899) = 0.1362; p > 0.05; n = 999 Go trials).
Figure 5.
Figure 5.
dlPFC low-frequency and beta oscillations do not interact during cognitive control. A, MVPA within low-frequency power (train and test) showing significantly above chance condition discrimination between 500 and 625 ms (AUCmean = 0.584; p = 0.036; permutation test, cluster corrected). B, Same as in A, but for beta power, showing significantly above chance condition discrimination between 625 and 700 ms (AUCmean = 0.541; p = 0.040; permutation test, cluster corrected). C, MVPA trained on low-frequency power and tested on beta power showing no significant condition discrimination at any time point (permutation test, cluster corrected, p > 0.05).

References

    1. Aron AR (2011) From reactive to proactive and selective control: developing a richer model for stopping inappropriate responses. Biol Psychiatry 69:e55–e68. 10.1016/j.biopsych.2010.07.024 - DOI - PMC - PubMed
    1. Ashburner J, Friston KJ (2005) Unified segmentation. Neuroimage 26:839–851. 10.1016/j.neuroimage.2005.02.018 - DOI - PubMed
    1. Azuar C, Reyes P, Slachevsky A, Volle E, Kinkingnehun S, Kouneiher F, Bravo E, Dubois B, Koechlin E, Levy R (2014) Testing the model of caudo-rostral organization of cognitive control in the human with frontal lesions. Neuroimage 84:1053–1060. 10.1016/j.neuroimage.2013.09.031 - DOI - PubMed
    1. Badre D (2008) Cognitive control, hierarchy, and the rostro-caudal organization of the frontal lobes. Trends Cogn Sci 12:193–200. 10.1016/j.tics.2008.02.004 - DOI - PubMed
    1. Badre D, D’Esposito M (2007) Functional magnetic resonance imaging evidence for a hierarchical organization of the prefrontal cortex. J Cogn Neurosci 19:2082–2099. 10.1162/jocn.2007.19.12.2082 - DOI - PubMed

LinkOut - more resources