. 2024 Aug 28;15(1):7359.
doi: 10.1038/s41467-024-50498-4.

Inhibition of TOPORS ubiquitin ligase augments the efficacy of DNA hypomethylating agents through DNMT1 stabilization

Affiliations

Inhibition of TOPORS ubiquitin ligase augments the efficacy of DNA hypomethylating agents through DNMT1 stabilization

Satoshi Kaito et al. Nat Commun. .

Abstract

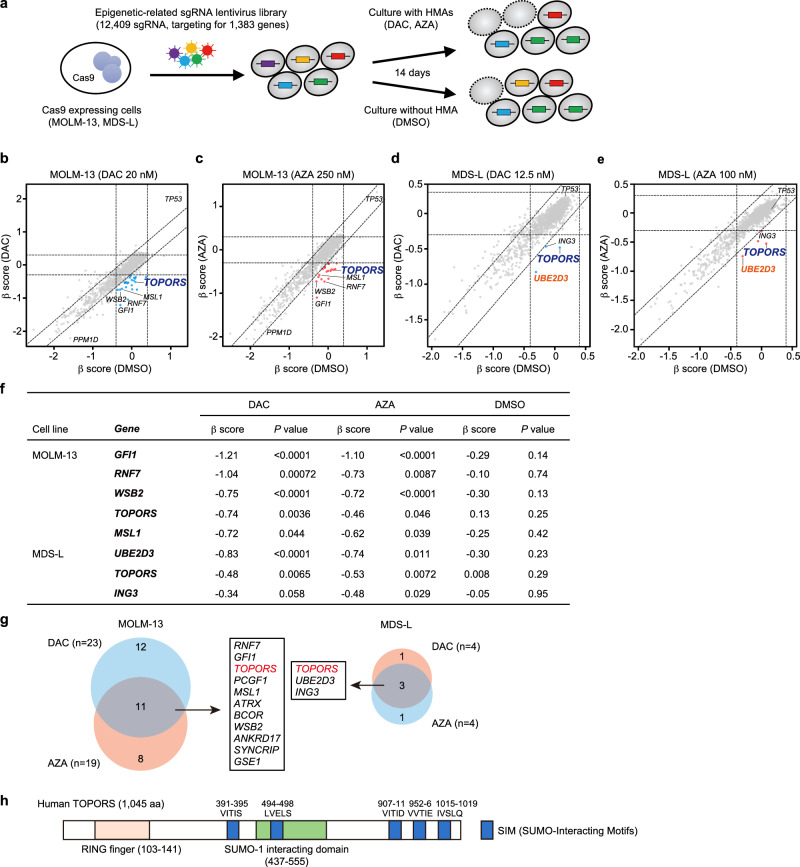
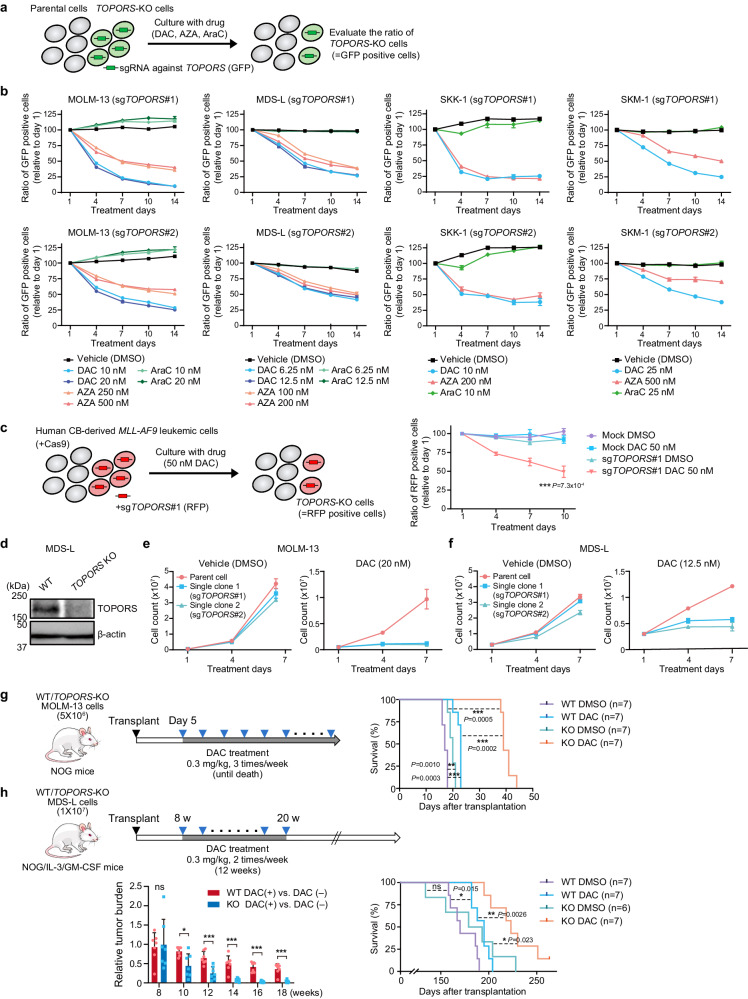
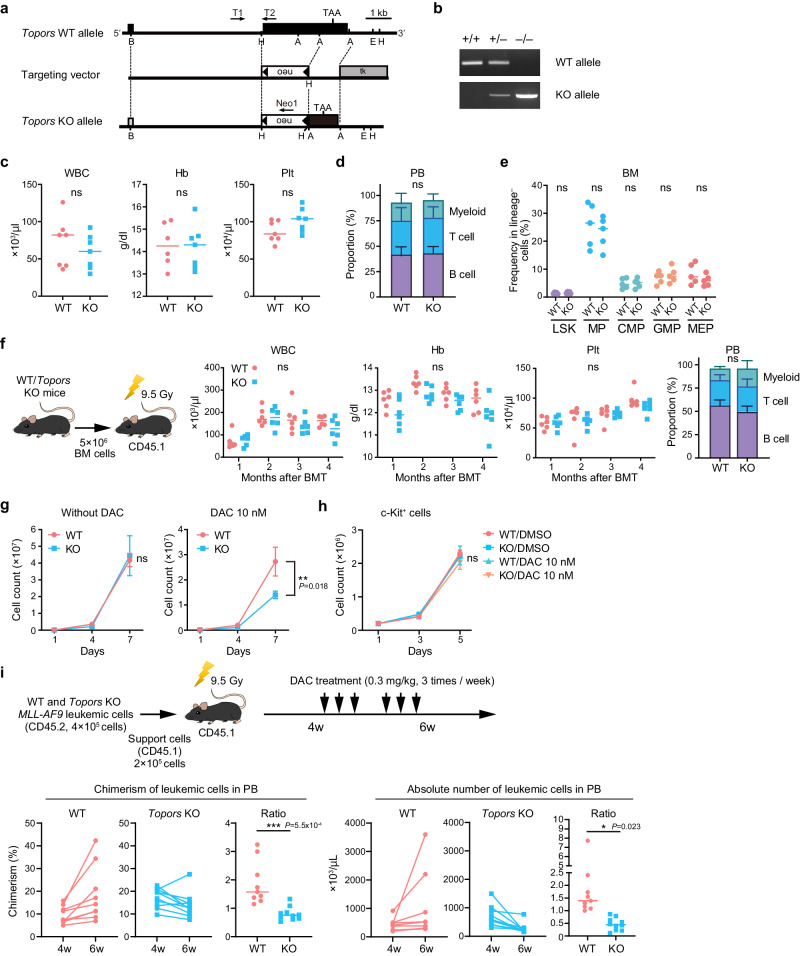
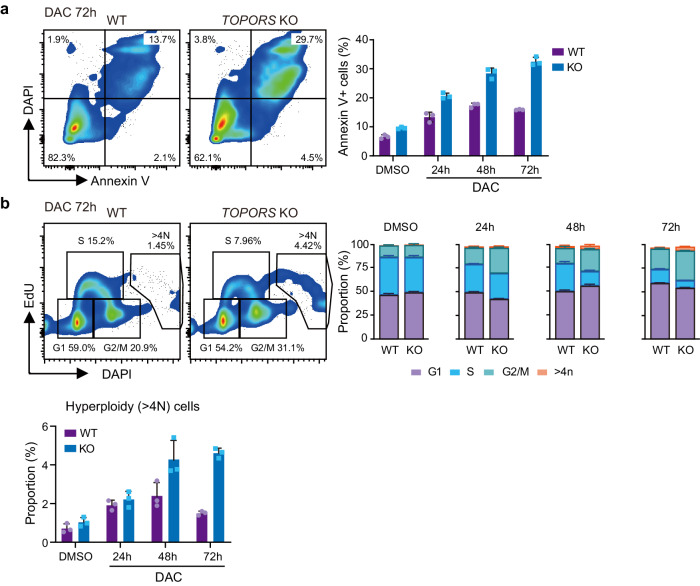
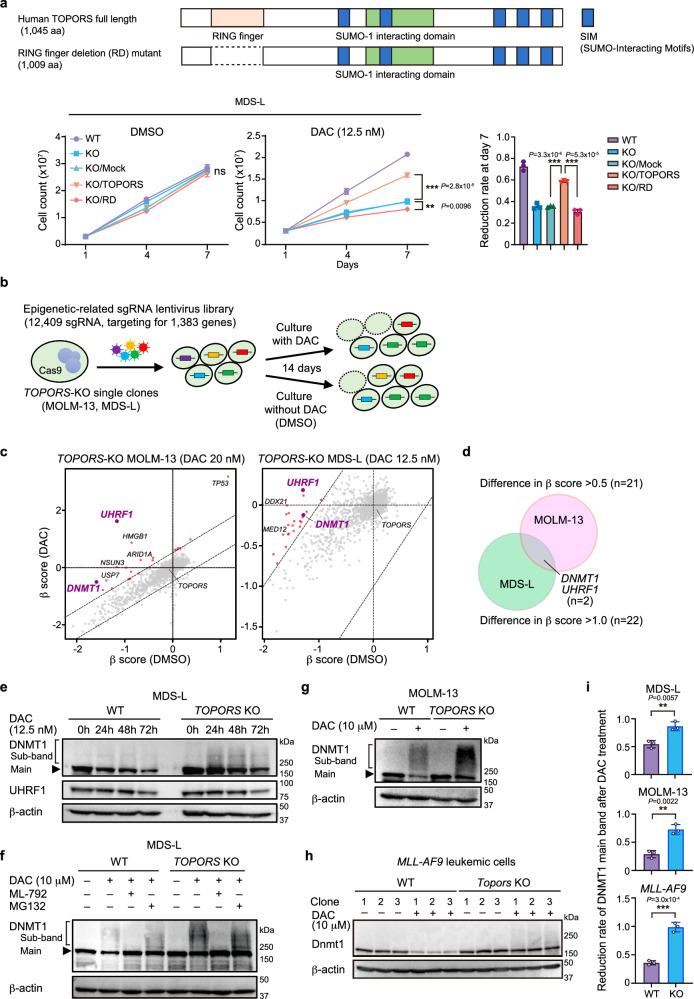
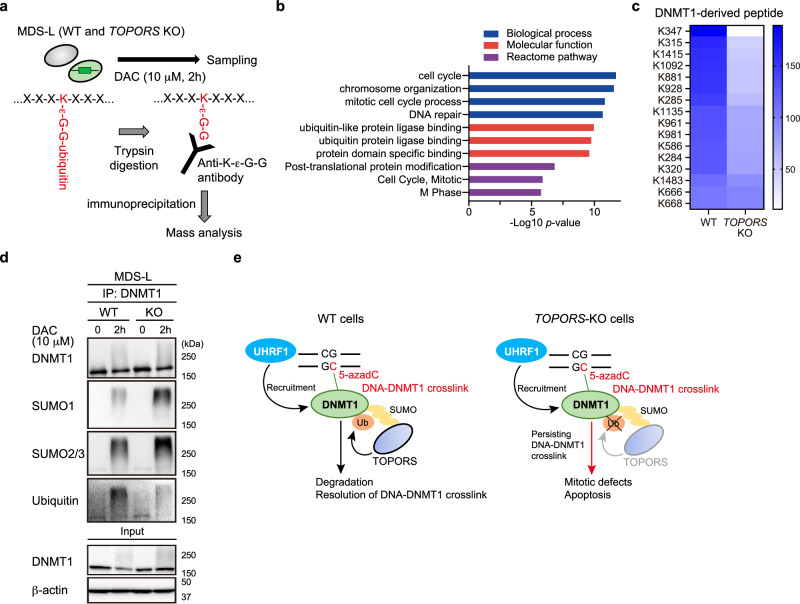
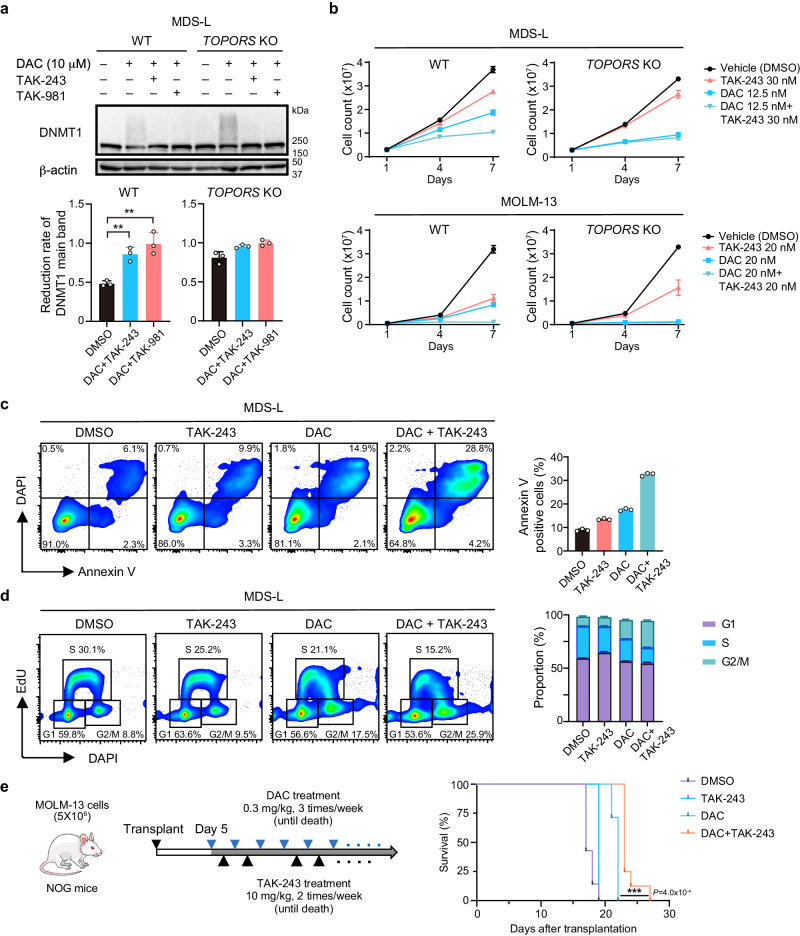
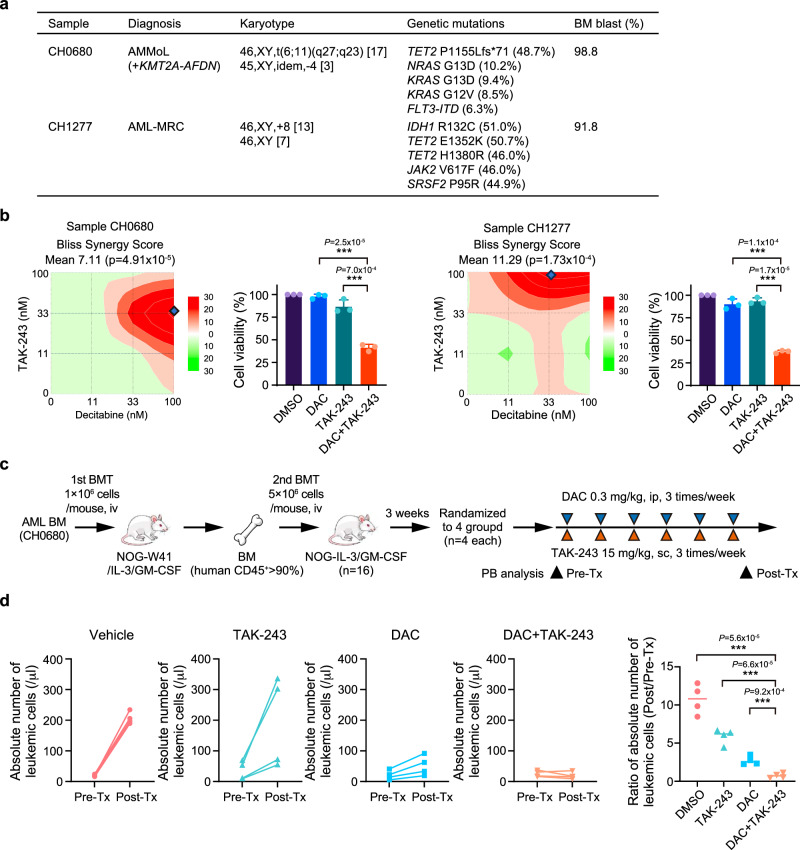
DNA hypomethylating agents (HMAs) are used for the treatment of myeloid malignancies, although their therapeutic effects have been unsatisfactory. Here we show that CRISPR-Cas9 screening reveals that knockout of topoisomerase 1-binding arginine/serine-rich protein (TOPORS), which encodes a ubiquitin/SUMO E3 ligase, augments the efficacy of HMAs on myeloid leukemic cells with little effect on normal hematopoiesis, suggesting that TOPORS is involved in resistance to HMAs. HMAs are incorporated into the DNA and trap DNA methyltransferase-1 (DNMT1) to form DNA-DNMT1 crosslinks, which undergo SUMOylation, followed by proteasomal degradation. Persistent crosslinking is cytotoxic. The TOPORS RING finger domain, which mediates ubiquitination, is responsible for HMA resistance. In TOPORS knockout cells, DNMT1 is stabilized by HMA treatment due to inefficient ubiquitination, resulting in the accumulation of unresolved SUMOylated DNMT1. This indicates that TOPORS ubiquitinates SUMOylated DNMT1, thereby promoting the resolution of DNA-DNMT1 crosslinks. Consistently, the ubiquitination inhibitor, TAK-243, and the SUMOylation inhibitor, TAK-981, show synergistic effects with HMAs through DNMT1 stabilization. Our study provides a novel HMA-based therapeutic strategy that interferes with the resolution of DNA-DNMT1 crosslinks.


Conflict of interest statement

K.H. is a co-founder of Dania Therapeutics, a consultant for Inthera Bioscience AG, and a scientific advisor for MetaboMed Inc. and Hannibal Innovation. All other authors declare no competing interests.

Figures

Fig. 1
Fig. 1. CRISPR-Cas9 screening reveals that TOPORS KO augments sensitivity to HMAs.
a Outline of CRISPR-Cas9 screening with and without HMAs. Screening results using MOLM-13 cells treated with DAC at 20 nM, (b) and AZA at 250 nM, (c) and MDS-L cells treated with DAC at 12.5 nM, (d) and AZA at 100 nM (e). Scatter plots showing the β scores of each gene, which indicate changes in the sgRNA content for each gene, in the presence and absence of HMAs. Candidate genes whose sgRNAs decreased during culture specifically in the presence of HMAs are indicated by blue dots (DAC) and red dots (AZA). f List of candidate genes identified to be in common in the presence of DAC and AZA. The p-value was calculated using a two-sided test. g Venn diagrams comparing screening results and the list of candidate genes identified to be in common in the presence of DAC and AZA. (h) Schematic representation of the TOPORS protein with the RING finger domain, the SUMO-1 interacting domain, and putative SUMO-interaction motifs (SIMs). Source data are provided as a Source Data file.
Fig. 2
Fig. 2. TOPORS-KO MDS/AML cells have an enhanced sensitivity to HMAs.
a Outline of competitive growth assays with HMAs and cytarabine. b Proportions of GFP-positive TOPORS-KO cells in culture, relative to those at day 1 in competitive growth assays using MOLM-13, MDS-L, SKK-1, and SKM-1 cells (n = 3 for each drug concentration, technical replicates, the experiments were repeated twice independently). Two different sgRNAs against TOPORS (sgTOPORS#1 and sgTOPORS#2) were tested. c Proportions of RFP-positive TOPORS-KO cells in culture, relative to those at day 1 in competitive growth assays using human MLL-AF9-transformed leukemic cells, in the presence and absence of 50 nM DAC (n = 3 for each group, biological replicates). d Western blot data of TOPORS in WT and TOPORS-KO MDS-L single clones. β-actin served as a loading control. The samples derive from the same experiment but different gels were processed in parallel. Growth of WT and TOPORS-KO MOLM-13 (e) and MDS-L (f) single clones in the presence and absence of DAC (n = 3 for each group, technical replicates, the experiments were repeated twice independently). Evaluation of the sensitivity of WT and TOPORS-KO MOLM-13 (g) and MDS-L cells (h) to DAC in xenograft models using NOG and NOG/IL-3/GM-CSF mice, respectively. Treatment timing and overall survival are depicted. Seven mice were analyzed for each group except for TOPORS-KO MDS-L vehicle (n = 6, biological replicates). Tumor burden in MDS-L recipients during DAC treatment (8–20 weeks post-transplantation) was measured by detecting Akaluc bioluminescence signals and relative tumor burden in DAC-treated groups compared with those in non-treated groups is depicted ((h), lower left panel). *p < 0.05; **p < 0.01; ***p < 0.001; n.s., not significant by unpaired two-tailed Student’s t-test. Data are presented as mean ± SD. Source data are provided as a Source Data file.
Fig. 3
Fig. 3. Topors is largely dispensable for normal hematopoiesis.
a Strategy for making a knockout allele for Topors by homologous recombination in embryonic stem cells. A large portion of exon 3 encoding amino acids 67 to 782 was replaced by a neo-cassette. b Representative PCR-based genotyping of mice obtained from breeding heterozygotes. Tail DNA was used as a template. Complete blood counts (c), proportions of myeloid cells (My; Mac-1+ and/or Gr-1+), B220+ B cells, and CD4+ or CD8+ T cells in PB (d), and proportions of BM HSPCs (e) in WT and Topors−/− mice (2–4 months old) (n = 5 for each group, biological replicates). LSK LinSca-1+c-Kit+; MP myeloid progenitor; CMP common myeloid progenitor; GMP granulocyte/macrophage progenitor; MEP megakaryocyte/erythrocyte progenitor. f Transplantation assays. Total BM cells (5 × 106) from WT (red) and Topors−/− (blue) mice were transplanted into lethally irradiated CD45.1 recipient mice. Complete blood counts and proportions of myeloid, B, and T cells in PB at 6 months post-transplantation are depicted (n = 6, biological replicates). g Growth of WT and Topors−/− MLL-AF9-transformed cells in the presence and absence of DAC (n = 3 for each group, biological replicates). h Growth of WT and Topors−/− c-Kit-positive cells in the presence and absence of DAC (n = 3 for each group, biological replicates). i In vivo treatment of MLL-AF9 leukemic cells with DAC. WT and Topors−/− MLL-AF9 leukemic cells were transplanted into lethally irradiated recipient mice with support BM cells from CD45.1 mice. The recipient mice were treated with DAC from 4 to 6 weeks after transplantation. Chimerism of CD45.2 leukemic cells (left panels) and their absolute numbers (right panels) in PB at 4 and 6 weeks. The values of chimerism and absolute numbers at 6 weeks relative to those at 4 weeks (ratio) are also plotted, respectively (n = 9 for WT group, n = 10 for Topors−/− group, biological replicates). *p < 0.05; **p < 0.01; ***p < 0.001; n.s., not significant by unpaired two-tailed Student’s t-test. Data are presented as mean ± SD. Source data are provided as a Source Data file.
Fig. 4
Fig. 4. TOPORS-KO MDS/AML cells show increased apoptosis and mitotic defects upon DAC treatment.
a Frequency of apoptotic cell death in WT and TOPORS-KO MDS-L cells after exposure to 12.5 nM of DAC. Representative flow cytometric profiles of cells at 72 h of DAC exposure (left panel). Percentage of Annexin V-positive cells (n = 3 for each group, technical replicates, the experiments were repeated twice independently) (right panel). b Cell cycle status of WT and TOPORS-KO MDS-L cells after exposure to 12.5 nM of DAC evaluated by EdU incorporation and DAPI staining. Representative flow cytometric profiles of cells at 72 h of DAC exposure (left panel). Proportion of each cell cycle (middle panel) and hyperploidy cells at the indicated time points (right panel) (n = 3 for each group, technical replicates, the experiments were repeated twice independently). Data are presented as mean ± SD. Source data are provided as a Source Data file.
Fig. 5
Fig. 5. DNMT1 is stabilized in TOPORS-KO cells.
a Effects of TOPORS and TOPORS-RD add-back on TOPORS-KO MDS-L cell growth in the presence and absence of 12.5 nM DAC (n = 3 for each group, biological replicates). Reduction rate of cell numbers on day 7 of culture compared to those of WT MDS-L cells are depicted (right). Full-length TOPORS with silent mutations (CGC to AGA) in the sgTOPORS#1 target sequence was used. b Outline of the second CRISPR-Cas9 screening using TOPORS-KO single-cell clones with and without DAC. c Scatter plots showing the β-scores of each gene in the presence and absence of DAC. Candidate genes with proportionally increased sgRNA read counts during culture in the presence of DAC compared to those in the absence of DAC are indicated by red and purple dots. d Venn diagram showing the two overlapping candidate genes, UHRF1 and DNMT1, between MOLM-13 and MDS-L screenings. e Changes in DNMT1 and UHRF1 protein levels after exposure to low-dose DAC (12.5 nM) in WT and TOPORS-KO MDS-L cells. Unmodified (main band) and modified (sub-band) DNMT1 are indicated. The samples derive from the same experiment but different gels for DNMT1, β-actin, and another for UHRF1 were processed in parallel. f DAC-induced SUMOylation and degradation of DNMT1. WT and TOPORS-KO MDS-L cells were exposed to a high dose of DAC (10 µM) for 8 h in the presence and absence of the SUMO inhibitor, ML-792 (3 µM), or the proteasome inhibitor, MG132 (20 µM). Unmodified (main band) and modified (sub-band) DNMT1 are indicated. Changes in DNMT1 protein levels after exposure to high-dose DAC (10 µM) for 8 h in WT and TOPORS-KO MOLM-13 cells (g) and mouse MLL-AF9 leukemic cells (h). i Reduction rate of DNMT1 unmodified main bands after DAC treatment. Intensity of DNMT1 main bands after DAC treatment in (g, h, and i) relative to those before DAC treatment are indicated (n = 3 for each group, independent replicates). **p < 0.01; ***p < 0.001; n.s., not significant by unpaired two-tailed Student’s t-test. Data are presented as mean ± SD. Source data are provided as a Source Data file.
Fig. 6
Fig. 6. TOPORS promotes ubiquitination of SUMOylated DNMT1.
a Outline of mass spectrometric analysis on ubiquitinated proteins in MDS-L cells after DAC exposure. b GO terms enriched in ubiquitinated peptides detected in WT MDS-L cells compared to those in TOPORS-KO MDS-L cells. c Heat map showing enrichment of the DNMT1-derived ubiquitinated peptides in WT MDS-L cells compared to TOPORS-KO MDS-L cells. The abundance of ubiquitinated DNMT1 was normalized to the abundance of total DNMT1. d SUMOylation and ubiquitination levels of DNMT1 in WT and TOPORS-KO MDS-L cells treated with 10 nM DAC for 2 h. Endogenous DNMT1 immunoprecipitated with anti-DNMT1 nanobody was subjected to western blotting. β-actin was served as a loading control of the inputs. The samples derive from the same experiment but different gels for all were processed in parallel. e A model of TOPORS function found in this study. Source data are provided as a Source Data file.
Fig. 7
Fig. 7. Pharmacological intervention induces mitotic defects via DNMT1 stabilization.
a Changes to DNMT1 protein levels after exposure to DAC in WT and TOPORS-KO MDS-L cells. The cells were exposed to a high dose of DAC (10 µM) for 8 h in the presence and absence of TAK-243 (1 µM), or TAK-981 (3 µM) (n = 3 for each group, independent replicates). b Growth of WT and TOPORS-KO MDS-L clones in the presence and absence of DAC and/or TAK-243 (n = 3 for each group, technical replicates, the experiments were repeated twice independently). c Frequency of apoptotic cell death in MDS-L cells after exposure to 12.5 nM of DAC. Representative flow cytometric profiles of cells at 72 h of DAC exposure (left panel). Percentage of Annexin V-positive cells (n = 3 for each group, technical replicates, the experiments were repeated twice independently) (right panel). d Cell cycle status of WT and TOPORS-KO MDS-L cells 72 h after exposure to DAC (12.5 nM) and/or TAK-243 (30 nM). Representative flow cytometric profiles of cells (left panel). Proportion of each cell cycle evaluated by EdU incorporation and DAPI staining (n = 3 for each group, technical replicates, the experiments were repeated twice independently) (right panel). e In vivo treatment of MOLM-13 cells with the combination of DAC and TAK-243. WT MOLM-13 cells were transplanted into NOG mice. The recipient mice were treated with DAC and/or TAK-243 until they died. Treatment timing and overall survival are depicted (n = 7 for each group, biological replicates). **p < 0.01; ***p < 0.001; n.s., not significant by unpaired two-tailed Student’s t-test. Data are presented as mean ± SD. Source data are provided as a Source Data file.
Fig. 8
Fig. 8. The combination of DAC and TAK-243 is effective for primary AML samples.
a Clinical information and genetic mutations of patient samples. AMMoL, acute myelomonocytic leukemia; AML-MRC, AML with myelodysplasia-related changes. b Synergistic effects between DAC and TAK-243 in patients’ samples at various combinations of concentrations. Synergy was calculated using the SynergyFinder 3.0, and BLISS was used to denote scores. Representative combinations of concentrations at which the synergistic effect was particularly strong are shown by dots. Representative synergistic effects of combinations are also depicted (right panel) (CH0680, DAC 100 nM and TAK-243 33 nM; CH1277, DAC 33 nM and TAK-243 100 nM) (n = 3 for each group, biological replicates). c Schema of the PDX study. Treatment timing is depicted. d Absolute number of human CD45-positive cells in PB and their ratio before and after treatment in each group (n = 4 for each group, biological replicates). ***p < 0.001 by the Student’s t-test. Data are presented as mean ± SD. Source data are provided as a Source Data file.

References

    1. Duchmann, M. & Itzykson, R. Clinical update on hypomethylating agents. Int. J. Hematol.110, 161–169 (2019). 10.1007/s12185-019-02651-9 - DOI - PubMed
    1. Sorm, F., Pískala, A., Cihák, A. & Veselý, J. 5-Azacytidine, a new, highly effective cancerostatic. Experientia20, 202–203 (1964). 10.1007/BF02135399 - DOI - PubMed
    1. Weiss, A. J., Stambaugh, J. E., Mastrangelo, M. J., Laucius, J. F. & Bellet, R. E. Phase I study of 5-azacytidine (NSC-102816). Cancer Chemother. Rep.56, 413–419 (1972). - PubMed
    1. Von Hoff, D. D., Slavik, M. & Muggia, F. M. 5-Azacytidine. A new anticancer drug with effectiveness in acute myelogenous leukemia. Ann. Intern. Med.85, 237–245 (1976). 10.7326/0003-4819-85-2-237 - DOI - PubMed
    1. Jones, P. A. & Taylor, S. M. Cellular differentiation, cytidine analogs and DNA methylation. Cell20, 85–93 (1980). 10.1016/0092-8674(80)90237-8 - DOI - PubMed

MeSH terms

Substances