. 2024 Aug 28;14(1):151.
doi: 10.1038/s41408-024-01123-6.

B-cell intrinsic RANK signaling cooperates with TCL1 to induce lineage-dependent B-cell transformation

Affiliations

B-cell intrinsic RANK signaling cooperates with TCL1 to induce lineage-dependent B-cell transformation

Lisa Pfeuffer et al. Blood Cancer J. .

Abstract

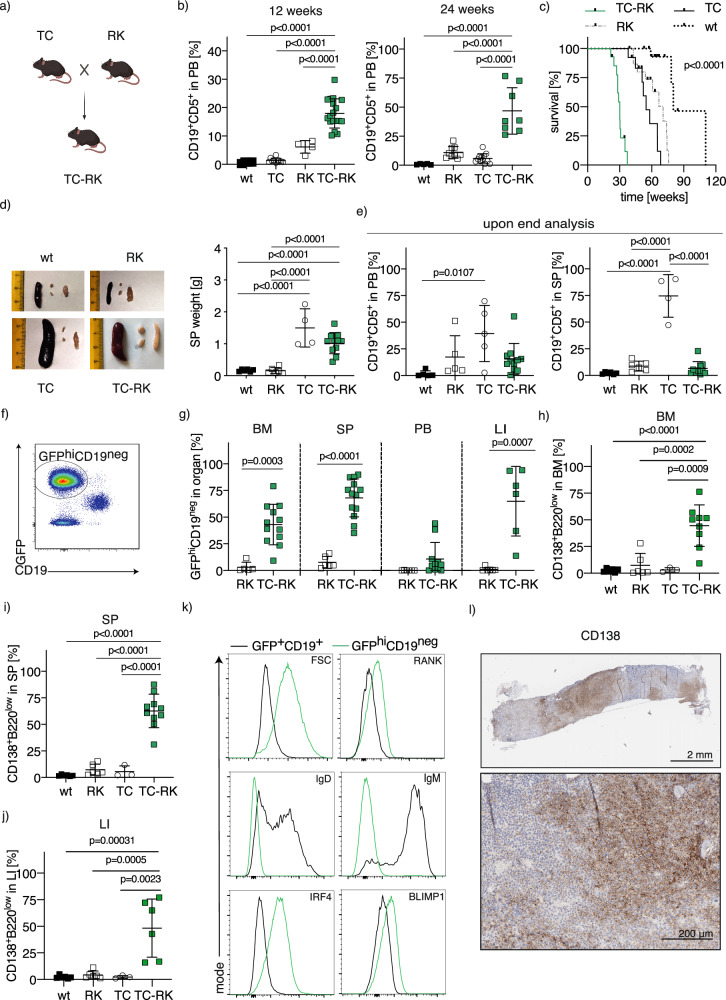
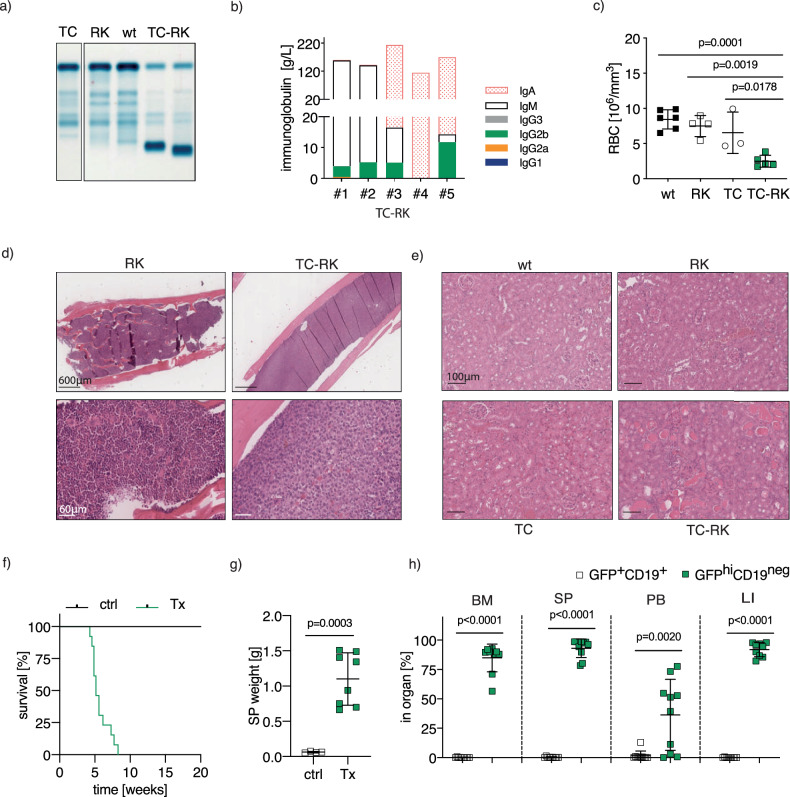
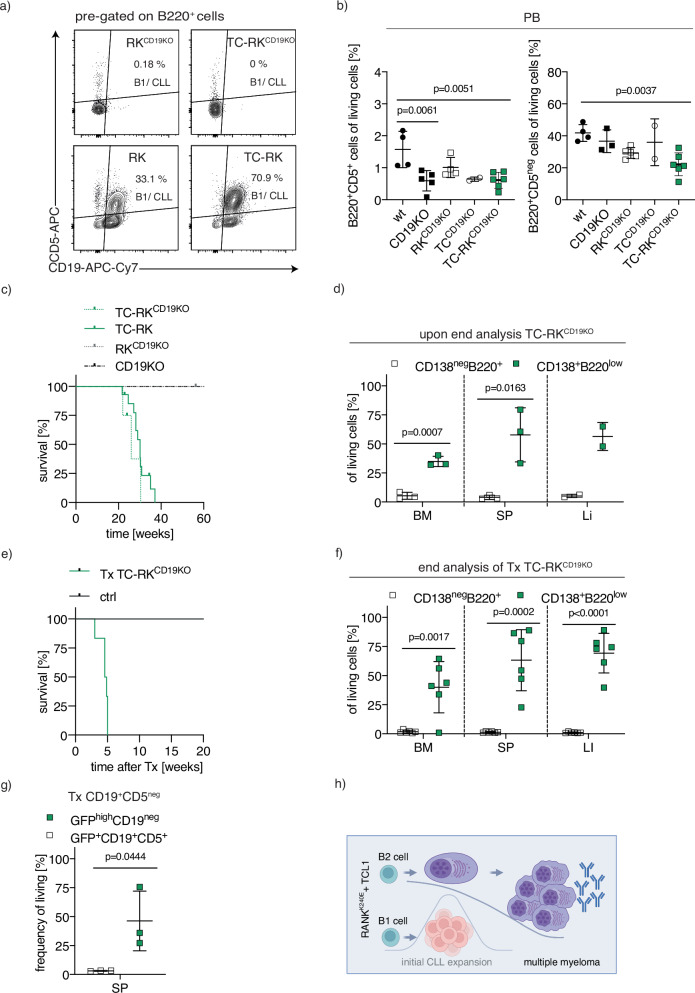
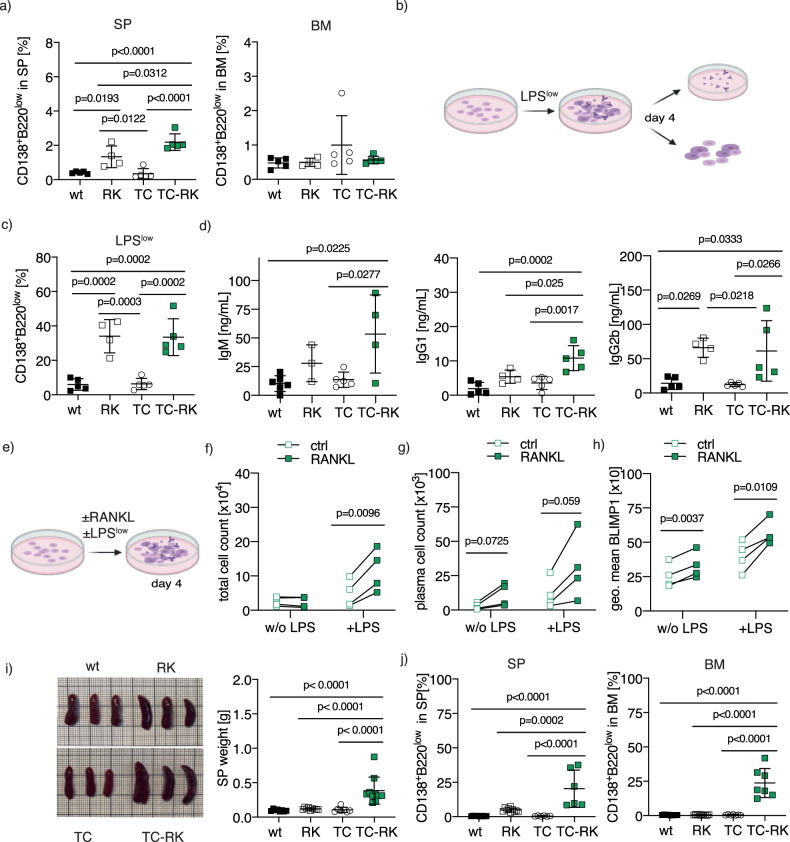
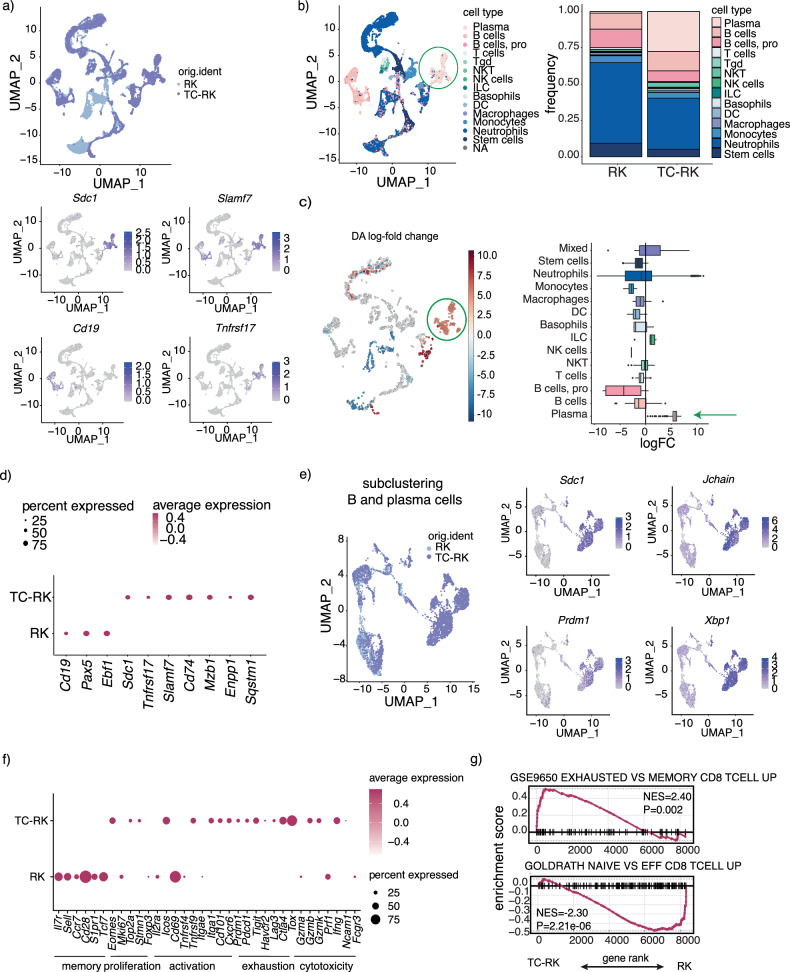
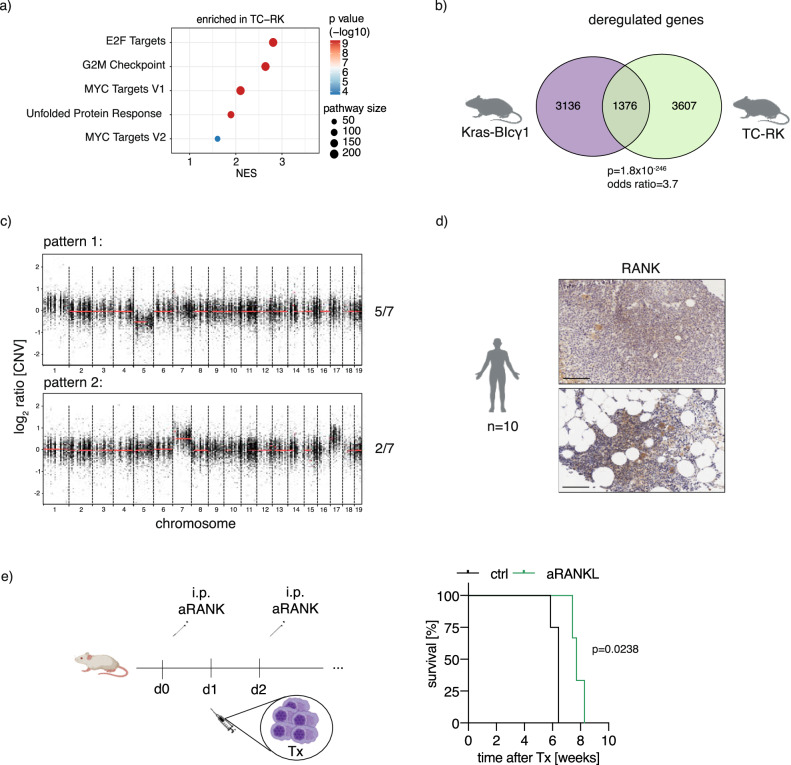
B-cell malignancies, such as chronic lymphocytic leukemia (CLL) and multiple myeloma (MM), remain incurable, with MM particularly prone to relapse. Our study introduces a novel mouse model with active RANK signaling and the TCL1 oncogene, displaying both CLL and MM phenotypes. In younger mice, TCL1 and RANK expression expands CLL-like B1-lymphocytes, while MM originates from B2-cells, becoming predominant in later stages and leading to severe disease progression and mortality. The induced MM mimics human disease, exhibiting features like clonal plasma cell expansion, paraproteinemia, anemia, and kidney and bone failure, as well as critical immunosurveillance strategies that promote a tumor-supportive microenvironment. This research elucidates the differential impacts of RANK activation in B1- and B2-cells and underscores the distinct roles of single versus combined oncogenes in B-cell malignancies. We also demonstrate that human MM cells express RANK and that inhibiting RANK signaling can reduce MM progression in a xenotransplantation model. Our study provides a rationale for further investigating the effects of RANK signaling in B-cell transformation and the shaping of a tumor-promoting microenvironment.


Conflict of interest statement

The authors declare no competing interests.

Figures

Fig. 1
Fig. 1. Active RANK and TCL1 signaling in B-cells causes a plasma cell disorder.
a Breeding scheme to generate TC-RK mice. Scheme was generated with BioRender.com. b Percentage of CD19+CD5+ of total viable lymphocytes in the peripheral blood of 12- and 24- week-old animals (n = 3–17 per genotype) determined by flow cytometry. Wildtype and CD19Cre animals are pooled as wt. Data was pooled from more than three experiments. c Kaplan-Meier overall survival analysis of TC-RK (n = 14), TC (n = 13), RK (n = 16) and wt (n = 17) control mice. For statistical analysis, p value of the log-rank test is shown. d Macroscopic appearance of representative spleens and lymph nodes (left) and dot plot graph (right) depicts spleen (SP) weight in gram (g) of diseased or aged mice with indicated genotypes (n = 4–11 per genotype). e Percentage of CD19+CD5+ of viable cells in the peripheral blood (PB, left, n = 5–11 per genotype) and SP (right, n = 5–13 per genotype) from animals with indicated genotypes upon signs of disease or aged mice. f Representative flow cytometric analysis of GFP and CD19 expression on viable splenocytes from a diseased TC-RK mouse. g Percentages of GFPhiCD19neg cells of viable cells from BM, SP, PB and LI isolated from diseased TC-RK mice (n = 6–13 per organ) compared to aged RK mice (n = 5–6 per organ). h Percentages of CD138+B220low cells of viable cells from bone marrow (BM) from diseased TC-RK mice and diseased or aged control mice (n = 3–10 per genotype). i Percentages of CD138+B220low cells of viable splenocytes cells from diseased TC-RK mice and diseased or aged control mice (n = 3–9 per genotype). j Percentages of CD138+B220low cells of viable cells from liver (LI) of diseased TC-RK mice and diseased or aged control mice (n = 3–6 genotype). k Representative histograms of forward scatter area (FSC-A), surface RANK, CD138, B220, IgM and IgD, as well as intracellular IRF4 and BLIMP1 from GFPhiCD19neg cells (green) compared to GFP+CD19+ cells (black) from TC-RK mice. l Representative images of CD138 immunohistochemistry from bone of a diseased TC-RK mouse (scale bars: overview = 2 mm, detailed image with 20x magnification = 200 μm). Statistical analysis was performed using Student’s t-test and the one-way ANOVA with Tukey correction for multiple comparison. The p values are indicated in respective graphs. All data are presented as mean ± standard deviation.
Fig. 2
Fig. 2. TC-RK induced disease mirrors features of human multiple myeloma.
a Representative serum electrophoresis of immunoglobulins from TC-RK and control mice. b Representative quantification of immunoglobulin isotypes in plasma samples of five diseased TC-RK mice by flow cytometry-based multiplex immunoassay. c Red blood cell count (RBC) of diseased TC-RK mice and indicated controls (n = 3–6 per genotype). d Representative images of H&E staining from bone marrow of five-month-old RK and TC-RK mice (scale bars: overview = 600 μm, detailed images: 60 μm) e Representative images of H&E staining from kidneys of diseased TC-RK mice and indicated diseased or aged control mice (scale bars: 100 μm). f Kaplan-Meier OS analysis of Rag2ko mice (n = 13) transplanted with TC-RK splenocytes derived from four different sick donor mice compared to Rag2ko control mice. g Spleen weight of Rag2ko mice (n = 8) transplanted with TC-RK splenocytes at end point and aged-matched Rag2ko mice (n = 4). h Percentages of GFPhiCD19neg cells and GFP+CD19+ cells of viable cells from BM, SP, PB and LI isolated from diseased Rag2ko mice (n = 9–10 per organ) transplanted with TC-RK splenocytes derived from three different donor mice. Statistical analysis was performed using Student’s t-test and one-way ANOVA with Tukey correction for multiple comparison. P values are indicated in respective graphs and all data are presented as mean ± standard deviation.
Fig. 3
Fig. 3. Origin of myeloma cells in TC-RK driven mouse models.
a Representative flow cytometric analysis of CD5 and CD19 expression on B220+ splenocytes from mice with indicated genotypes. b Percentage of B220+CD5+ and B220+CD5neg cells of total viable lymphocytes in the peripheral blood from animals with indicated genotypes (n = 2–6 per genotype) determined by flow cytometry. Pooled data from three different experiments. c Kaplan-Meier OS analysis of TC-RKCD19KO (n = 4) mice compared to TC-RK (n = 13) and RKCD19KO (n = 3) and CD19KO (n = 5) mice. d Percentages of CD138+B220low and B220+CD138neg cells of viable cells from BM, SP and LI isolated from diseased TC-RKCD19KO mice (n = 3). e Kaplan-Meier OS analysis of Rag2ko mice (n = 6) transplanted with TC-RKCD19KO splenocytes derived from two different sick donor mice compared to Rag2ko control mice. f Percentages of CD138+B220neg cells and B220+CD138neg cells of viable cells from BM, SP and LI isolated from diseased Rag2ko mice (n = 6) transplanted with TC-RKCD19KO splenocytes derived from two different donor mice. g Percentages of GFPhiCD19neg and GFP+CD19+ cells of viable splenocytes isolated from Rag2ko mice (n = 3) after transplantation of sorted CD19+CD5neg BM cells from three different 3-month-old TC-RK donor mice. h Graphical summary of B2-cells giving rise to MM cells and B1-cells giving rise to CLL cells in TC-RK mice. Graphic was generated with BioRender.com. Statistical analysis was performed using Student’s t-test and one-way ANOVA with Tukey correction for multiple comparison. P values are indicated in respective graphs and all data are presented as mean ± standard deviation.
Fig. 4
Fig. 4. Active RANK signaling drives a plasma cell differentiation program via Blimp1 expression.
a Percentages of CD138+B220low plasma cells of viable cells from SP (left) and BM (right) of six-week-old TC-RK (n = 5) and control mice (n = 4–5 per genotype). Pooled data from three different experiments. b Experimental set up of in vitro differentiation of naive B-cells using low concentrations of LPS (LPSlow, 100 ng/mL). B-cell stage and immunoglobulins in supernatants were analyzed by flow cytometry four days after stimulation. Graphic was created using BioRender.com. c Percentages of CD138+B220low plasma cells after in vitro differentiation of naive B-cells derived from animals with indicated genotype (n = 4–5 per genotype) with LPSlow were determined by flow cytometry after four days. Biological replicates were pooled from two individual experiments. d Quantification of immunoglobulin isotypes in supernatants from in vitro differentiated naive B-cells, derived from animals with indicated genotype (n = 3–5 per genotype) and stimulated for four days with LPSlow, by flow cytometry-based multiplex immunoassay. Pooled data from two independent experiments. e Experimental set up of in vitro differentiation of naive B-cells derived from TC-RK mice using recombinant RANKL in presence or absence of LPSlow for four days. f Total TC-RK-derived B-cell count (n = 4) per well after in vitro stimulation with RANKL and LPSlow as indicated. Biological replicates were pooled from two individual experiments. g TC-RK-derived CD138+B220low plasma cell count (n = 4) per well after in vitro differentiation using RANKL and LPSlow as indicated. Biological replicates were pooled from two individual experiments. h Geometric mean (geo. mean) of BLIMP1 from living cells after in vitro differentiation of TC-RK-derived B-cells (n = 4) using RANKL and LPSlow as indicated. Biological replicates were pooled from two individual experiments. i Macroscopic appearance of representative spleens (left) and dot plot graph (right) depicts SP weight in gram (g) of 20-week-old TC-RK (n = 10) and aged-matched control mice (n = 7–9 per genotype). j Percentages of CD138+B220low plasma cells of viable cells from SP (left) and BM (right) from 20-week-old TC-RK (n = 6–7) and aged-matched control mice (n = 6–10 per genotype). Pooled data from more than three experiments. Statistical analysis was performed using Student’s t-test and one-way ANOVA with Tukey correction for multiple comparison. P values are indicated in respective graphs. All data are presented as mean ± standard deviation.
Fig. 5
Fig. 5. Landscape of the bone marrow microenvironment in TC-RK mice.
a Uniform manifold approximation and projection (UMAP) visualizations of unsupervised clustering analysis of all cells that passed quality filtering. Cells are colored according to their genotype in the upper row and according to their Sdc1, Cd19, Tnfrsf17 and Slamf7 expression respectively below. b UMAP visualization of annotated clusters (left) and frequency of clusters (right) in RK (pooled from 3 mice) and TC-RK (pooled from 4 mice) derived BM cells. Plasma cells are highlighted with a green circle in the UMAP. c Differential abundance (DA) analysis for changes in cluster abundance (left) and log-fold change for each annotated cluster (right). Plasma cell cluster is highlighted by a green circle (left) or a green arrow (right). d Gene expression dot plot depicts the percent and average expression of B-cell markers within the B and plasma cell subcluster. e UMAP visualization of unsupervised clustering analysis of B-cells and plasma cells (defined by Sdc1 and Slamf7 expression). Cells are color coded according to their genotype (left) or according to Sdc1, Jchain, Prdm1 and Xpb1 expression respectively (right). f Gene expression profile visualize the percent and average expression of T-cell markers within the T-cell cluster. g Gene set enrichment analysis (GSEA) plot for CD8 T-cell exhaustion enriched T-cells from TC-RK mice (top) and GSEA plot of naive CD8 T-cells enriched in T-cells of RK mice (bottom).
Fig. 6
Fig. 6. Comparative analysis between TC-RK induced myeloma and both other murine MM mouse models and human disease.
a GSEA analysis showing hallmarks enriched in splenic plasma cells of TC-RK mice compared to plasma cells of RK mice. NES, normalized enrichment score. b Venn diagram depicts the overlap of deregulated genes in myeloma cells from Kras-BIγ1 mice [33] and TC-RK mice. Fisher’s exact test was applied and both p value and odd ratio are depicted. Illustrations were generated using BioRender.com. c Representative copy number variation patterns of myeloma cells from TC-RK mice (n = 7). d Representative immunohistochemistry staining of primary patient biopsies confirmed RANK expression in myeloma cells. Illustrations were generated using BioRender.com. e Treatment schedule of xenograft model with anti-RANKL antibody prior and after injection of L363 in NSG mice (top) and Kaplan-Meier survival analysis (bottom) is shown for NSG mice received anti-RANKL (n = 3) or vehicle (n = 4) therapy prior and after L363 transplantation (Tx L363). Statistical significance with corresponding p values calculated by log-rank (Mantel-Cox) test is depicted in the graph. Graph represents one out of three independent experiments.

References

    1. LeBien TW, Tedder TF. B lymphocytes: how they develop and function. Blood. 2008;112:1570–80. 10.1182/blood-2008-02-078071 - DOI - PMC - PubMed
    1. Annunziata CM, Davis RE, Demchenko Y, Bellamy W, Gabrea A, Zhan F, et al. Frequent engagement of the classical and alternative NF-kappaB pathways by diverse genetic abnormalities in multiple myeloma. Cancer Cell. 2007;12:115–30. 10.1016/j.ccr.2007.07.004 - DOI - PMC - PubMed
    1. Gasparini C, Celeghini C, Monasta L, Zauli G. NF-kappaB pathways in hematological malignancies. Cell Mol Life Sci. 2014;71:2083–102. 10.1007/s00018-013-1545-4 - DOI - PMC - PubMed
    1. Lim KH, Yang Y, Staudt LM. Pathogenetic importance and therapeutic implications of NF-kappaB in lymphoid malignancies. Immunol Rev. 2012;246:359–78. 10.1111/j.1600-065X.2012.01105.x - DOI - PMC - PubMed
    1. Compagno M, Lim WK, Grunn A, Nandula SV, Brahmachary M, Shen Q, et al. Mutations of multiple genes cause deregulation of NF-kappaB in diffuse large B-cell lymphoma. Nature. 2009;459:717–21. 10.1038/nature07968 - DOI - PMC - PubMed

Publication types

MeSH terms

LinkOut - more resources