. 2024 Aug 28;15(1):7360.
doi: 10.1038/s41467-024-51646-6.

TOPORS E3 ligase mediates resistance to hypomethylating agent cytotoxicity in acute myeloid leukemia cells

Affiliations

TOPORS E3 ligase mediates resistance to hypomethylating agent cytotoxicity in acute myeloid leukemia cells

Peter Truong et al. Nat Commun. .

Abstract

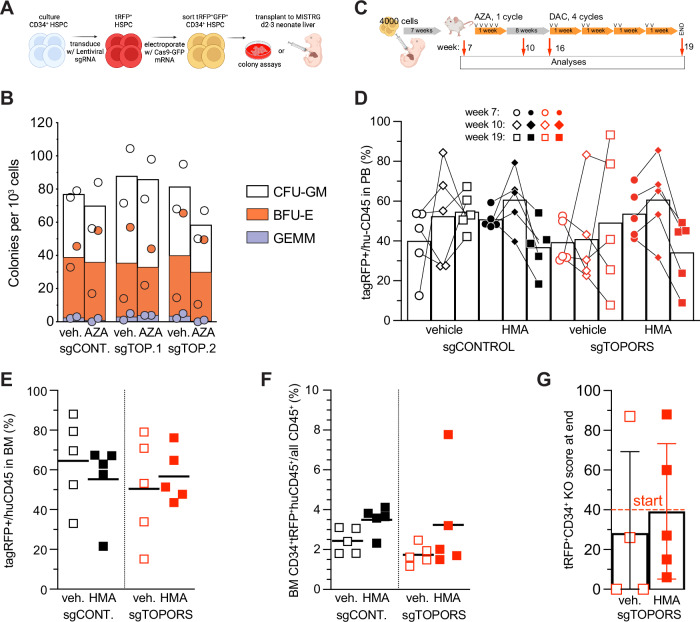
Hypomethylating agents (HMAs) are frontline therapies for Myelodysplastic Neoplasms (MDS) and Acute Myeloid Leukemia (AML). However, acquired resistance and treatment failure are commonplace. To address this, we perform a genome-wide CRISPR-Cas9 screen in a human MDS-derived cell line, MDS-L, and identify TOPORS as a loss-of-function target that synergizes with HMAs, reducing leukemic burden and improving survival in xenograft models. We demonstrate that depletion of TOPORS mediates sensitivity to HMAs by predisposing leukemic blasts to an impaired DNA damage response (DDR) accompanied by an accumulation of SUMOylated DNMT1 in HMA-treated TOPORS-depleted cells. The combination of HMAs with targeting of TOPORS does not impair healthy hematopoiesis. While inhibitors of TOPORS are unavailable, we show that inhibition of protein SUMOylation with TAK-981 partially phenocopies HMA-sensitivity and DDR impairment. Overall, our data suggest that the combination of HMAs with inhibition of SUMOylation or TOPORS is a rational treatment option for High-Risk MDS (HR-MDS) or AML.


Conflict of interest statement

P.T., J.A.I.T., C.J., and J.P. are listed as inventors/contributors in P0054922PCT. The remaining authors declare no competing interests.

Figures

Fig. 1
Fig. 1. Genome-wide CRISPR-Cas9 dropout screening identifies genetic determinants of AZA-sensitivity.
A Schematic of the genome-wide CRISPR-Cas9 dropout screen workflow performed in AZA-treated Cas9-expressing MDS-L. B MAGeCKFlute nine-square correlation plot using cell-cycle normalized β scores calculated for each gene target (n = 2), highlighting sgRNAs specifically (red) enriched, or (blue) depleted following AZA selection. C ClueGO pathway term network highlighting biological processes enriched in dropout hits. D Competitive proliferation assay workflow. MDS-L/Cas9 cells were transduced with lentiviral vectors encoding a single sgRNA plus a tagRFP657 (tagRFP657) reporter from separate promoters. E Validation of AZA-selection against TOPORS-, UBE2K-, and UBXN7-editing using the competitive proliferation assay shown in D. In each plot, y = %tagRFP+ in AZA/mean %tagRFP+ in vehicle; n = 3 technical replicates. Source data are provided as a Source Data file. Panels A and D created with BioRender.com released under a Creative Commons Attribution-Non Commercial-No Derivs 4.0 International license.
Fig. 2
Fig. 2. Loss of TOPORS sensitizes MDS and AML cell lines to AZA.
A, B Dose-survival plots of FP+ cell counts following four daily applications of AZA to MDS-L cells polyclonally expressing Cas9 plus (A) single sgRNAs, or (B) single shRNAs which targeted TOPORS or a non-targeting control. Dots are means (n = 4 technical replicates per data point) normalized to the vehicle control, ±SD. Each experiment was performed once, with two independent targeting RNAs tested per experiment. C Clonogenic assays performed using TOPORS-edited MDS-L cells pre-treated with 0.3 µM AZA as in A before plating in methylcellulose medium. Colonies were counted two weeks after methylcellulose plating. 2-way ANOVA: ***P ≤ 0.001, ****P ≤ 0.0001. n = 3 biological replicates per treatment. D Dose-survival plots of tagRFP+ cell counts following 4 days of daily treatment with the indicated AZA concentrations in AML cell lines polyclonally expressing Cas9 plus single sgRNAs or a non-targeting control sgRNA. Dots are means (n = 4 technical replicates per data point) normalized to the vehicle control, ±SD. Each experiment was performed once, with two independent targeting RNAs tested per experiment. E The change in whole body luminescence flux in MISTRG mice engrafted with 105 MOLM-13 cells which polyclonally express luciferase, Cas9 and the indicated sgRNAs, immediately following 1 cycle of treatment with AZA or vehicle i.p.- as described by the time-based x-axis in F. FDR q-values (threshold = 0.01) are reported for a Mann–Whitney multiple comparison test; n = 7 (sgControl 0.3 mg/kg AZA), n = 8 (sgControl 1.0 mg/kg AZA, sgTOPORS 0.3 mg/kg AZA), n = 9 (sgControl 0 mg/kg AZA, sgTOPORS 1.0 mg/kg AZA) or n = 10 (sgTOPORS 0 mg/kg AZA) mice per treatment group. F Kaplan-Meier plots for survival of the same MISTRG mice as E. Whole body luminescence (IVIS) was performed 8 days after engraftment to give a pre-AZA baseline (which was used to rank-randomize mice into treatment groups based on sex and relative engraftment- pre-AZA in E), and again on day 18 – two days after completion of the treatment cycle (post-AZA in E). Event-free survival was scored according to ethics guidelines. **Gehan-Breslow-Wilcoxon test P = 0.0029 (one degree of freedom) for sgCONTROL versus sgTOPORS-2 at 1.0 mg/kg AZA. Source data are provided as a Source Data file.
Fig. 3
Fig. 3. Targeting TOPORS functionally spares healthy hematopoiesis.
A Workflow for lentiviral stable sgRNA + tagRFP delivery, followed by electroporation of transient Cas9-GFP fusion mRNA into primary CD34+ cord blood-derived HSPCs for target gene editing. B Colony forming capacity of tagRFP-sorted gene-edited CD34+ HSPCs pre-treated with AZA. Bars indicate means of n = 2 experiments using independent cord blood donors. C Workflow for engraftment into MISTRG neonates with tagRFP-sorted gene-edited CD34+ HSPCs, followed by drug-treatment, blood monitoring, and endpoint analysis of the engrafted adults. D Tracking of tagRFP+-frequencies in huCD45+moCD45- cells for each engrafted mouse indicating frequencies (circles) before drug treatment, (diamonds) after one AZA cycle, and (squares) after AZA followed by DAC cycles. Bars indicate means for each treatment group (n = 5 host mice per group). E, F Endpoint bone marrow frequencies for each engrafted mouse, with line for mean (n = 5 host mice per group); (E) % tagRFP+ cells amongst huCD45+moCD45 cells, or (F) % CD34+ tagRFP+ huCD45+ moCD45 cells amongst all CD45+ cells. G Polyclonal indel KO scores generated by ICE algorithm for tagRFP+CD34+huCD45+moCD45- cells sorted from endpoint bone marrows. Bars: means ± SD (n = 5 host mice per group). Dashed line: Polyclonal indel KO score generated by ICE algorithm for day of engraftment (n = 1 pool of donor cells). Source data are provided as a Source Data file. Panels A and C created with BioRender.com released under a Creative Commons Attribution-Non Commercial-No Derivs 4.0 International license.
Fig. 4
Fig. 4. Targeting TOPORS sensitizes leukemic cells to HMAs via defective DDR.
A Mean fluorescence intensity of anti-γH2AX staining by FACS of fixed/permeabilized gene-edited MDS-L cells treated daily with 0.3 μM AZA for 4 days. **Adjusted P value < 0.01 by Kruskal-Wallis test, n = 3 biological replicates; P > 0.05 comparisons not shown. Inset: FACS data representing the middle data point for each treatment. B Detection of DNA breaks by comet assay in gene-edited MDS-L cells treated with 0.3 μM AZA as for A. ****Adjusted P values from Kruskal-Wallis test, n = 75 cells per group; P > 0.05 are not shown. C Example DNA content profiles determined by DAPI staining of gene-edited MDS-L cells treated with 0.3 μM AZA. D Stacked histograms showing mean ± SD from biological triplicates of C; ***Adjusted P values are for fraction in G1 by Tukey’s one-way ANOVA; P > 0.05 comparisons not shown. E Proportion of apoptotic cells determined by Annexin/PI staining in gene-edited MDS-L cells treated with 0.3 μM AZA or vehicle. Adjusted P values are from Tukey’s one-way ANOVA, n = 3 biological replicates; P > 0.05 comparisons not shown. F Incorporation of 5 aza-dC, and (G) methylation at dC, in genomic DNA (both determined by LC-MS) in polyclonally gene-edited MDS-L cells exposed to 0.3 µM AZA daily as for A. Adjusted P > 0.05 for the selected pairwise comparisons by Tukey’s two-way ANOVA, n = 3 technical replicate cultures. Each experiment was performed once. Source data are provided as a Source Data file.
Fig. 5
Fig. 5. Multi-omic approaches reveal widespread altered splicing of DDR genes in TOPORS-edited MDS-L cells, which is increased by AZA-treatment.
A Gene set enrichment analysis of differentially expressed genes using the KEGG module as part of the clusterProfiler algorithm. Significantly enriched activated or suppressed pathways were identified using the gseKEGG function in clusterProfiler with p < 0.05. Dot plots depict gene sets that are enriched or suppressed in AZA-treated TOPORS-edited MDS-L cells compared to AZA-treated control cells. B Unsupervised hierarchical clustering and heatmap of 3826 most significant differentially spliced events between all samples (n = 3 biological replicate cultures per condition). C Numbers of alterative splicing events, and (D) over-representation analysis (GO pathways) of alterative splicing events, detected in TOPORS-edited compared to control MDS-L cells treated with (top) vehicle or (bottom) AZA. The statistical analyses were performed using Metascape, where a hypergeometric test and Benjamini-Hochberg p-value correction algorithm was used to identify significantly enriched pathways. E, F Motif scanning analysis for AGCGGA (SRSF6) binding sites across a meta-exon (green) generated from all exon skipping events in (E) AZA-treated, or (F) vehicle-treated cells expressing sgTOPORS versus sgCONTROL. Motif enrichment scores (left axis) and -log10(P values) (right axis) are shown. (red) Motif enrichment scores of exons differentially retained in TOPORS-edited MDS-L cells. (blue) Motif enrichment scores of exons differentially skipped in TOPORS-edited MDS-L cells. (dashed) Significance scores. (black) background score calculated from all non-differentially spliced exons. The statistical analyses were performed using rMATS, where positions with significant difference in motif scores were identified through Wilcoxon’s rank-sum test. Source data are provided as a Source Data file.
Fig. 6
Fig. 6. Nuclear proteomics reveals a depletion of global nucleotide excision repair factors in AZA-treated TOPORS-edited MDS-L cells.
A Heatmap of unsupervised hierarchical clustering of 73 proteins that were significantly differentially abundant across all nuclear extracts from triplicate cultures of polyclonally gene-edited MDS-L cells treated daily with 0.3 µM AZA or vehicle for 4 days; n = 3 biological replicate cultures per condition. B Overrepresentation pathway analysis of proteins enriched or depleted in (top) cluster 4 and (bottom) cluster 6. (middle) Normalized total spectra (Scaffold 5.3.2) for DNMT1 peptides detected in each replicate. Adjusted P values by Tukey’s one-way ANOVA, n = 3 biological replicate cultures per condition; P > 0.05 comparisons not shown. C Sequential detection in western blot of (top) DNMT1, then (middle) β-actin, then (bottom) SUMO2/3 in 10 µg nuclear proteins from gene-edited MOLM-13 cells treated with 42 nM DAC or vehicle daily in technical triplicate cultures for 3 days. The experiment was perfomed once. Source data are provided as a Source Data file.
Fig. 7
Fig. 7. TOPORS-editing sensitizes cells to HMA in a DNMT1-dependent manner.
A (left axis) Survival of polyclonally gene-edited or wild-type MDS-L cells cultured in 96-well plates in response to daily doses of the DNMTi GSK3685032 or vehicle on days 1–4. (left axis) tagRFP+ cells (or all cells for wild-type MDS-L) were counted on day 5 and normalized to vehicle counts; n = 3 technical replicate culture wells per data point. (right axis) In a separate experiment, relative demethylation of LINE-1 promoters in wild-type MDS-L was determined (see “Methods”) for a similar GSK3685032 dose range and normalized to vehicle control cells; n = 3 technical replicate culture wells per data point. B Polyclonally gene-edited MDS-L cells were plated into 96-well plates and treated with 1 µM GSK3685032 or vehicle on day 1. Varying DAC plus 1 µM GSK3685032 or vehicle was added daily on days 2–4, and tagRFP+ cells counted on day 5, and normalized to vehicle counts. C, D Polyclonally gene-edited MDS-L cells were plated into 96-well plates and treated on day 1 only with (C) Topotecan or (D) Etoposide or vehicle. Absorbance at 490 nm was measured in MTS assays on day 5 and normalized to vehicle. E Polyclonally gene-edited MDS-L cells in 96-well plates were treated with daily Hydroxyurea or vehicle on days 1–4. tagRFP+ cells were counted on day 5 and normalized to vehicle counts. In all panels, dots represent mean ± SD, (A, B) n = 3 technical replicate cultures per data point, (CE) n = 4 technical replicate cultures per data point. EC50 values deduced from all panels are shown in Table S2. Each experiment was performed once. Source data are provided as a Source Data file.
Fig. 8
Fig. 8. TOPORS-editing does not reduce SUMOylation of DNMT1 in HMA-treated AML cells.
Proteomic analysis of whole cell Ni-NTA enriched proteins from polyclonally gene-edited MOLM-13 cells expressing 10xHis-SUMO1 that were exposed to 42 nM DAC or vehicle for 3 days; n = 4 biological replicate cultures per group. A, B Volcano plots (Scaffold 5.3.2) highlighting proteins significantly enriched (uncorrected two-sided P from T-test) in TOPORS-edited cells compared to control cells under (A) steady-state (i.e. vehicle treated) conditions or (B) after exposure to DAC. C Normalized total spectra (Scaffold 5.3.2) for (left) TOPORS or (right) DNMT1 peptides in each replicate. Adjusted P values for TOPORS are from Tukey’s one-way ANOVA; uncorrected P value for DNMT1 is from unpaired T-test; P > 0.05 comparisons not shown. D Summary of enrichment (adjusted one-sided P-values) into GO Biological pathways for Ni-NTA captured proteins that were differentially abundant between TOPORS-edited versus control cells for (top) vehicle-treated or (bottom) DAC-treated conditions. The experiment was performed once. Source data are provided as a Source Data file.
Fig. 9
Fig. 9. SUMOylation blockade synergizes with HMAs in MDS and AML.
A ZIP synergy scores (with 95% CI) for combinatorial drug testing in MDS-L and AML lines determined by SynergyFinder. n = 88 drug combinations for MDS-L, Kasumi-1 and TF-1. n = 64 (AZA) or n = 66 (DAC) drug combinations for MOLM-13. The experiment was performed once. B, C Survival of polyclonally gene-edited MDS-L cells in 96-well plates in response to (B) AZA ± 0.1 µM TAK-981 or (C) DAC ± 0.1 µM TAK-981 added daily on days 1–4. TagRFP+ cells were counted on day 5 and normalized to vehicle counts (±SD), with n = 3 technical replicate cultures per data point. EC50 values are listed in Table S3. The experiment was performed once. D Mean fluorescence intensity ±SD of anti-γH2AX staining by FACS of fixed/permeabilized polyclonally gene-edited MDS-L cells drug-treated as in B, C; n = 3 biological replicates per group. Adjusted P values are from Tukey’s one-way ANOVA; only comparisons ±TAK-981 are shown. The experiment was performed once. E Mean cell cycle distributions ±SD for the same cultures as D (n = 3 biological replicates per treatment); Adjusted P values for fraction in G1 are from Tukey’s one-way ANOVA; only comparisons ±TAK-981 shown. F Event-free survival of non-irradiated MISTRG engrafted i.v. with MOLM-13 cells. Mice were sex and IVIS flux rank randomized in cohorts of 4 into treatment groups on day 10 (n = 7 mice for vehicle, AZA and AZA + TAK-981 groups; n = 6 mice for TAK-981 group), then drug treatments (20 mg/kg TAK-981 i.p., 0.6 mg/kg AZA s.c.) commenced on day 11. P values (one degree of freedom) from Gehan-Breslow-Wilcoxon tests; P > 0.05 comparisons not shown. G, H Expansion of AML PDX (top), and survival of drug-treated MISTRG PDX hosts (bottom). G Non-irradiated MISTRG mice were injected with 4 × 106 AML-16 PDX cells i.v., or (H) sub-lethally irradiated MISTRG mice were injected with 1.25 × 106 AML-5 PDX cells i.v. PDX-injected mice were then bled at approximately weekly intervals. The mice were randomized in sex and weight ranked cohorts of 4 into treatment groups on day 10 or 11 (AML-16: n = 6 mice per treatment group. AML-5: n = 6 mice for vehicle and AZA + TAK-981 groups; n = 5 mice for AZA and TAK-981 groups), then treated with drugs (20 mg/kg TAK-981 i.p., 0.6 mg/kg AZA s.c.) starting day 11 or 12. Event-free survival was time to reach 25% engraftment of huCD45+CD33+ cells in peripheral blood (as indicated by broken y-axes in the spaghetti plots). P values (one degree of freedom) from Gehan-Breslow-Wilcoxon tests; P > 0.05 comparisons not shown. Source data are provided as a Source Data file.

References

    1. Fenaux, P. et al. Efficacy of azacitidine compared with that of conventional care regimens in the treatment of higher-risk myelodysplastic syndromes: a randomised, open-label, phase III study. Lancet Oncol.10, 223–232 (2009). 10.1016/S1470-2045(09)70003-8 - DOI - PMC - PubMed
    1. Prébet, T. et al. Outcome of high-risk myelodysplastic syndrome after azacitidine treatment. Fail. J. Clin. Oncol.29, 3322–3327 (2011).10.1200/JCO.2011.35.8135 - DOI - PMC - PubMed
    1. Saunthararajah, Y. et al. Evaluation of noncytotoxic DNMT1-depleting therapy in patients with myelodysplastic syndromes. J. Clin. Invest.125, 1043–1055 (2015). 10.1172/JCI78789 - DOI - PMC - PubMed
    1. Steensma, D. P. et al. Multicenter study of decitabine administered daily for 5 days every 4 weeks to adults with myelodysplastic syndromes: the alternative dosing for outpatient treatment (ADOPT). trial J. Clin. Oncol.27, 3842–3848 (2009). 10.1200/JCO.2008.19.6550 - DOI - PMC - PubMed
    1. Gu, X. et al. Decitabine- and 5-azacytidine resistance emerges from adaptive responses of the pyrimidine metabolism network. Leukemia35, 1023–1036 (2020). 10.1038/s41375-020-1003-x - DOI - PMC - PubMed

MeSH terms

Substances