. 2024 Aug 28;15(1):7414.
doi: 10.1038/s41467-024-51450-2.

Convergent alterations in the tumor microenvironment of MYC-driven human and murine prostate cancer

Affiliations

Convergent alterations in the tumor microenvironment of MYC-driven human and murine prostate cancer

Mindy K Graham et al. Nat Commun. .

Abstract

How prostate cancer cells and their precursors mediate changes in the tumor microenvironment (TME) to drive prostate cancer progression is unclear, in part due to the inability to longitudinally study the disease evolution in human tissues. To overcome this limitation, we perform extensive single-cell RNA-sequencing (scRNA-seq) and molecular pathology of the comparative biology between human prostate cancer and key stages in the disease evolution of a genetically engineered mouse model (GEMM) of prostate cancer. Our studies of human tissues reveal that cancer cell-intrinsic activation of MYC signaling is a common denominator across the well-known molecular and pathological heterogeneity of human prostate cancer. Cell communication network and pathway analyses in GEMMs show that MYC oncogene-expressing neoplastic cells, directly and indirectly, reprogram the TME during carcinogenesis, leading to a convergence of cell state alterations in neighboring epithelial, immune, and fibroblast cell types that parallel key findings in human prostate cancer.


Conflict of interest statement

The authors declare no competing interests.

Figures

Fig. 1
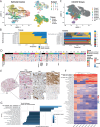
Fig. 1. Single-cell RNA sequencing (scRNA-seq) of prostatectomy tissues collected from patients diagnosed with primary prostate cancer.
A For each prostatectomy (n = 10), tissue punches were collected from each zone of the prostate as well as the tumor site (4 punches per subject). For each tissue punch, part of the tissue was processed for scRNA-seq from freshly dissociated cells, and the remaining half was frozen and sectioned for histology, IHC, and in situ hybridization. Schematic created in Biorender.com. Panel A created with BioRender.com released under a Creative Commons Attribution-NonCommercial-NoDerivs 4.0 International license. B) Representative examples of hematoxylin and eosin (H&E) staining (first two column panels) and immunohitostical PIN4 staining (third column panel) of fresh frozen peripheral zone tissue punches that were benign enriched (n = 10) or cancer enriched (n = 10). Brown marks tumor protein P63 (TP63) and high molecular weight cytokeratin expressed in basal epithelial cells. Red marks alpha-methylacyl-CoA racemase (AMACR), which is expressed in carcinoma and prostatic intraepithelial neoplasia (PIN). For 1x magnification, scale bar indicates 2.5 mm. For 10x magnification, scale bar indicates 200 μM. C Dimensionality reduction (uniform manifold approximation and projection, UMAP) and clustering analysis of scRNA-seq libraries from peripheral zone (PZ) tissue showed cells clustering by recognized cell types (n = 110,715 cells, 18 samples). Subject and cancer-enriched zones of luminal cells suggest inter-individual and intra-tumor heterogeneity in cancer cells. D Heatmap of cell type marker genes show cluster-specific expression.
Fig. 2
Fig. 2. Prostate cancer inter-individual and intra-tumor heterogeneity.
A Epithelial clusters were subsetted, and dimensionality reduction (UMAP) and clustering analysis were repeated (n = 78,621 cells, 18 samples). Benign and cancer cells clustered separately. B Stacked bar plots showing the proportion of cells for each cluster that are from (left panel) benign or cancer-enriched libraries and (right panel) which subject (1-10). C UMAP indicating cells from inferred copy number variation (InferCNV) analysis harboring cancer-associated mutations by subject. D Heatmap from inferCNV analysis of cancer cells from Subject 2 indicating regions with inferred CNV gain (red) and loss (blue). Cancer subgroup A shows 10q loss, while the remaining subgroups show 10q is intact, suggesting heterogeneous loss of PTEN (black box). E Example of intra-tumor heterogeneity from Subject 2. Immunohistochemical for frozen sections for PIN4, ERG, and PTEN staining shows cancer cells in top panels are negative for ERG and positive for PTEN. In contrast, lower panels show another group of cancer cells that are ERG-positive but PTEN-negative. Staining was performed across 39 tissue punches, with five specifically from Subject 2. For 2x magnification, scale bar indicates 2 mm. For 10x magnification, scale bar indicates 200 μM. F Heatmap of normalized enrichment scores (NES) from gene set enrichment analysis (GSEA) of Hallmark collection and “Dang MYC targets up gene set” comparing each cancer cluster with the luminal cluster. G Plot showing NES of top 20 pathways by adjusted p-value, comparing aggregated cancer clusters with the luminal cluster by GSEA. Statistics were derived using the fgsea implementation of a two-tailed GSEA. The adjusted p-value statistic is derived from multiple hypothesis testing using Benjamini-Hochberg procedure across all gene sets considered.
Fig. 3
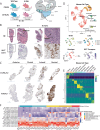
Fig. 3. Single-cell RNA-seq and in situ analysis of Hi-Myc mouse model of prostate cancer.
A Tissue was collected from each prostate lobe (anterior, dorsal, lateral, and ventral) of the MYC-driven mouse model of cancer (Hi-Myc) in both FVB/NJ (n = 2) and C57BL/6 J (N = 2) mouse strains, as well as age-matched wild type animals (FVB/NJ N = 2, C57BL/6 J n = 3). Panel A created with BioRender.com released under a Creative Commons Attribution-NonCommercial-NoDerivs 4.0 International license. B Representative H&E (upper panels) and chromogenic in situ hybridization (CISH, lower panels) staining of human MYC transgene in FFPE mouse prostate tissues from 6-month-old Hi-Myc and age-matched wild-type (WT) mice. Staining was performed across 32 samples. Scale bar used for WT samples indicates 200 μM. Scale bar used for Hi-Myc samples indicates 500 μM, and 200 μM zoomed in. C Representative CISH staining of human MYC transgene in each lobe of Hi-Myc mouse prostate from C57BL/6 J and FVB/NJ mice. Staining was performed across 32 samples. For C57BL/6 J, scale bars indicate 2 mm (Anterior), 1 mm (Dorsal), 500 μM (Lateral) and 1 mm (Ventral). For FVB/NJ, all scale bars indicate 1 mm. D UMAP of mouse scRNA-seq by cell type, strain, lobe, genotype, and MYC transgene expression (n = 58,435 cells, 36 samples). E Heatmap of each cluster and cell type marker gene expression. F Heatmap showing expression of genes positively correlated with MYC transgene expression in luminal cell populations stratified by genotype, strain, and lobe. Genes are grouped by associated biological pathways. The first column shows the scaled expression of the MYC transgene.
Fig. 4
Fig. 4. Cascading changes in a subset of epithelial cells in the tissue microenvironment (TME) of MYC-driven prostate cancer.
A UMAP of mouse prostate scRNA-seq subsetted to epithelial clusters (n = 52,116 cells, 36 samples). B UMAPs of Psca and Ly6d show cluster-enriched gene expression. C Scatter plots showing the proportion of epithelial clusters for each sample. Each dot represents a sample (n = 36) colored by lobe (anterior, dorsal, lateral, ventral). Bar represents the mean cell proportion of samples for each genotype. Statistics were generated by comparing WT (n = 20) and Hi-Myc (n = 16) samples using linear regression analysis (limma) in scRNA-seq with multiple samples (RAISIN) cell proportions test. The adjusted p-value is derived from a two-sided t-test and adjusted for multiple hypothesis testing using Benjamini-Hochberg procedure. D Heatmap showing expression of endogenous Myc, transgene MYC, and Hallmark MYC targets V1 leading edge genes from GSEA for each epithelial cluster. E Representative example of Ly6d CISH staining basal compartment in PIN gland of Hi-Myc FFPE prostate tissue. Staining was performed across 10 samples. For 10x magnification, scale bar indicates 200 μM. For 40x magnification, scale bar indicates 50 μM. F Example of KRT6A CISH staining basal compartment of intraductal carcinoma in human prostate cancer from frozen tissue sections. Staining was performed in 10 tissue punches. Scale bar indicates 500 μM.
Fig. 5
Fig. 5. Signaling among epithelial clusters in TME of MYC-driven prostate cancer.
A Cell communication plot of epithelial clusters from inferred ligand-receptor-transcription factor network analysis (Domino). Nodes represent individual clusters and are scaled based on ligand expression. Edges indicate signaling between two clusters and are weighted based on the strength of signaling. The edge color matches the cluster expressing the ligand. The ligands from the Luminal MYC 1 cluster is marked in yellow, while all other clusters are colored grey to highlight specific interactions from the Luminal MYC 1 cluster to all other epithelial clusters. B Heatmap showing which epithelial clusters express the top ligands targeting receptors expressed on the Reactive Basal cluster from inferred ligand-receptor pair interactions. C Heatmap showing the correlation of transcription factor activity scores (from SCENIC analysis) and receptor expression. Transcription factors were selected based on top activated scores in the Reactive Basal cluster. The receptors represented in this heatmap are known to bind to the top ligands targeting the Reactive Basal cluster. D Expression of downstream targets of the transcription factor interferon response factor 5 (IRF5) in epithelial clusters. E Plot showing NES of top 15 pathways by adjusted p-value. Statistics derived using fgsea implementation of a two-tailed GSEA, and the adjusted p-value from multiple hypothesis testing using Benjamini-Hochberg procedure. Comparisons include Luminal and Luminal MYC 1 clusters (top panel) and Basal and Reactive Basal clusters (bottom panel). Representative immunohistochemical staining in WT and Hi-Myc mouse prostate tissues of F CD3 to mark T cells (40 tissues) and G F4/80 to mark macrophages (36 tissues). In F, the 1x magnification scale bar indicates 1 mm and the 10x magnification scale bar indicates 100 μM. In G, the 1x magnification scale bar indicates 1 mm for WT and 2 mm for Hi-Myc. The 10x magnification scale bar indicates 200 μM. H Heatmaps of top 20 genes upregulated in the Luminal MYC 1 cluster at 6 months and downregulated at 10 months. Genes are grouped by associated gene sets from the GSEA Hallmark collection.
Fig. 6
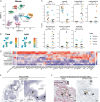
Fig. 6. Immune cell populations enriched in the TME of MYC-driven prostate cancer.
A Immune cell clusters were subsetted from dorsal and lateral lobes of FVB/NJ mice from WT and Hi-Myc at 6 months and 10 months, and dimensionality reduction (UMAP) and clustering analysis were repeated (n = 4,474 cells, 12 samples). B Heatmap of immune cell type marker genes shows cluster-specific expression in merged scRNA-seq data. C Scatter plots showing the proportion of select immune cell populations for each sample (n = 12). Each dot represents a sample colored by genotype and age. Bars represent the mean cell proportion of samples for each group. Statistics were generated by comparing Hi-Myc samples at 6 months (n = 4) and 10 months (n = 2) using RAISIN’s cell proportions test based on linear regression modeling (limma). The adjusted p-value is derived from a two-sided t-test and adjusted for multiple hypothesis testing using Benjamini-Hochberg procedure. D UMAP of human immune cell clusters from prostatectomy scRNA-seq dataset (n = 12,108 cells, 18 samples). E Heatmap of immune cell type marker gene expression of immune cells from prostatectomy samples. Expression of F) regulatory T cell gene signature (IL2RA, FOXP3, CD4, IKZF2, CCR4, CTLA4) and G) TREM2 in human immune cell clusters.
Fig. 7
Fig. 7. Stromal reprogramming in the TME of MYC-driven prostate cancer.
A Immune clusters were subsetted from dorsal and lateral lobes of FVB/NJ mice from WT and Hi-Myc at 6 months and 10 months (n = 6,162 cells, 12 samples). A fibroblast subcluster enriched in Hi-Myc tissue expresses Timp1. B Scatter plots showing the proportion of select stromal cell populations significantly altered in Hi-Myc compared to WT. Each dot represents a sample (n = 12) colored by genotype and age. Bars represent the mean cell proportion of samples for each group. RAISIN’s cell proportions test used to statistically compare WT (n = 6) and Hi-Myc (n = 6) samples. The adjusted p-value is derived from a two-sided t-test and adjusted for multiple hypothesis testing using Benjamini-Hochberg. C Violin plot showing expression of Pdgfra, Timp1, and fibrosis-associated collagens (Col1a1, Col1a2, Col3a1, Col5a2) by genotype (WT and Hi-Myc) and age (6 months and 10 months) in fibroblast cells. D UMAP of human stromal cell clusters (n = 18,837 cells, 18 samples). Right panel shows the expression of the Hi-Myc Fibroblast Timp1 gene signature (TIMP1, MFAP5, SERPINA3, IGF1, SFRP1, MMP2, SERPINF1, COL1A1, COL5A2, COL3A1). E Scatter plot showing proportion of Macrophages Trem2 and Fibroblast Timp1 clusters for each sample with corresponding two-tailed Pearson correlation coefficient and p-value. F Inferred ligand-receptor-transcription factor network analysis (Domino) of epithelial, macrophage, and fibroblast clusters from FVB/NJ aggregated scRNA-seq data. Luminal MYC 1 cluster is marked in red, Macrophages Trem2 cluster is marked in yellow, Fibroblast Timp1 node is marked in black, and all other clusters are colored grey. G Heatmap showing which clusters express the top ligands targeting the Fibroblast Timp1 cluster. H Heatmap showing the correlation of transcription factor activity scores (derived from SCENIC) and receptor expression. Transcription factors were selected based on top activated scores in the Fibroblast Timp1 cluster. Receptors for TNF, PTPRC, CD72, OSM, and TGFB1 are shown.
Fig. 8
Fig. 8. MYC activation in neoplastic cells reprograms the prostate TME.
A MYC activation in luminal epithelial cells leads to the induction of benign Ly6d/Krt6a-expressing epithelial population (Reactive Epithelial cells) in the basal compartment of prostate glands. B At the precursor stage, the TME is pro-inflammatory, with upregulated interferon signaling in both MYC-expressing luminal cells and Reactive Basal cells, and (C) enrichment of various immune cells in the TME, including mast cells, T cells, and Trem2-expressing macrophages. D As MYC-expressing luminal cells progress to invasive carcinoma, there is a pro-inflammatory to immunosuppressive switch with downregulation of inflammatory response pathways and IL6 JAK STAT3 signaling, and enrichment of immunosuppressive cell types, including regulatory T cells (Tregs), myeloid-derived suppressive cells (MDSCs), and Trem2-expressing macrophages. E Secretion of TGFB by Trem2-expressing macrophages activates TGFB signaling and EGR4 transcription factor activity in fibroblasts, resulting in a desmoplastic CAF population expressing Timp1 and reactive-stroma-associated ECM proteins such as collagen. Graphical abstract created in Biorender.com. Figure 8 created with BioRender.com released under a Creative Commons Attribution-NonCommercial-NoDerivs 4.0 International license.

Update of

References

    1. Haffner, M. C. et al. Genomic and phenotypic heterogeneity in prostate cancer. Nat. Rev. Urol.18, 79–92 (2021). 10.1038/s41585-020-00400-w - DOI - PMC - PubMed
    1. Mitchell, T. & Neal, D. E. The genomic evolution of human prostate cancer. Br. J. Cancer113, 193–198 (2015). 10.1038/bjc.2015.234 - DOI - PMC - PubMed
    1. Spratt, D. E., Zumsteg, Z. S., Feng, F. Y. & Tomlins, S. A. Translational and clinical implications of the genetic landscape of prostate cancer. Nat. Rev. Clin. Oncol.13, 597–610 (2016). 10.1038/nrclinonc.2016.76 - DOI - PMC - PubMed
    1. Shen, M. M. & Abate-Shen, C. Molecular genetics of prostate cancer: new prospects for old challenges. Genes Dev.24, 1967–2000 (2010). 10.1101/gad.1965810 - DOI - PMC - PubMed
    1. Sandhu, S. et al. Prostate cancer. Lancet398, 1075–1090 (2021). 10.1016/S0140-6736(21)00950-8 - DOI - PubMed

Substances