. 2024 Aug 28;15(1):7447.
doi: 10.1038/s41467-024-51651-9.

Gut Microbiome Wellness Index 2 enhances health status prediction from gut microbiome taxonomic profiles

Affiliations

Gut Microbiome Wellness Index 2 enhances health status prediction from gut microbiome taxonomic profiles

Daniel Chang et al. Nat Commun. .

Abstract

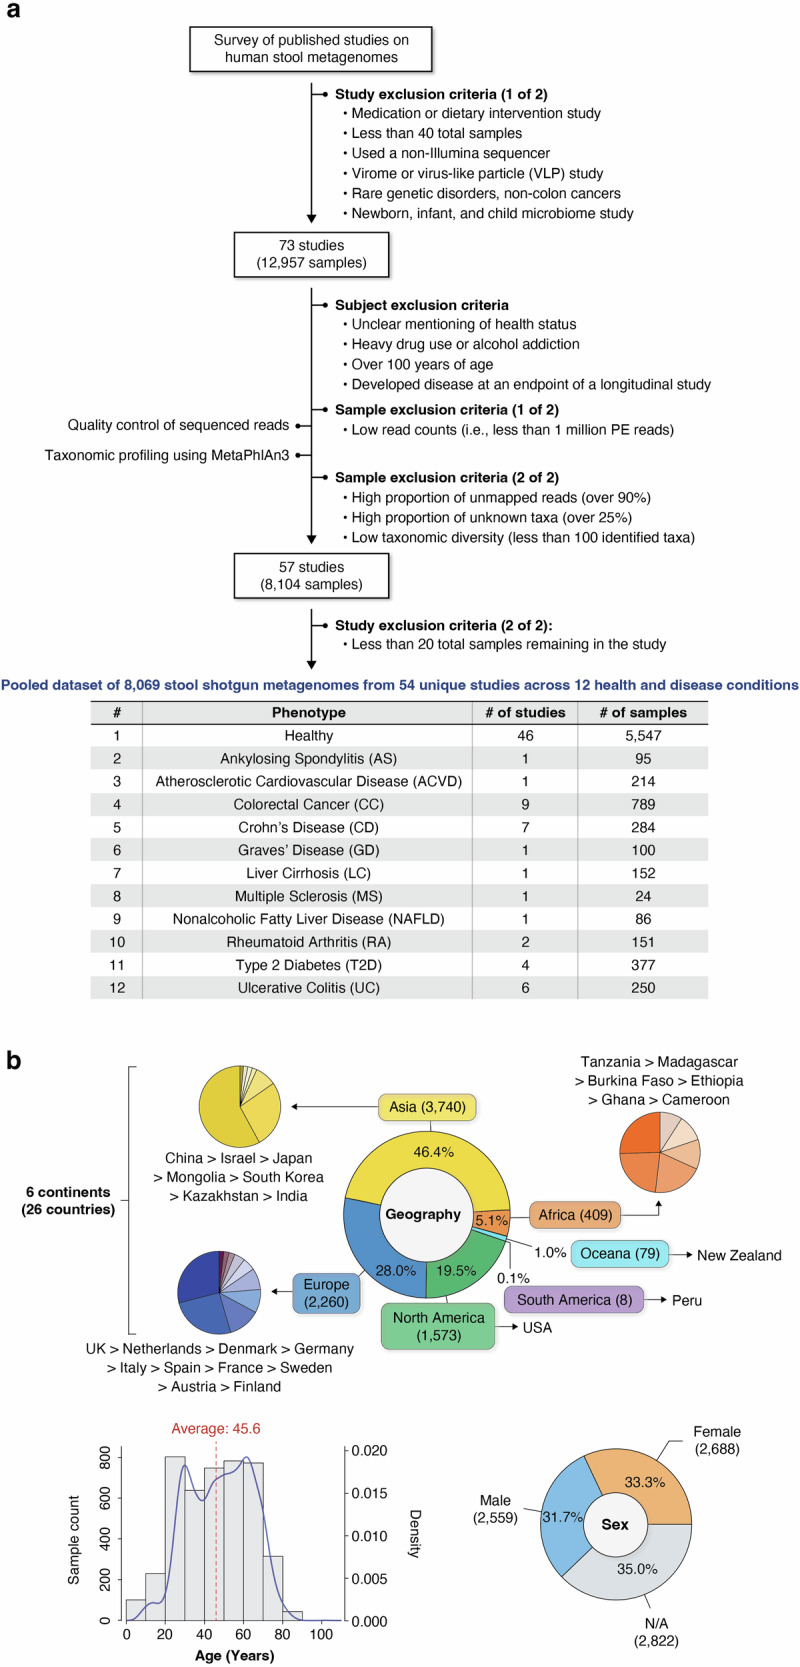
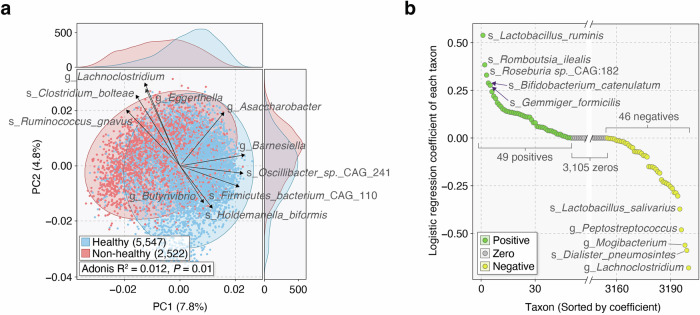
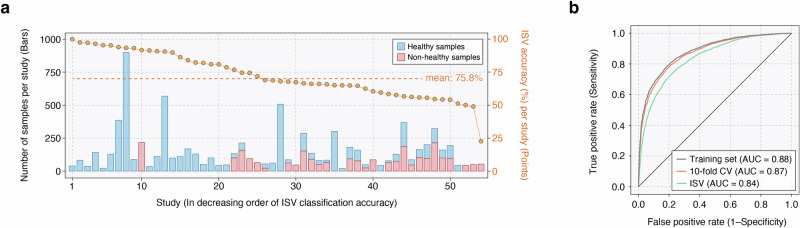
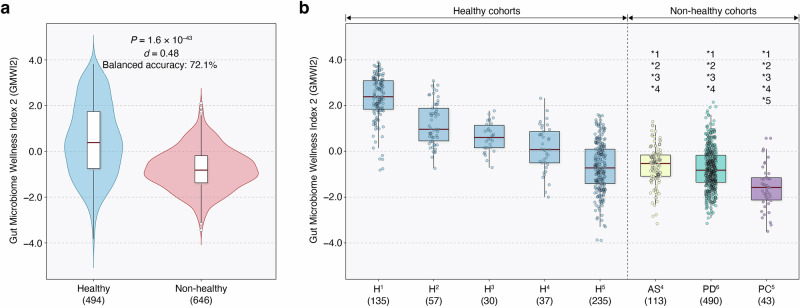
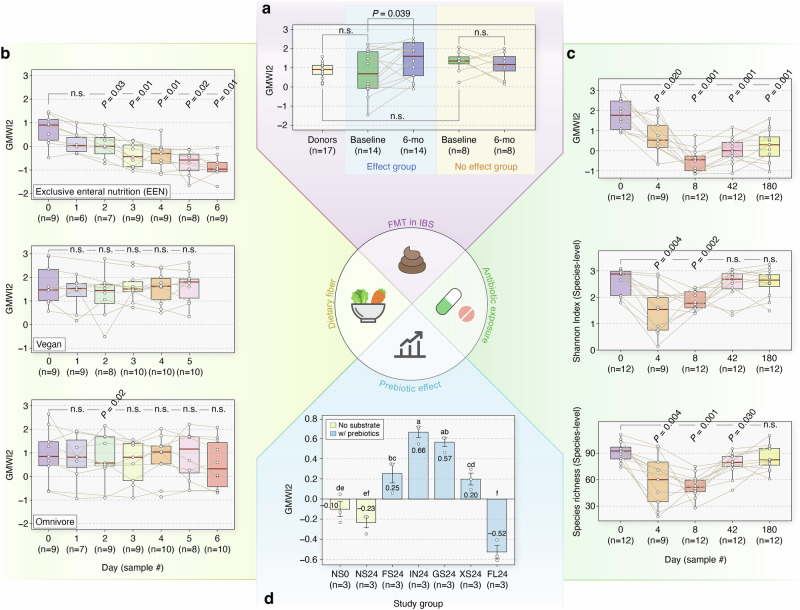
Recent advancements in translational gut microbiome research have revealed its crucial role in shaping predictive healthcare applications. Herein, we introduce the Gut Microbiome Wellness Index 2 (GMWI2), an enhanced version of our original GMWI prototype, designed as a standardized disease-agnostic health status indicator based on gut microbiome taxonomic profiles. Our analysis involves pooling existing 8069 stool shotgun metagenomes from 54 published studies across a global demographic landscape (spanning 26 countries and six continents) to identify gut taxonomic signals linked to disease presence or absence. GMWI2 achieves a cross-validation balanced accuracy of 80% in distinguishing healthy (no disease) from non-healthy (diseased) individuals and surpasses 90% accuracy for samples with higher confidence (i.e., outside the "reject option"). This performance exceeds that of the original GMWI model and traditional species-level α-diversity indices, indicating a more robust gut microbiome signature for differentiating between healthy and non-healthy phenotypes across multiple diseases. When assessed through inter-study validation and external validation cohorts, GMWI2 maintains an average accuracy of nearly 75%. Furthermore, by reevaluating previously published datasets, GMWI2 offers new insights into the effects of diet, antibiotic exposure, and fecal microbiota transplantation on gut health. Available as an open-source command-line tool, GMWI2 represents a timely, pivotal resource for evaluating health using an individual's unique gut microbial composition.


Conflict of interest statement

The authors declare no competing interests.

Figures

Fig. 1
Fig. 1. Conducting a pooled analysis of stool metagenomes across multiple health and disease conditions from a diverse global representation.
a A survey was conducted in PubMed and Google Scholar to search for published studies with publicly available human stool shotgun metagenome (gut microbiome) samples from healthy (disease-free) and non-healthy (diseased) individuals. The initial collection of stool metagenomes consisted of 12957 samples from 73 independent studies. All raw metagenome samples (.fastq files) were downloaded and reprocessed uniformly using identical bioinformatics methods. After quality control of sequenced reads, taxonomic profiling was performed using MetaPhlAn3. Studies and samples were removed based on several exclusion criteria. Finally, a total of 8069 samples (5547 and 2522 metagenomes from healthy and non-healthy individuals, respectively) from 54 studies ranging across healthy and 11 non-healthy phenotypes were assembled into a pooled metagenome dataset for downstream analyses. b Demographic summary of the study subjects whose metagenome samples were included in the pooled dataset. Subject demographics, as reported in the original studies, include country of origin (n = 8069), age (n = 4670), and sex (n = 5247).
Fig. 2
Fig. 2. Gut microbiome taxonomic profiles of healthy and non-healthy individuals inform a Lasso-penalized logistic regression classification model.
a Principal component analysis (PCA) of gut microbiome profiles. Significant differences in distributions between healthy (disease-free) (blue, n = 5547) and non-healthy (diseased) (red, n = 2522) groups were observed (P < 0.05, PERMANOVA). Ellipses represent 95% confidence regions. The loading vectors with the top 10 highest PC1 and PC2 magnitudes are shown. b Coefficient values for the Lasso-penalized logistic regression model. The model includes 49 taxa with positive coefficients, 3105 taxa with zero coefficients, and 46 taxa with negative coefficients.
Fig. 3
Fig. 3. Enhanced classification of healthy and non-healthy stool metagenomes using Gut Microbiome Wellness Index 2 (GMWI2).
a GMWI2 best stratifies healthy (n = 5547) and non-healthy (n = 2522) groups compared to GMWI and α-diversity indices (P-values from the two-sided Mann–Whitney U test; d, Cliff’s Delta effect size). Balanced accuracies on the training set are shown for GMWI2 and GMWI. b The healthy group (blue, far left) exhibits significantly higher GMWI2 scores than all 11 non-healthy phenotypes (P-values from the two-sided Mann–Whitney U test). Non-healthy phenotypes include multiple sclerosis (MS, n = 24), ankylosing spondylitis (AS, n = 95), rheumatoid arthritis (RA, n = 151), ulcerative colitis (UC, n = 250), nonalcoholic fatty liver disease (NAFLD, n = 86), type 2 diabetes (T2D, n = 377), Crohn’s disease (CD, n = 284), Graves’ disease (GD, n = 100), colorectal cancer (CC, n = 789), liver cirrhosis (LC, n = 152), and atherosclerotic cardiovascular disease (ACVD, n = 214). c Bins of GMWI2 and GMWI scores (x-axis). The height of the black and gray bars indicate metagenome sample counts in each GMWI2 and GMWI bin, respectively (y-axis, left). Points represent the proportion of samples in each GMWI2 or GMWI bin corresponding to actual healthy and non-healthy individuals (y-axis, right). d Increased magnitude cutoffs result in improved classification performance of GMWI2, showing increasing training set balanced accuracy (blue, y-axis, left) at the expense of decreasing retained samples (orange, y-axis, right). e Classification performances of GMWI and GMWI2 in distinguishing healthy and non-healthy groups. Accuracies (y-axis, left) are depicted for both groups on the training set, leave-one-out cross-validation (LOOCV), and 10-fold CV, using varying magnitude cutoffs (0, 0.5, 1.0) of GMWI and GMWI2 scores. Balanced accuracies are shown between the blue and pink bars, which represent healthy and non-healthy groups, respectively. Orange points represent the proportion of retained samples (y-axis, right) for the corresponding index magnitude cutoff. For 10-fold CV, repeated random sub-sampling was performed ten times, and the average results are displayed. Standard box-and-whisker plots (i.e., center line, median; box limits, upper and lower quartiles; whiskers, 1.5× interquartile range; points, outliers) are used to depict groups of numerical data in (a, b).
Fig. 4
Fig. 4. Inter-study validation (ISV) shows effective generalization of GMWI2 across diverse study populations.
a Classification accuracy on each excluded study in ISV is displayed by gold points (y-axis, right). The studies on the x-axis are rank-ordered based on either accuracy for a single phenotype (healthy or non-healthy) or balanced accuracy in the case of both phenotypes. The stacked bars illustrate the number of healthy (blue) and non-healthy (pink) stool metagenome samples in each study (y-axis, left). b Receiver operating characteristic curves for classification performance in distinguishing healthy and non-healthy phenotypes on the training set, 10-fold CV, and ISV.
Fig. 5
Fig. 5. GMWI2 performance on healthy and non-healthy external validation cohorts.
a GMWI2 scores from healthy (494 samples) and non-healthy (646 samples) groups. Scores are significantly higher in the healthy group compared to the non-healthy group (P = 1.6 × 10–43; two-sided Mann–Whitney U test). The effect size is represented by Cliff’s Delta (d = 0.48). The balanced accuracy of the classification is 72.1%. b GMWI2 scores across five healthy (H1–H5) and three non-healthy cohorts (AS4 ankylosing spondylitis, PD6 Parkinson’s disease, PC5 pancreatic cancer). The superscript numbers adjacent to phenotype abbreviations correspond to specific studies detailed in Supplementary Data 6. Asterisk (*) indicates significantly higher score in a healthy cohort compared to the corresponding non-healthy cohort (P < 0.01, two-sided Mann–Whitney U test. Exact P-values provided in Supplementary Data 6). Numbers next to each asterisk refer to the healthy cohort compared against each non-healthy condition. Sample size of each group or cohort are shown in parentheses. Standard box-and-whisker plots (i.e., center line, median; box limits, upper and lower quartiles; whiskers, 1.5× interquartile range; points, outliers in (a) or individual GMWI2 scores in (b)) are used to depict groups of numerical data.
Fig. 6
Fig. 6. Reanalysis of existing longitudinal gut microbiome studies with GMWI2.
a Changes in GMWI2 in patients with irritable bowel syndrome observed six months (6-mo) after undergoing fecal microbiota transplantation. Only subjects experiencing symptom relief (“Effect” group) displayed a significant increase in GMWI2 (P = 0.039, one-sided Wilcoxon signed-rank test). n, number of FMT donor samples (17 total samples from two healthy donors) or number of FMT recipients. b GMWI2 scores for dietary groups (EEN, Vegan, and Omnivore) at baseline and at the first 5–6 days of dietary intervention. The EEN group showed significant changes in GMWI2, with values significantly decreased by day 2 and thereafter (P < 0.05, two-sided Wilcoxon signed-rank test). No significant change in GMWI2 was observed for the Omnivore and Vegan groups compared to baseline. n, number of unique individuals who each provided a stool sample per time point. c GMWI2, Shannon Index, and species richness before and after antibiotic intervention. Despite recovery in Shannon Index and species richness at day 42 and day 180, respectively, GMWI2 remained significantly lower compared to day 0, suggesting incomplete gut microbiome recovery even after ~6 months (P < 0.05, two-sided Wilcoxon signed-rank test). n, number of unique individuals who each provided a stool sample per time point. d GMWI2 of gut microbial communities after 24-h in vitro fecal fermentation with five different prebiotic oligosaccharides. The experiment was conducted in triplicates for each study group. The height of the bars represents the mean GMWI2 (numbers inside the solid bars), and error bars indicate the standard deviation from the mean. Points represent individual triplicate samples. Different small letters above the bars denote groups with significant differences in GMWI2 as determined by Tukey’s HSD test (P < 0.05). Control groups: NS0, no substrate addition at 0 h; NS24, no substrate for 24 h. Prebiotic groups: FS24 fructooligosaccharide, IN24 inulin, GS24 galactooligosaccharide, XS24 xylooligosaccharide, FL24 2’-fucosyllactose. Standard box-and-whisker plots (i.e., center line, median; box limits, upper and lower quartiles; whiskers, 1.5× interquartile range; points, individual GMWI2 scores or α-diversity values) are used to depict groups of numerical data in (ac).

Update of

References

    1. Schirmer, M. et al. Linking the human gut microbiome to inflammatory cytokine production capacity. Cell167, 1125–1136.e8 (2016). 10.1016/j.cell.2016.10.020 - DOI - PMC - PubMed
    1. Halfvarson, J. et al. Dynamics of the human gut microbiome in inflammatory bowel disease. Nat. Microbiol.2, 1–7 (2017). 10.1038/nmicrobiol.2017.4 - DOI - PMC - PubMed
    1. Lloyd-Price, J. et al. Multi-omics of the gut microbial ecosystem in inflammatory bowel diseases. Nature569, 655–662 (2019). 10.1038/s41586-019-1237-9 - DOI - PMC - PubMed
    1. Wirbel, J. et al. Meta-analysis of fecal metagenomes reveals global microbial signatures that are specific for colorectal cancer. Nat. Med.25, 679–689 (2019). 10.1038/s41591-019-0406-6 - DOI - PMC - PubMed
    1. Mars, R. A. T. et al. Longitudinal multi-omics reveals subset-specific mechanisms underlying irritable bowel syndrome. Cell183, 1137–1140 (2020). 10.1016/j.cell.2020.10.040 - DOI - PubMed

LinkOut - more resources