. 2024 Aug 28;14(1):20033.
doi: 10.1038/s41598-024-68401-y.

Single-cell transcriptomic analysis of retinal immune regulation and blood-retinal barrier function during experimental autoimmune uveitis

Affiliations

Single-cell transcriptomic analysis of retinal immune regulation and blood-retinal barrier function during experimental autoimmune uveitis

Joel Quinn et al. Sci Rep. .

Abstract

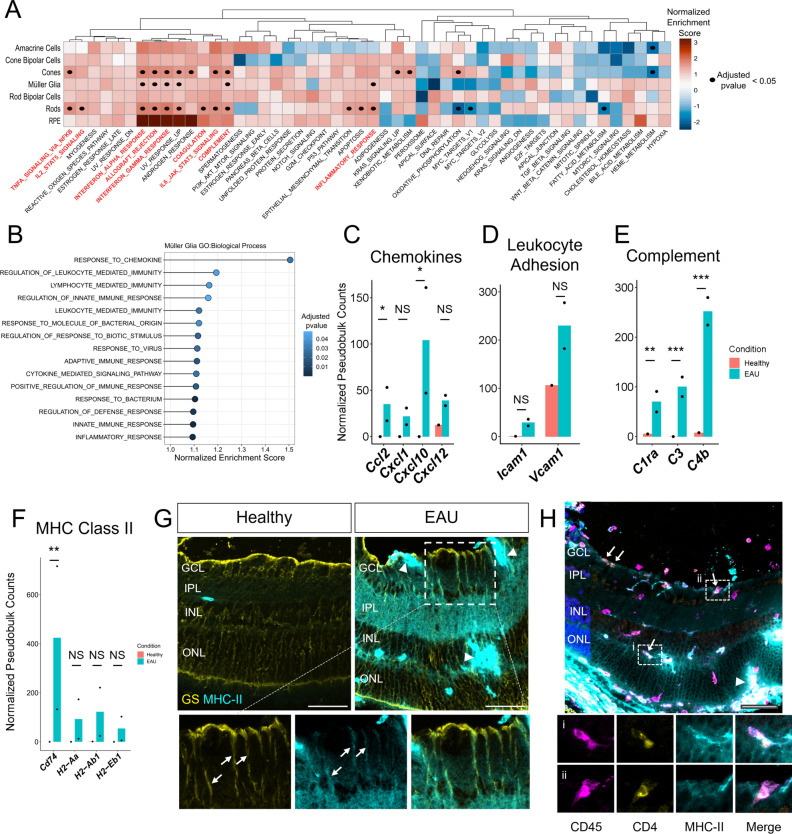
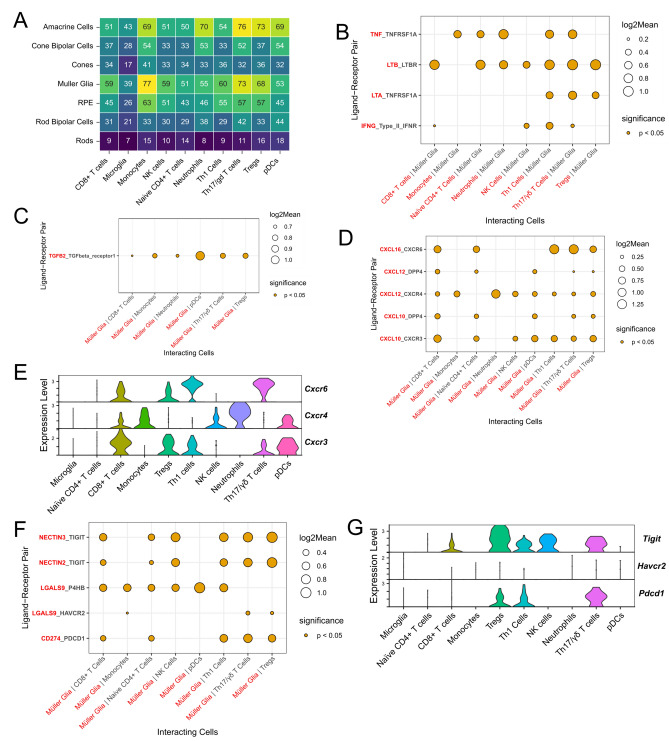
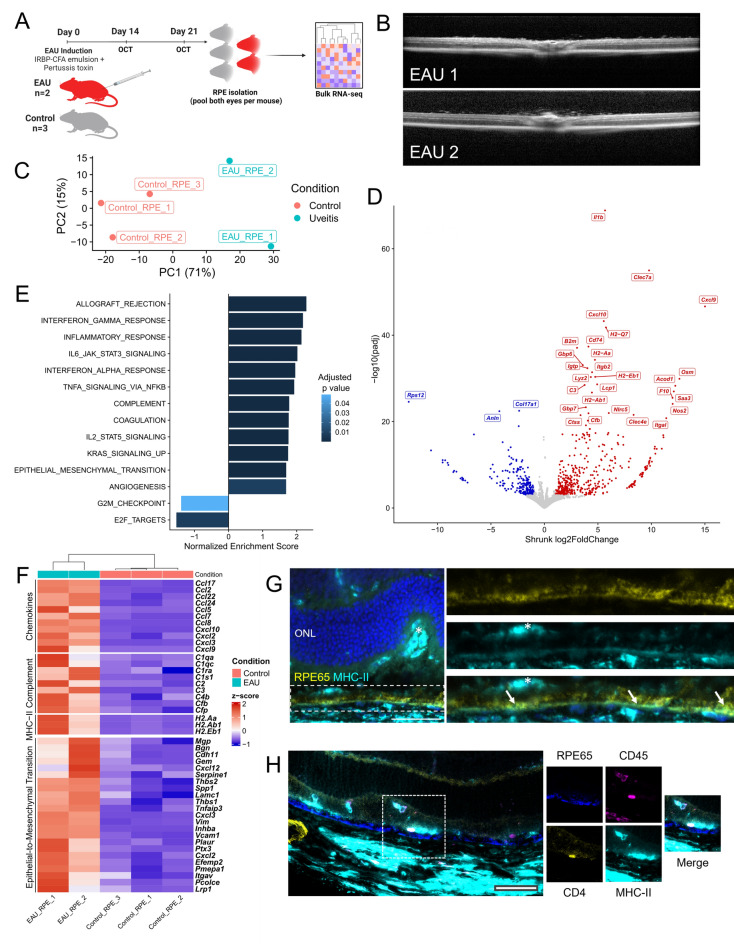
Uveitis is characterised by breakdown of the blood-retinal barrier (BRB), allowing infiltration of immune cells that mediate intraocular inflammation, which can lead to irreversible damage of the neuroretina and the loss of sight. Treatment of uveitis relies heavily on corticosteroids and systemic immunosuppression due to limited understanding of disease pathogenesis. We performed single-cell RNA-sequencing of retinas, as well as bulk RNA-sequencing of retinal pigment epithelial (RPE) cells from mice with experimental autoimmune uveitis (EAU) versus healthy control. This revealed that the Th1/Th17-driven disease induced strong gene expression changes in response to inflammation in rods, cones, Müller glia and RPE. In particular, Müller glia and RPE cells were found to upregulate expression of chemokines, complement factors, leukocyte adhesion molecules and MHC class II, thus highlighting their contributions to immune cell recruitment and antigen presentation at the inner and outer BRB, respectively. Additionally, ligand-receptor interaction analysis with CellPhoneDB revealed key interactions between Müller glia and T cell / natural killer cell subsets via chemokines, galectin-9 to P4HB/TIM-3, PD-L1 to PD-1, and nectin-2/3 to TIGIT signalling axes. Our findings elucidate mechanisms contributing to breakdown of retinal immune privilege during uveitis and identify novel targets for therapeutic interventions.


Conflict of interest statement

The authors declare no conflict of interests. The views expressed are those of the authors and not necessarily those of the Wellcome Trust, MRC or NIHR.

Figures

Figure 1
Figure 1
Single-cell transcriptomic analysis of experimental autoimmune uveitis (EAU) versus healthy retinas in mice. (A) Study outline. 1 retina per mouse from 2 mice with grade 2 EAU and 1 control littermate mouse (all females) were dissociated 21 days post-immunisation. (B) In vivo optical coherence tomography (OCT) of the mouse retinas immediately prior to tissue harvesting for scRNA-seq analysis. Arrows indicate vitreous immune cells; arrowheads indicate subretinal immune infiltrates associated with structural disruption of retinal layers. (C) Immunostaining of healthy and EAU retinas for CD45 (in red), showing infiltrating immune cells on the inner retinal surface and within the outer retina in EAU. Asterisk (*) indicates an aggregate of immune cells, likely within an inflamed deep capillary vessel, in the outer plexiform layer (OPL). Arrow indicates immune cells in the vitreous. Arrowhead indicates subretinal immune cells. GCL, ganglion cell layer; IPL, inner plexiform layer; INL, inner nuclear layer; ONL, outer nuclear layer; IS/OS, inner segment-outer segment junction of photoreceptors. (D) Integrated UMAP of 11,516 cells from 1 healthy and 2 EAU retinas with annotated cell types. (E) Dot plot of marker genes used to identify each cell type.
Figure 2
Figure 2
Single-cell analysis of infiltrating immune cells in inflamed retinas. (A) UMAP of the 548 immune cells captured in the two retinas with autoimmune uveitis. (B) Dot plot of selected immune cell marker genes. Black arrow highlights Tcrg-C1 as a marker in Th17/γδ T cells. (C) Stacked violin plots showing expression of all TCR γ genes detected in the dataset. Greater expression of Tcrg-C1 was present in the Th17/γδ cluster, suggesting γδ T cells are significant IL-17 producing cells in EAU retinas. (D) IHC of EAU retinas confirming presence of intraretinal CD3+ TCR γ/δ+ T cells (inset). Scale bar = 50 μm.
Figure 3
Figure 3
Activation of inflammation-associated gene sets in retinal cells during experimental autoimmune uveitis. (A) Summary heatmap of Gene Set Enrichment Analysis (GSEA) using the Molecular Signatures Database (MSigDB) Hallmark Gene Sets. The Müller glia, rods and cones, in particular, demonstrate significant upregulation of a range of proinflammatory gene sets, as denoted by black dots (adjusted p value < 0.05). Inflammation-associated gene sets that were significantly upregulated in at least one retinal cell type are highlighted in red. (B) Gene Ontology (GO) Biological Process gene sets that were significantly enriched in Müller glia. Leading edge analysis of significantly enriched gene sets shows upregulation of (C) chemokines, (D) complement factors/receptors, (E) leukocyte adhesion molecules and (F) MHC Class II genes. (ns) Not significant, * p < 0.05, ** p < 0.01, *** p < 0.001, DESeq2 Wald test. (G) Validation of MHC Class II protein expression by Müller glia in inflamed retina of EAU mice. Glutamine synthetase (GS) staining of Müller glia in yellow, MHC-II in cyan, scale bar = 50 μm. Inset images highlight an area showing co-staining of GS and MHC-II along Müller glia processes (arrows). Bright patches of confluent MHC-IIhigh only staining (arrow heads) likely represent infiltrating blood-derived professional antigen presenting cells (APCs). (H) Immunostaining of EAU retina for CD45, CD4 and MHC-II. Four arrows indicate areas where CD45+ CD4+ T cells colocalize with CD45- MHC-II+ regions (corresponding to Müller glia processes as seen in panel (G)). These colocalizations appear distinct from the interaction between CD45+ CD4+ T cells and the MHC-IIhigh only blood-derived professional APCs (single arrowhead). Insets (i) and (ii): colocalization between CD45+ CD4+ T cells and CD45- MHC-II+ processes in the outer plexiform layer and ganglion cell layer, respectively, suggestive of antigen presentation by the Müller glia.
Figure 4
Figure 4
Immune ligand-receptor interactions between retinal cells and infiltrating immune cells. (A) Summary heatmap of ligand-receptor interactions between retinal cells and immune cells during experimental autoimmune uveitis using CellPhoneDB. (B) Extensive cytokine signalling between infiltrating lymphocytes and Müller glia was detected. Presence of a dot represents a significant interaction between two cell types, while the size of the dot is proportional to the mean expression level of the ligand-receptor pair. Ligands and ligand-expressing lymphocyte labels are coloured red, while receptors and receptor-expressing Müller glia are in black. IFN-γ produced by CD4 + T cells and NK cells is predicted to interact with the IFN-γ receptor expressed on Müller glia. CD4 + T cells also produce TNF-α and LT-α which may interact with their cognate receptors on Müller glia. (C) TGFB2 expressed by Muller glia was predicted to interact with TGFB receptors on CD8 + T cells, monocytes, neutrophils, pDCs, Th17/γδ T cells and Tregs. (D) Predicted chemokine-receptor interactions between Müller glia and lymphocytes. CXCL10, CXCL12 and CXCL16 expressed by Müller glia are predicted to interact with their receptors expressed by various immune cells. (E) Violin plots depicting expression of Cxcr6, Cxcr4 and Cxcr3 on immune cell subsets. Cxcr6 was most highly expressed on Th1 and Th17/γδ T cells. Although Cxcr4 was expressed on several immune cell subsets, highest expression appeared to be on monocytes and neutrophils. Cxcr3 was most highly expressed on CD8 + T cells, Tregs, Th1 cells and pDCs. (F) Immune checkpoint ligand-receptor interactions between Müller glia and lymphocytes. Galectin-9 (Lgals9) expressed by Müller glia is predicted to interact with a several range of receptors on immune cells, including TIM-3 (Havcr2) expressed on Tregs. PD-L1 (Cd274) expression is upregulated in Müller glia during EAU and predicted to interact with its receptor PD-1 expressed on T cells. Nectin-2 and Nectin-3 expressed by Müller glia are also predicted to interact with their receptor TIGIT expressed on T cells and NK cells. (G) Violin plots showing expression of the checkpoint receptors Tigit, Havcr2 and Pdcd1. Tigit was most strongly expressed by T and NK cell subsets, while Pdcd1 showed higher expression on Tregs, Th1 and Th17/γδ T cells. Havcr2 expression by comparison was lower across immune cell subsets.
Figure 5
Figure 5
Bulk RNA-seq and immunohistochemical analysis of the retinal pigment epithelium (RPE) during homeostasis and experimental autoimmune uveitis. (A) Experimental outline of bulk RNA-seq of EAU RPE, with cells harvested from eyecups at 21 days post-immunisation. (B) OCT of eyes from each of two mice that provided the EAU RPE samples showing characteristic features of posterior uveitis. (C) PCA plot of analysed samples showing variation between samples is primarily by condition. (D) Volcano plot showing the 824 significantly differentially expressed genes from DESeq2 analysis. Top 30 differentially expressed genes are labelled. (E) Preranked GSEA results of EAU RPE showing significantly enriched gene sets from the Molecular Signatures Database Hallmark gene sets. (F) Heatmap of leading edge genes from inflammation-associated gene sets. All displayed genes are significantly differentially expressed between EAU and healthy RPE (p < 0.05, DESeq2 Wald Test). Inflammation-associated leading edge genes showed upregulation of chemokines, complement factors and MHC-II genes. Leading edge analysis of the Epithelial-to-Mesenchymal Transition (EMT) signature genes included extracellular matrix proteins and matrix metalloproteinases (Mgp, Bgn, Pcolce, Serpine1), as well as typical transition markers (Vim, Inhba) and adhesion molecules (Vcam1, Itgav). (G) Immunohistochemistry co-staining of RPE65 (yellow) and MHC-II (cyan) in EAU retina. Left, Hoechst staining of photoreceptor nuclei (blue); asterisk (*) highlights a cluster of infiltrating subretinal MHC-IIhi immune cells. Dashed box denotes the RPE layer. Right top, RPE65 staining of RPE cells. Right middle, MHC-II staining predominantly at the basal surface of the RPE layer; asterisk indicating MHC-IIhi immune cell located on apical side of RPE. Right bottom, merge of RPE65 and MHC-II staining with arrows indicating regions of strongest co-staining, suggestive of expression of MHC-II by the RPE during retinal inflammation. (H) Inset: an infiltrating (subretinal) CD45 + CD4 + T cell on the apical surface of the RPE layer. However, we did not identify overlap between MHC-II and RPE65 staining, suggesting this was not RPE-mediated. No evidence of colocalization of CD45+ CD4+ cells with RPE at the basal surface was found in analyzed sections. Scale bars = 50 μm.

References

    1. Burkholder, B. M. & Jabs, D. A. Uveitis for the non-ophthalmologist. BMJ372, m4979 (2021). 10.1136/bmj.m4979 - DOI - PubMed
    1. Forrester, J. V., Kuffova, L. & Dick, A. D. Autoimmunity, autoinflammation, and infection in uveitis. Am. J. Ophthalmol.189, 77–85 (2018). 10.1016/j.ajo.2018.02.019 - DOI - PubMed
    1. Sharma, S. M., Fu, D. J. & Xue, K. A review of the landscape of targeted immunomodulatory therapies for non-infectious uveitis. Ophthalmol. Ther.7, 1 (2018). 10.1007/s40123-017-0115-5 - DOI - PMC - PubMed
    1. Fields, M. A., Del Priore, L. V., Adelman, R. A. & Rizzolo, L. J. Interactions of the choroid, Bruch’s membrane, retinal pigment epithelium, and neurosensory retina collaborate to form the outer blood-retinal-barrier. Prog. Retin. Eye Res.76, 100803 (2020). 10.1016/j.preteyeres.2019.100803 - DOI - PubMed
    1. Cunha-Vaz, J., Bernardes, R. & Lobo, C. Blood-retinal barrier. Eur. J. Ophthalmol.21, 3–9 (2011).10.5301/EJO.2010.6049 - DOI - PubMed

MeSH terms