. 2024 Aug 28;15(1):7458.
doi: 10.1038/s41467-024-51901-w.

P53-dependent hypusination of eIF5A affects mitochondrial translation and senescence immune surveillance

Affiliations

P53-dependent hypusination of eIF5A affects mitochondrial translation and senescence immune surveillance

Xiangli Jiang et al. Nat Commun. .

Abstract

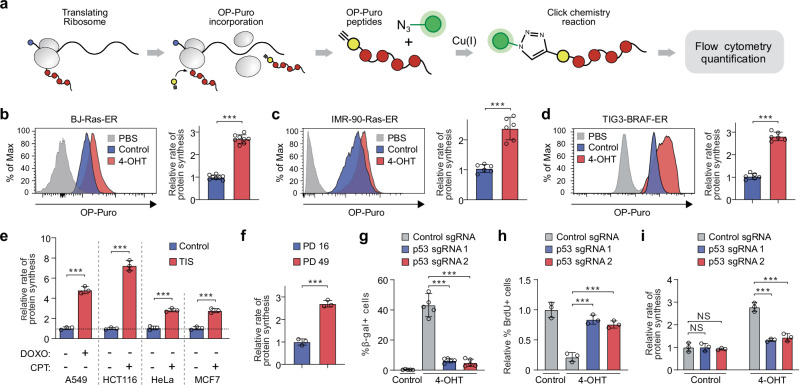
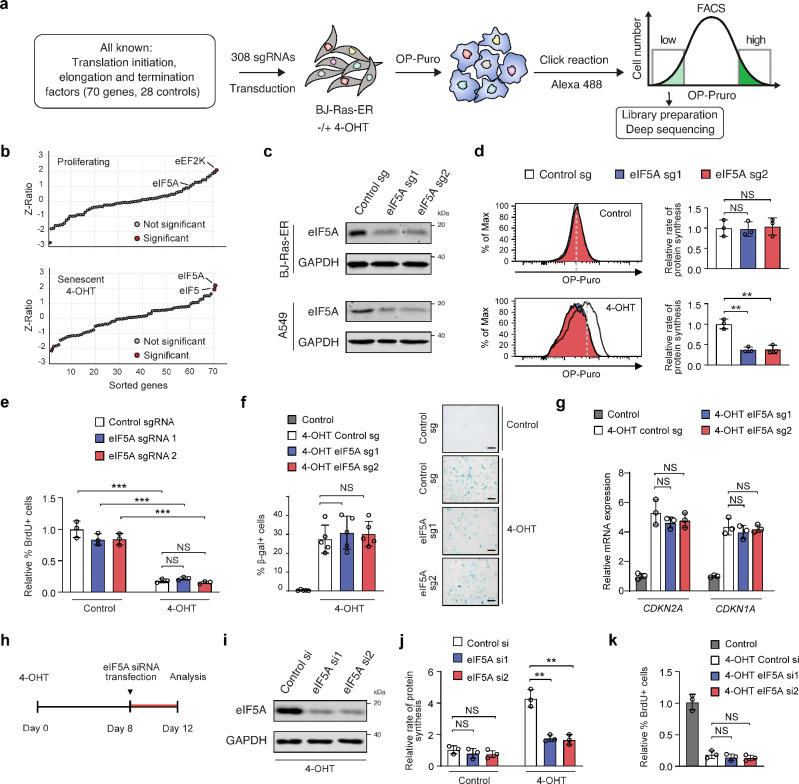
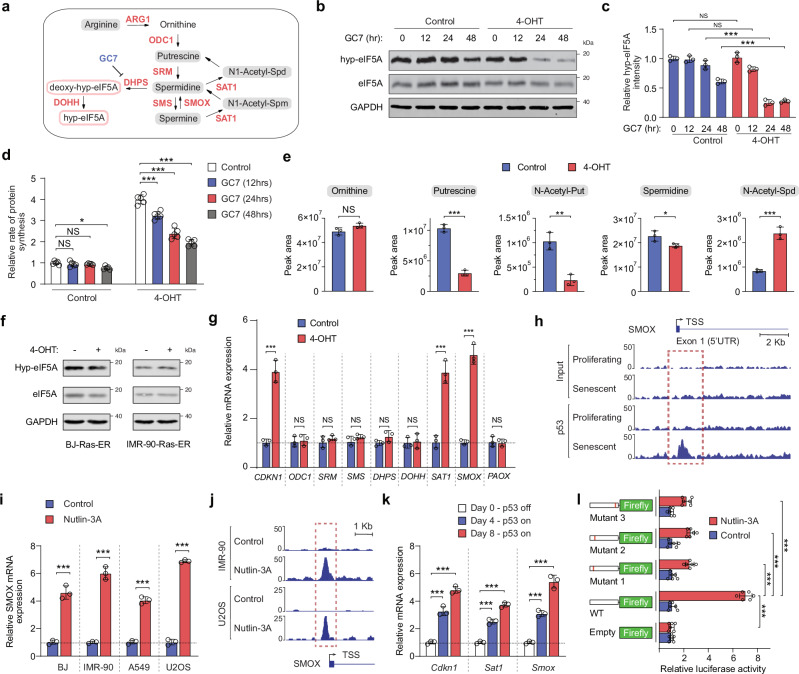
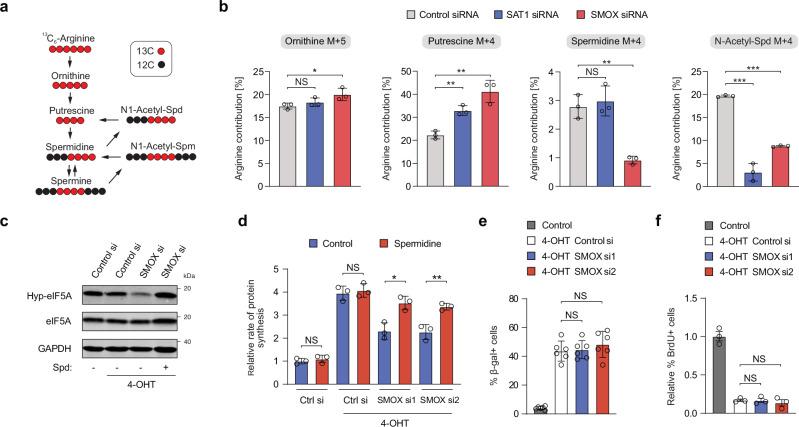
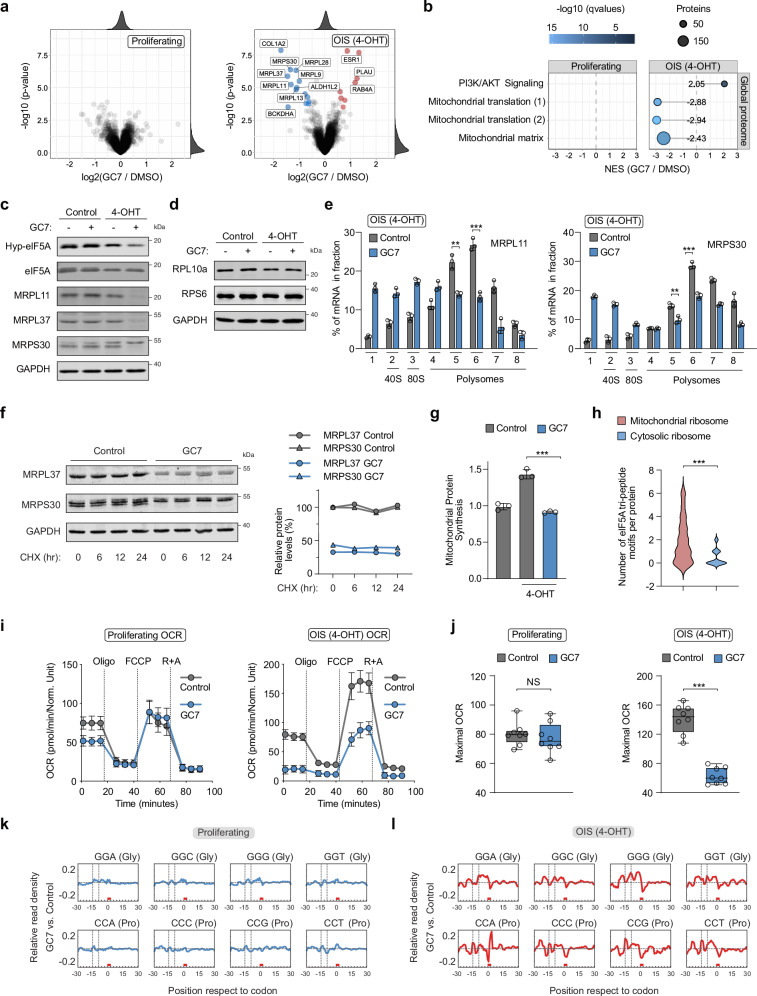
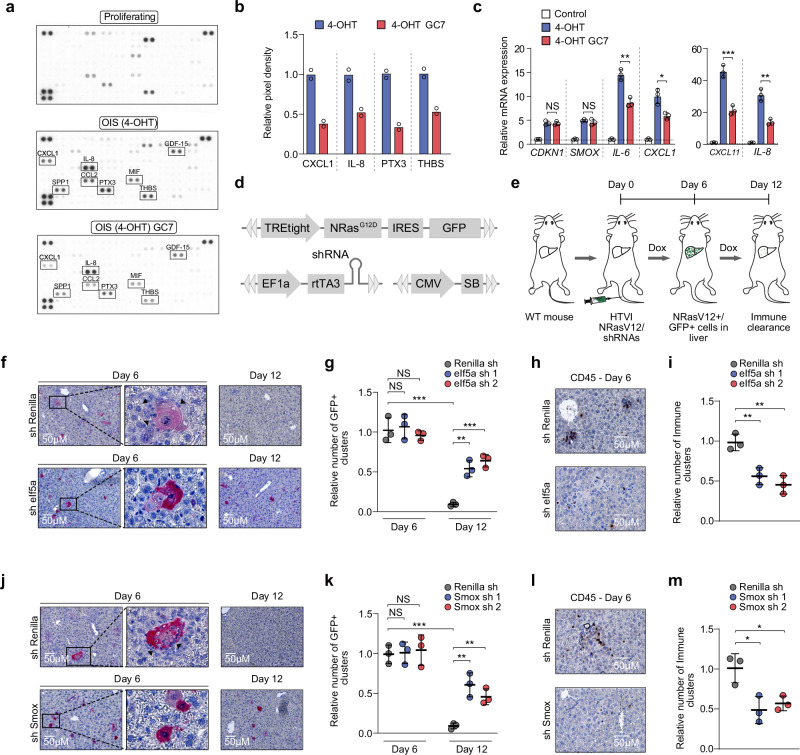
Cellular senescence is characterized by a permanent growth arrest and is associated with tissue aging and cancer. Senescent cells secrete a number of different cytokines referred to as the senescence-associated secretory phenotype (SASP), which impacts the surrounding tissue and immune response. Here, we find that senescent cells exhibit higher rates of protein synthesis compared to proliferating cells and identify eIF5A as a crucial regulator of this process. Polyamine metabolism and hypusination of eIF5A play a pivotal role in sustaining elevated levels of protein synthesis in senescent cells. Mechanistically, we identify a p53-dependent program in senescent cells that maintains hypusination levels of eIF5A. Finally, we demonstrate that functional eIF5A is required for synthesizing mitochondrial ribosomal proteins and monitoring the immune clearance of premalignant senescent cells in vivo. Our findings establish an important role of protein synthesis during cellular senescence and suggest a link between eIF5A, polyamine metabolism, and senescence immune surveillance.


Conflict of interest statement

The authors declare no competing financial interests.

Figures

Fig. 1
Fig. 1. Global translation rates are elevated in senescent cells.
a Experimental approach to measuring global translation rates in senescent cells. bd O-propargyl-puromycin (OP-Puro) incorporation and protein synthesis rates in proliferating and senescent BJ-Ras-ER cells (b), IMR-90-Ras-ER cells (c), and TIG3-BRAF-ER cells (d). Data represent mean ± SD from biologically independent experiments (b, n = 8; c, d, n = 6). p-values were calculated using a two-tailed unpaired t test. ***P  <  0.001. e Protein synthesis rates in proliferating and senescent cells treated with doxorubicin (DOXO) or camptothecin (CPT) for 7 days. A549, HCT116, HeLa, and MCF7 cells were used. Data represent mean ± SD from biologically independent experiments (n = 3). p-values were calculated using a two-tailed unpaired t test. ***P  <  0.001. f OP-Puro incorporation assay in IMR-90 cells undergoing replicative senescence. PD, population doubling. Data represent mean ± SD from biologically independent experiments (n = 3). p-values were calculated using a two-tailed unpaired t test. ***P  <  0.001. g Quantification of senescence-associated beta-galactosidase (SA-β-gal) expression in BJ-Ras-ER cells transduced with sgRNAs targeting the p53 gene or a control sequence. Data represent mean ± SD from biologically independent experiments (n = 5). p-values were calculated using a two-tailed unpaired t test. ***P  <  0.001. h Quantification of bromodeoxyuridine (BrdU) incorporation in various CRISPR-Cas9-transduced BJ-Ras-ER cells. Data represent mean ± SD from biologically independent experiments (n = 3). p-values were calculated using a two-tailed unpaired t test. ***P  <  0.001. i Quantification of protein synthesis rates based on OP-Puro incorporation in proliferating and senescent BJ-Ras-ER cells transduced with either a control sgRNA or sgRNAs targeting the p53 gene. Data represent mean ± SD from biologically independent experiments (n = 3). p-values were calculated using a two-tailed unpaired t test. NS, not significant; ***P  <  0.001. Source data, including exact p-values, are provided as Source Data files.
Fig. 2
Fig. 2. eIF5A is required to sustain elevated protein synthesis rates during cellular senescence.
a Experimental setup for the CRISPR-Cas9 screen on protein synthesis rates. b CRISPR screen results, with sgRNAs sorted by enrichment in proliferating (top) and senescent cells (bottom). Z-score and Z-ratio calculations are detailed in the methods. c Western blots from BJ-Ras-ER (top) and A549 (bottom) cells with eIF5A-targeting sgRNAs, representative of 3 independent experiments. d OP-Puro incorporation in proliferating (top) and senescent BJ-Ras-ER cells (bottom) with control or eIF5A sgRNAs. Data show mean ± SD from n = 3 biologically independent experiments. p-values via two-tailed unpaired t test. NS, not significant; **P  <  0.01. e BrdU incorporation in BJ-Ras-ER cells post 12 days of 4OHT treatment, transduced with eIF5A-targeting sgRNAs. Data are mean ± SD from n = 3 biologically independent experiments. p-values via two-tailed unpaired t test. NS, not significant; ***P  <  0.001. f β-galactosidase-positive cell quantification after 12 days of 4OHT treatment, transduced with eIF5A-targeting sgRNAs. Mean ± SD from n = 6 biologically independent experiments. p-values via two-tailed unpaired t test. NS is not significant. Scale bars, 50 μm. g qRT-PCR mRNA quantification after 12 days of 4OHT treatment in BJ-Ras-ER cells with eIF5A sgRNAs. Data are mean ± SD from n = 3 biologically independent experiments. p-values via two-tailed unpaired t test. NS is not significant. h Experimental design for transfecting two siRNAs targeting eIF5A in BJ-Ras-ER cells. siRNAs were transfected on day 8 post 4-OHT treatment and analyzed on day 12. i Western blots of BJ-Ras-ER cells transfected with siRNAs against eIF5A, collected on day 12 post 4-OHT treatment, representative of 3 independent experiments. j OP-Puro incorporation quantification in proliferating and senescent BJ-Ras-ER cells transfected with siRNA control or eIF5A siRNAs. Data are mean ± SD from n = 3 biologically independent experiments. p-values via two-tailed unpaired t test. NS, not significant; **P < 0.01. k BrdU incorporation in BJ-Ras-ER cells with eIF5A-targeting siRNAs. Data are mean ± SD from n = 3 biologically independent experiments. p-values via two-tailed unpaired t test. NS is not significant. Source data and exact p-values are provided in the Source Data file.
Fig. 3
Fig. 3. p53 regulates the expression of polyamine pathway components during cellular senescence.
a Schematic of the polyamine pathway, showing synthesis of putrescine, spermidine, and spermine from ornithine. Spermidine is a substrate for eIF5A hypusination. b Immunoblotting of protein extracts from proliferating and OIS BJ-Ras-ER cells treated with GC7 (10 μM) for indicated times. c Hypusinated eIF5A (hyp-eIF5A) band intensity quantified relative to eIF5A. Mean ± SD from n = 3 biologically independent experiments. p-values via two-tailed unpaired t test. NS, not significant; ***P < 0.001. d OP-Puro incorporation assay in proliferating and OIS BJ-Ras-ER cells treated with GC7 (10 μM). Mean ± SD from n = 5 biologically independent experiments. Two-tailed unpaired t test p-values: NS, not significant; *P < 0.05; ***P < 0.001. e Intracellular levels of ornithine, putrescine, N-acetyl-putrescine, spermidine, spermine, and N-acetyl-spermidine measured by LC-MS in proliferating and OIS BJ-Ras-ER cells (4-OHT). Mean ± SD from n = 3 biologically independent experiments. Two-tailed unpaired t test p-values: NS, not significant; *P < 0.05; ***P < 0.001. f Immunoblot of hypusinated eIF5A (Hyp-eIF5A) and total eIF5A in proliferating and senescent BJ-Ras-ER and IMR90-Ras-ER cells. One representative of 3 independent experiments. g qRT-PCR analysis of polyamine pathway gene expression in proliferating and OIS cells (4-OHT). Mean ± SD from n = 3 biologically independent experiments. Two-tailed unpaired t test p-values: NS, not significant; ***P < 0.001. h SMOX promoter locus overview with p53 ChIP-seq data in proliferating and OIS IMR-90 cells (~ 10 kb). Data from Kirschner et al. i qRT-PCR of SMOX expression after 24 hrs of Nutlin3A treatment. Mean ± SD from n = 3 biologically independent experiments. Two-tailed unpaired t test p-values: ***P < 0.001. j SMOX promoter locus schematic showing p53 binding by ChIP-seq in IMR-90 and U2OS cells after 24 hrs Nutlin-3A treatment (~ 5 kb). k Mouse liver progenitor cells with H-RasG12D, tTA, and tetracycline-responsive p53 shRNA, cultured without doxycycline to restore p53 expression. Sat1 and Smox expression were assessed by qRT-PCR on days 0, 4, and 8. Mean ± SD from n = 3 biologically independent experiments. Two-tailed unpaired t test p-values: ***P < 0.001. l Luciferase activity measured in A549 after 24 hrs treatment with vehicle or Nutlin3A. Mean ± SD from n = 6 biologically independent experiments. Two-tailed unpaired t test p-values: ***P < 0.001. Source data, including exact p-values, are in the Source Data file.
Fig. 4
Fig. 4. SMOX plays a crucial role in maintaining eIF5A hypusination and protein synthesis in OIS.
a Schematic for 13C6-Arginine tracing into the polyamine synthesis pathway. Black circles represent 12C atoms, while red circles represent 13C atoms. b Tracing analysis from 13C6-Arginine OIS cells transfected with siRNAs targeting SAT1 or SMOX. Data represent mean ± SD from biologically independent experiments (n = 3). p-values were calculated using a two-tailed unpaired t test. NS, not significant; *P  <  0.05; **P  <  0.01; ***P  <  0.001. c Immunoblot assay of hypusinated eIF5A (Hyp-eIF5A), total eIF5A, and SMOX in OIS cells transfected with siRNAs against SMOX and treated with 10 μM spermidine (Spd). d Quantification of OP-Puro incorporation in OIS BJ-Ras-ER cells transfected with either siRNA control or SMOX siRNAs. Cells were treated with 10 μM spermidine. Data represent mean ± SD from biologically independent experiments (n = 3). p-values were calculated using a two-tailed unpaired t test. NS is not significant; *P  <  0.05; **P  <  0.01. e Senescence-associated beta-galactosidase (SA-β-gal) assay in OIS BJ-Ras-ER cells transfected with siRNAs against SMOX. Data represent mean ± SD from biologically independent experiments (n = 3). p-values were calculated using a two-tailed unpaired t test. NS is not significant. f Quantification of BrdU incorporation in OIS BJ-Ras-ER cells transfected with siRNAs against SMOX. Data represent mean ± SD from biologically independent experiments (n = 3). p-values were calculated using a two-tailed unpaired t test. NS is not significant. Source data, including exact p-values, are provided as Source Data files.
Fig. 5
Fig. 5. eIF5A regulates the translation of mitochondrial ribosomal proteins in OIS cells.
a Differential protein expression after GC7 addition (12 hr) in proliferating (left) and OIS-BJ cells (right). Proteins with log2 fold difference > 0.5 and adj. p-value < 0.001 are in red; log2 fold difference <− 0.5 and adj. p-value < 0.001 are in blue. Empirical Bayes moderated t test and two-sided p-values. b Gene set enrichment analysis from (a). A negative NES indicates decreased expression upon GC7 treatment. Enriched gene sets (q-value < 0.05) from the Molecular Signatures Database are shown, including set size and q-value. PI3K/AKT Signaling (R-HAS-2219528); Mitochondrial translation (1) (R-HAS-5368287); Mitochondrial translation (2) (GO:0032543); Mitochondrial matrix (GO:0005759). c, d Western blots on cell extracts from proliferating and OIS BJ-Ras-ER cells treated with GC7 (10 μM) for 24 h. e Polysome analysis in OIS BJ-Ras-ER cells treated with GC7 (10 μM) for 24 h. Mean ± SD from n = 3 biologically independent experiments. Two-tailed unpaired t test: **P < 0.01; ***P < 0.001. f Cycloheximide (CHX) chase assay in OIS BJ-Ras-ER cells treated with GC7 (10 μM) for 24 h, with quantification. Data from two independent experiments. g Mitochondrial OP-Puro incorporation in proliferating and OIS BJ-Ras-ER cells treated with GC7 (10 μM) for 24 h. Mean ± SD from n = 3 biologically independent experiments. Two-tailed unpaired t test: ***P < 0.001. h eIF5A tri-peptide motifs per protein in human mitochondrial ribosomal proteins (n = 79) and all human ribosomal proteins (n = 76). Data represent motif distribution frequency. Chi-square test: ***P < 0.001. i, j Oxygen Consumption Rate (OCR) in proliferating and OIS BJ-Ras-ER cells treated with GC7 (10 μM) for 16 hours. (i) Mean ± SD from n = 8 biologically independent experiments. j Box plots (n = 8). The center line represents the median, upper and lower bounds represent the 75th and the 25th percentile, respectively. Whiskers represent minimum and maximum values. Oligomycin (Oligo, 0.5 μM), FCCP (1 μM), or Rotenone and Antimycin A (R + A, 0.5 μM each Two-tailed unpaired t test: NS is not significant; ***P < 0.001. k, l Cytosolic RPF density analysis in proliferating or OIS BJ-Ras-ER cells treated with GC7 (10 μM) for 18 hours. Codon regions of 61 nucleotides along the transcriptome are shown. Normalized 5′ ends of RPFs counted for each codon-region. Source data, including exact p-values, are provided as a Source Data file.
Fig. 6
Fig. 6. Inhibition of eIF5A hypusination affects SASP expression, impairing immune surveillance of oncogene-induced senescent cells in vivo.
a Cytokine array of conditioned media from proliferating or OIS BJ-Ras-ER cells. OIS cells were treated with GC7 (10 μM) for 24 h. b Relative quantification of cytokines from (a). Data represent the mean of two independent experiments. c Expression of SASP genes in proliferating and OIS BJ-Ras-ER cells treated with GC7 (10 μM) for 48 h. Data represent mean ± SD from biologically independent experiments (n = 3). Two-tailed unpaired t test: NS, not significant; *P < 0.05; **P < 0.01; ***P < 0.001. d Scheme of Sleeping Beauty vectors used in experiments described in (e). e Experimental design to assess effects of repressing eIf5a and Smox on senescent cell clearance in the liver (HTVI, Hydrodynamic tail vein injection). f Representative immunohistochemistry (IHC) images of liver sections stained for GFP. Livers were collected at days 6 and 12 post-injection with vectors (d). Arrows indicate immune infiltrates. g Quantification of GFP-expressing cells in livers of animals injected with vectors. Livers were collected on days 6 and 12 post-injection. Data represent mean ± SD from biologically independent experiments (n = 3). Two-tailed unpaired t test: NS, not significant; **P < 0.01; ***P < 0.001. h Representative IHC images of liver sections stained for CD45, harvested on day 6 post-injection with vectors. i Quantification of infiltrated CD45-positive cells at day 6 post-injection. Data represent mean ± SD from biologically independent experiments (n = 3). Two-tailed unpaired t test: **P < 0.01. j Representative IHC images of liver sections stained for GFP collected on days 6 and 12 post-injection with shRNAs targeting Renilla or Smox mRNA. Arrows indicate immune cells near senescent cell clusters. k Quantification of GFP-expressing cells in livers injected with Renilla or Smox shRNAs. Livers were collected on days 6 and 12 post-injection. Data represent mean ± SD from biologically independent experiments (n = 3). Two-tailed unpaired t test: NS is not significant; **P < 0.01; ***P < 0.001. l IHC images of liver sections stained for CD45, harvested on day 6 post-injection with Renilla or Smox shRNAs. m Quantification of infiltrated CD45-positive cells at day 6 post-injection. Data represent mean ± SD from biologically independent experiments (n = 3). Two-tailed unpaired t test: *P < 0.05. Source data, including exact p-values, are provided as a Source Data file.

References

    1. Kuilman, T., Michaloglou, C., Mooi, W. J. & Peeper, D. S. The essence of senescence. Genes Dev.24, 2463–2479 (2010). 10.1101/gad.1971610 - DOI - PMC - PubMed
    1. Rufini, A., Tucci, P., Celardo, I. & Melino, G. Senescence and aging: the critical roles of p53. Oncogene32, 5129–5143 (2013). 10.1038/onc.2012.640 - DOI - PubMed
    1. Serrano, M., Lin, A. W., McCurrach, M. E., Beach, D. & Lowe, S. W. Oncogenic ras provokes premature cell senescence associated with accumulation of p53 and p16INK4a. Cell88, 593–602 (1997). 10.1016/S0092-8674(00)81902-9 - DOI - PubMed
    1. Georgilis, A. et al. PTBP1-Mediated alternative splicing regulates the inflammatory secretome and the pro-tumorigenic effects of senescent cells. Cancer Cell34, 85–102.e9 (2018). 10.1016/j.ccell.2018.06.007 - DOI - PMC - PubMed
    1. Kang, T.-W. et al. Senescence surveillance of pre-malignant hepatocytes limits liver cancer development. Nature479, 547–551 (2011). 10.1038/nature10599 - DOI - PubMed

MeSH terms

LinkOut - more resources