. 2024 Aug 27;14(1):19928.
doi: 10.1038/s41598-024-67736-w.

A thirty-year time series analyses identifies coherence between oscillations in Anthrax outbreaks and El Niño in Karnataka, India

Affiliations

A thirty-year time series analyses identifies coherence between oscillations in Anthrax outbreaks and El Niño in Karnataka, India

Mohammed Mudassar Chanda et al. Sci Rep. .

Abstract

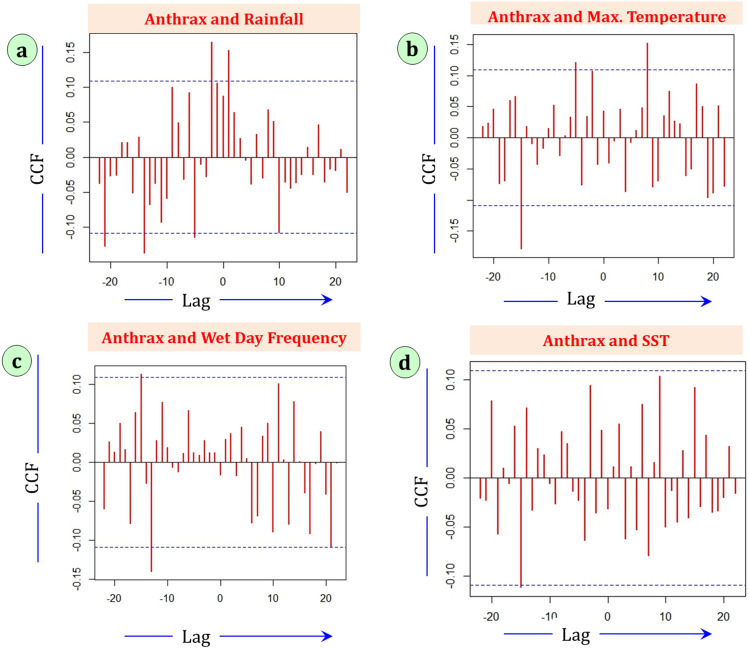
Anthrax is an economically important zoonotic disease affecting both livestock and humans. The disease is caused by a spore forming bacterium, Bacillus anthracis, and is considered endemic to the state of Karnataka, India. It is critical to quantify the role of climatic factors in determining the temporal pattern of anthrax outbreaks, so that reliable forecasting models can be developed. These models will aid in establishing public health surveillance and guide strategic vaccination programs, which will reduce the economic loss to farmers, and prevent the spill-over of anthrax from livestock to humans. In this study, correlation and coherence between time series of anthrax outbreaks in livestock (1987-2016) and meteorological variables and Sea Surface Temperature anomalies (SST) were identified using a combination of cross-correlation analyses, spectral analyses (wavelets and empirical mode decomposition) and further quantified using a Bayesian time series regression model accounting for temporal autocorrelation. Monthly numbers of anthrax outbreaks were positively associated with a lagged effect of rainfall and wet day frequency. Long-term periodicity in anthrax outbreaks (approximately 6-8 years) was coherent with the periodicity in SST anomalies and outbreak numbers increased with decrease in SST anomalies. These findings will be useful in planning long-term anthrax prevention and control strategies in Karnataka state of India.


Conflict of interest statement

The authors declare no competing interests.

Figures

Figure 1
Figure 1
(A) Map showing study location Karnataka state in India (Map boundaries are shown as per the guidelines from Survey of India). (B) Time series plot of monthly anthrax outbreaks in Karnataka (1987–2016). The x-axis is time in months and y-axis shows the number of the anthrax outbreaks.
Figure 2
Figure 2
Dominant frequencies in the monthly anthrax outbreaks time series (a) and Cross-wavelet coherence between anthrax outbreaks and SST anomalies (b) Wavelet power spectrum- The white dotted line is the cone of influence indicating the region of time and frequency where the results are not influenced by the edges of the data and are therefore reliable. The solid black line corresponds to the 95% confidence interval and the areas within this black solid line indicate significant coherence at the corresponding periods and times. Spectrum power in coherence increases from blue to red on the scale of 0 to 1. X-axis: time in months, Y-axis: localised periodicity in months. For Coherence analysis, X variable is SST anomaly and Y variable is anthrax outbreaks.
Figure 3
Figure 3
Cross-correlations between with anthrax outbreaks and (a) rainfall (b) maximum temperature, (c) wet day frequency and (d) sea surface temperature. The x-axis gives the number of lags in months, and the y-axis gives the value of the correlation between -1 and 1. The blue dashed lines are the 95% confidence intervals for the cross-correlation between two series that are white noise. Identification of significant lag is done by checking the lines beyond the 95% confidence interval on the left hand side of the graph starting from zero lag.
Figure 4
Figure 4
Plot of model fit using selected meteorological variables and the AR (1 & 2) term. Red dotted lines correspond to the 95% credible interval, green solid line is the predicted number of outbreaks and the blue open circles are the observed number outbreaks.

References

    1. Fasanella, A., Galante, D., Garofolo, G. & Jones, M. H. Anthrax undervalued zoonosis. Vet. Microbiol.140, 318–331 (2010). 10.1016/j.vetmic.2009.08.016 - DOI - PubMed
    1. Klein, F. et al. Anthrax toxin: Causative agent in the death of rhesus monkeys. Science138, 1331–1333 (1962). 10.1126/science.138.3547.1331 - DOI - PubMed
    1. Beyer, W. & Turnbull, P. Anthrax in animals. Mol. Aspects Med.30, 481–489 (2009). 10.1016/j.mam.2009.08.004 - DOI - PubMed
    1. Shadomy, S. V. & Smith, T. L. Anthrax. J. Am. Vet. Med. Assoc.233, 63–72 (2008). 10.2460/javma.233.1.63 - DOI - PubMed
    1. Organization, W. H. Anthrax in humans and animals. (World Health Organization, 2008). - PubMed

LinkOut - more resources