. 2024 Aug 28;14(1):19998.
doi: 10.1038/s41598-024-70752-5.

Emerin deficiency drives MCF7 cells to an invasive phenotype

Affiliations

Emerin deficiency drives MCF7 cells to an invasive phenotype

Emily Hansen et al. Sci Rep. .

Erratum in

Abstract

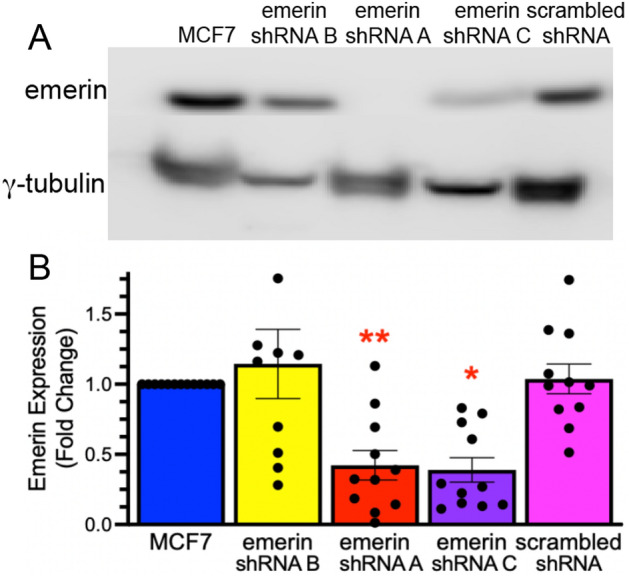
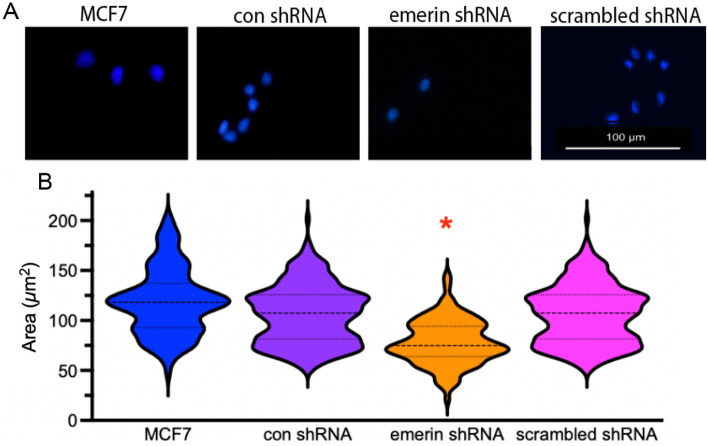
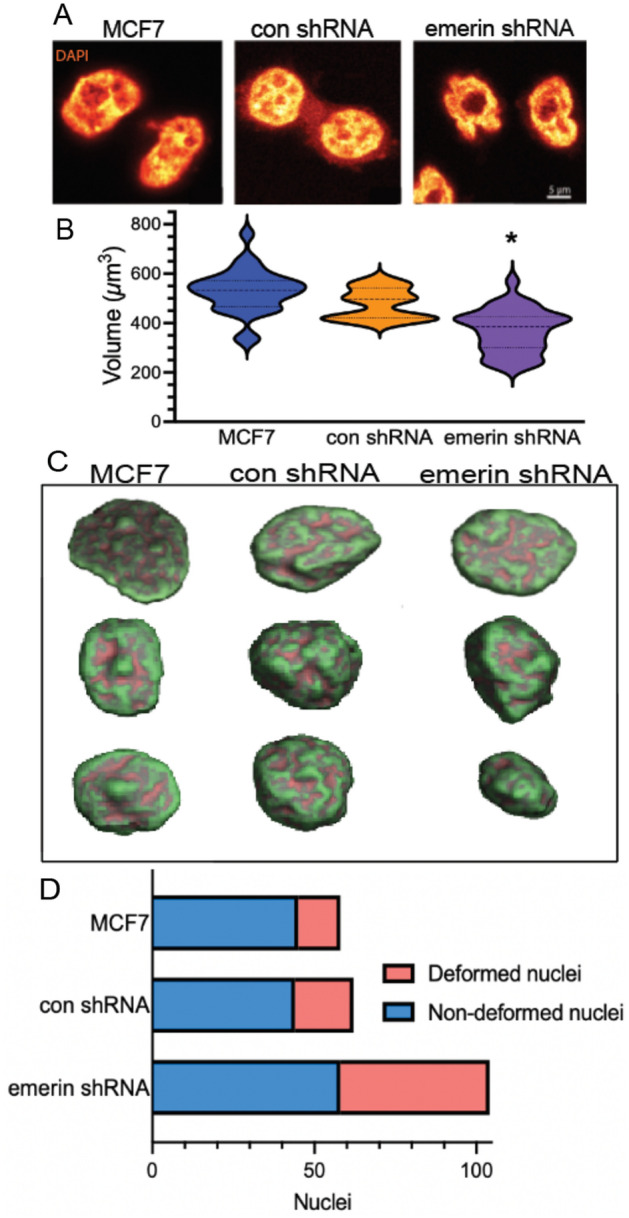
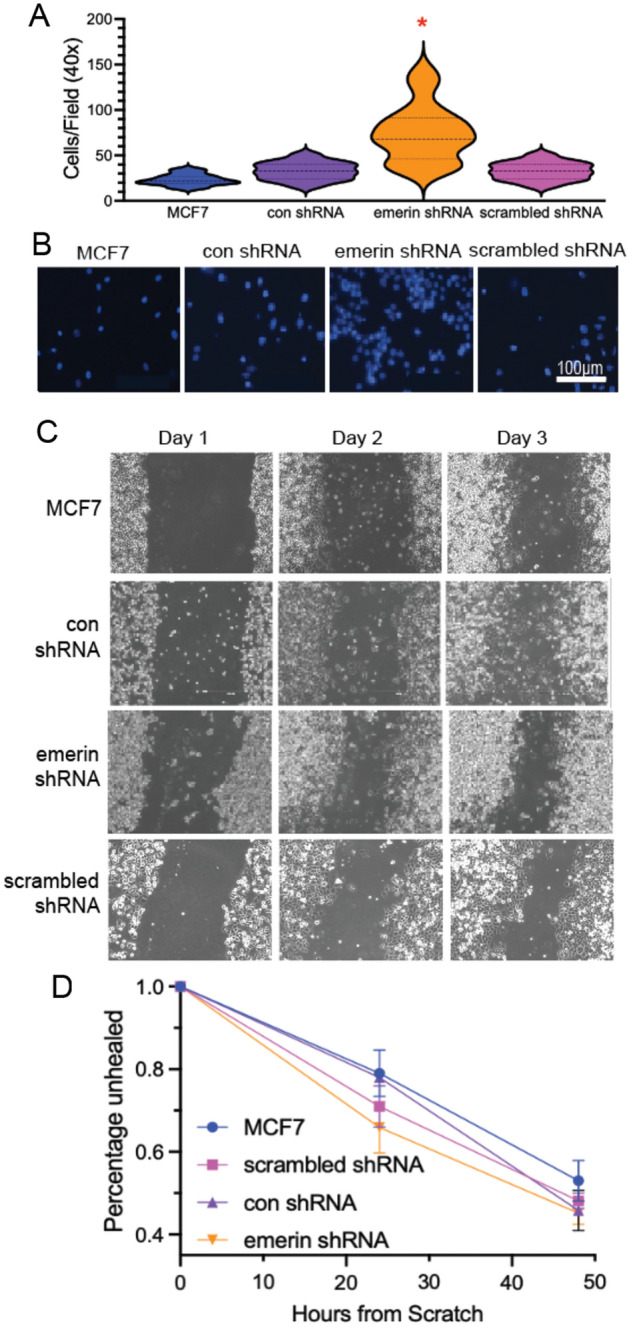
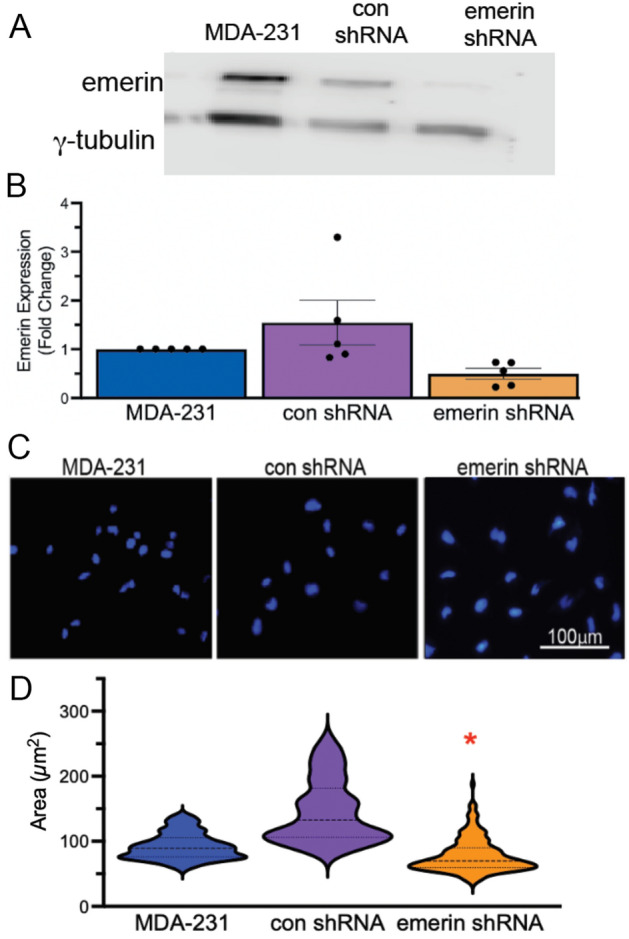
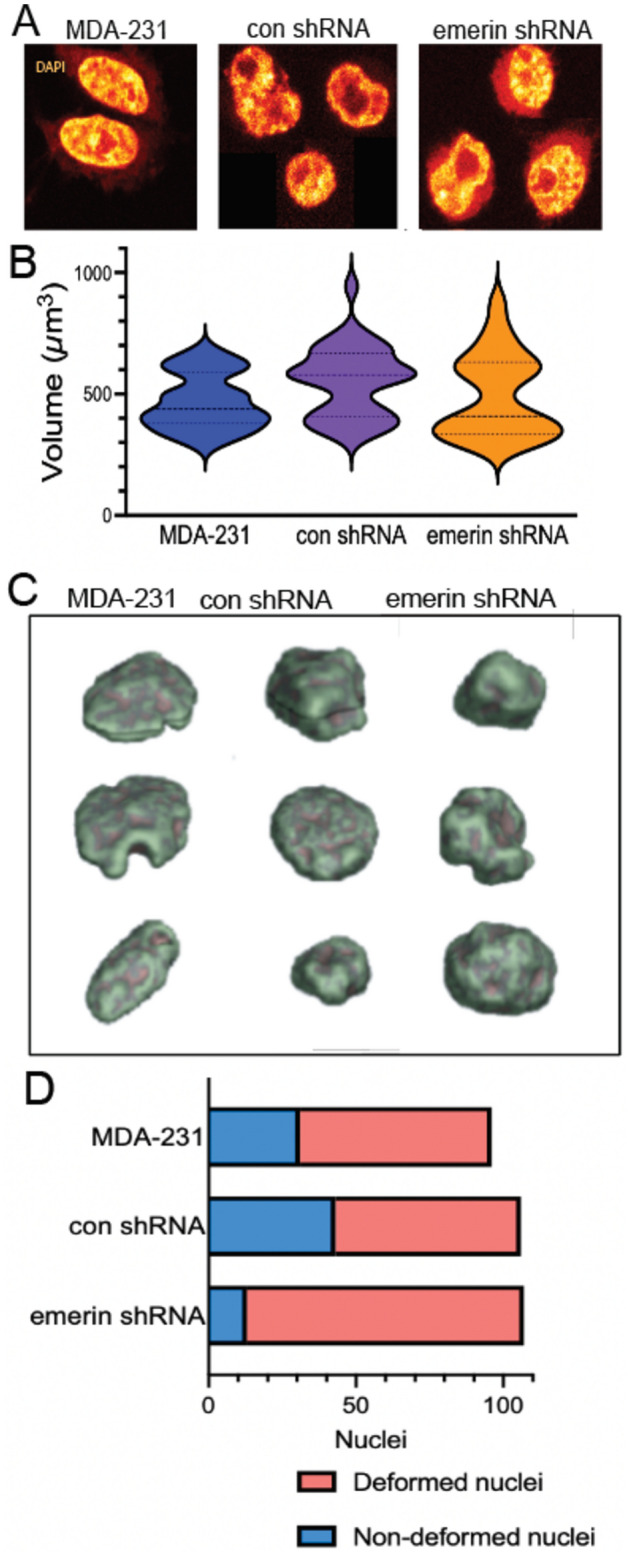
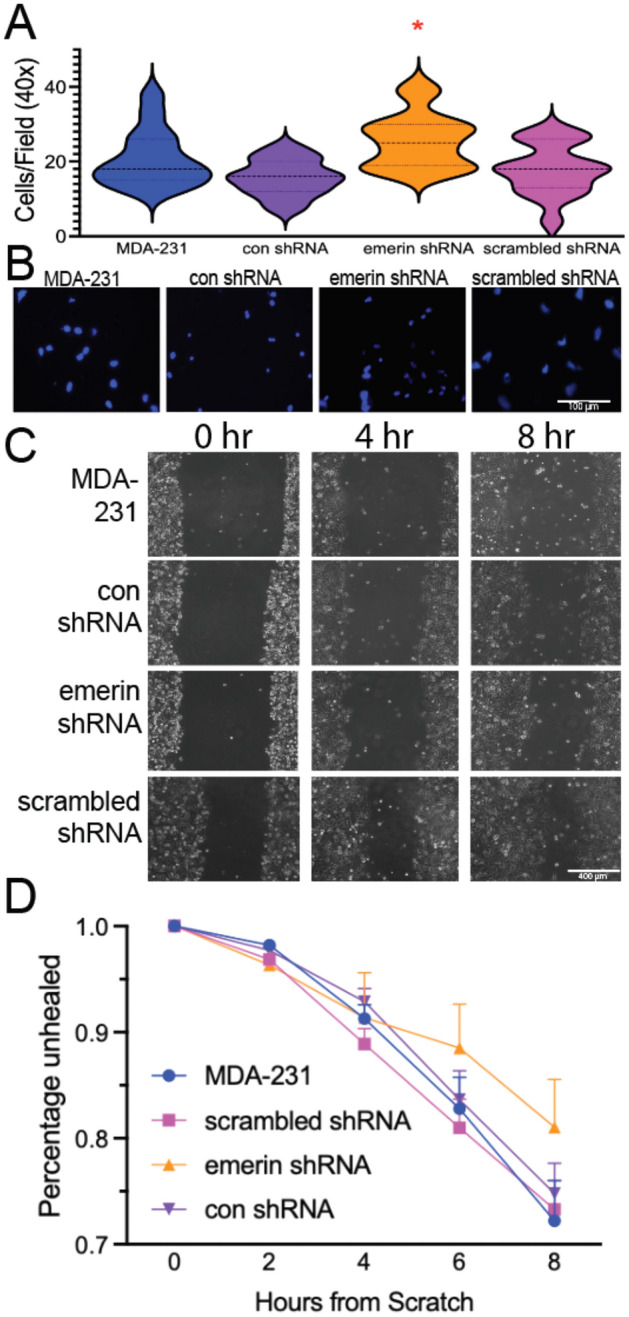
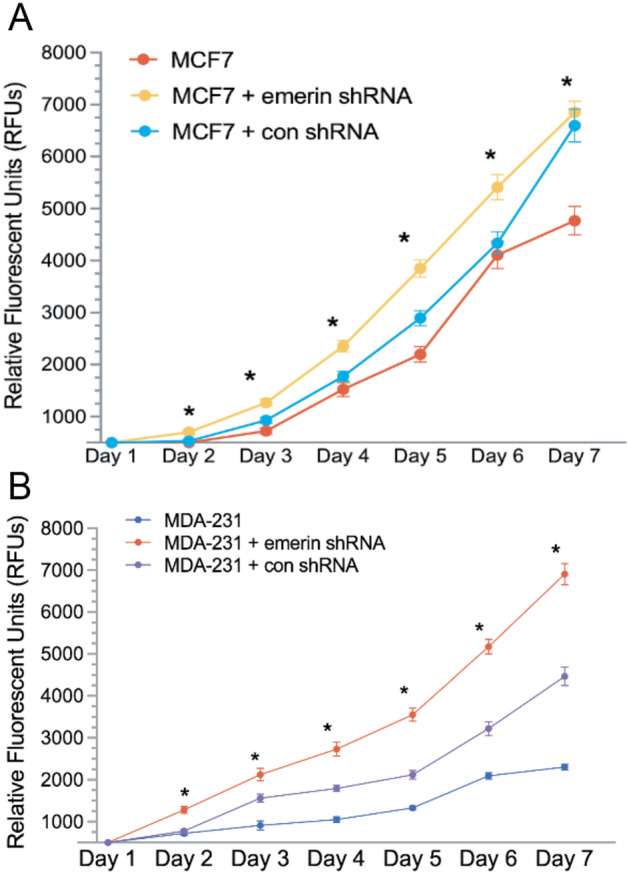
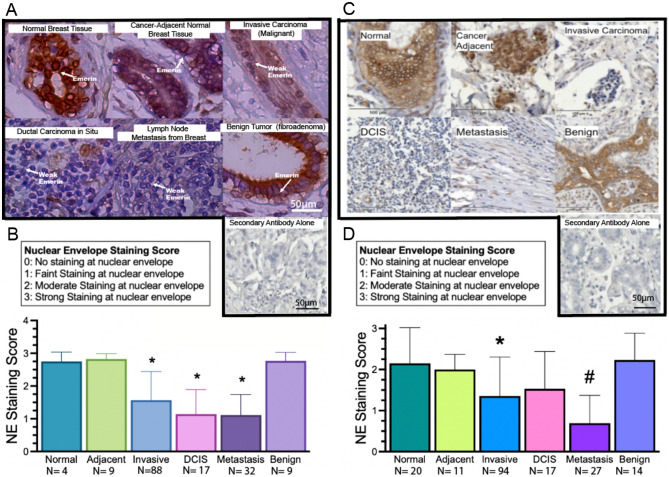
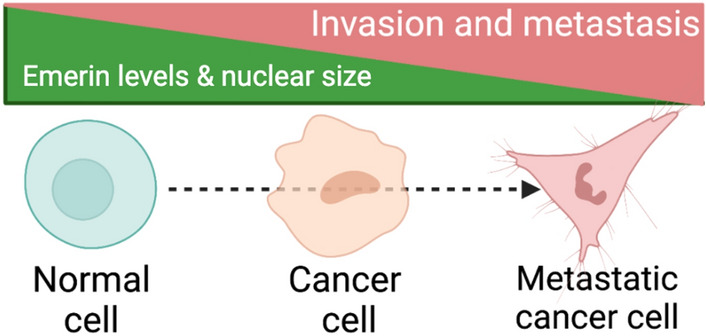
During metastasis, cancer cells traverse the vasculature by squeezing through very small gaps in the endothelium. Thus, nuclei in metastatic cancer cells must become more malleable to move through these gaps. Our lab showed invasive breast cancer cells have 50% less emerin protein resulting in smaller, misshapen nuclei, and higher metastasis rates than non-cancerous controls. Thus, emerin deficiency was predicted to cause increased nuclear compliance, cell migration, and metastasis. We tested this hypothesis by downregulating emerin in noninvasive MCF7 cells and found emerin knockdown causes smaller, dysmorphic nuclei, resulting in increased impeded cell migration. Emerin reduction in invasive breast cancer cells showed similar results. Supporting the clinical relevance of emerin reduction in cancer progression, our analysis of 192 breast cancer patient samples showed emerin expression inversely correlates with cancer invasiveness. We conclude emerin loss is an important driver of invasive transformation and has utility as a biomarker for tumor progression.

Keywords: Breast cancer; Emerin; Metastasis; Nucleoskeleton.


Conflict of interest statement

The authors declare no competing interests.

Figures

Fig. 1
Fig. 1
Emerin protein expression in MCF7, scrambled shRNA, and MCF7 emerin shRNA-transfected cell lines. (A) Representative western blot and (B) quantification of MCF7, scrambled shRNA, and three emerin shRNA cell lines normalized to γ-tubulin. *P = 0.0108, **P = 0.0061, N = 10–13, One-way ANOVA followed by Dunnett’s multiple comparison.
Fig. 2
Fig. 2
Reducing emerin in MCF7 cells decreased nuclear area. (A) Representative DAPI images of MCF7, control shRNA, emerin shRNA, and scrambled shRNA cell lines, which were used to measure nuclear area. (B) Violin plot of nuclear area of MCF7, control shRNA, emerin shRNA, and scrambled shRNA MCF7 cells (N > 50 nuclei). The mean is depicted as the dark dashed line and the thin dashed lines represent the first and third quartiles. *P < 0.0001, one-way ANOVA followed by Dunnett’s multiple comparison.
Fig. 3
Fig. 3
Emerin reduction decreases nuclear volume and increases nuclear bulges and indentations in MCF7 cells. (A) Representative confocal images of DAPI-stained nuclei from MCF7, control shRNA, and emerin shRNA lines. (B) Violin plots of nuclear volumes (N > 15 nuclei for each) of MCF7, control shRNA, and emerin shRNA MCF7 cell lines. The mean is depicted as the dark dashed line and the thin dashed lines represent the first and third quartiles. *P < 0.0001, one-way ANOVA followed by Dunnett’s multiple comparison test. (C) 3-D rendering of z-stacks from representative nuclei in B showing the concavity and convexity of the nuclei. Red–orange indicates a concave surface and green indicates a convex surface. (D) The proportion of deformed nuclei in MCF7, con shRNA, and emerin shRNA MCF7 cells.
Fig. 4
Fig. 4
Reducing emerin in MCF7 cells increases impeded migration. (A) Violin plot of the number of cells migrating through 8 µm trans-well pores is shown for MCF7, control shRNA, emerin shRNA, and scrambled shRNA cell lines (n = 5 fields). The mean is depicted as the dark dashed line and the thin dashed lines represent the first and third quartiles. *P < 0.0001, one-way ANOVA followed by Dunnett’s multiple comparison. (B) Representative DAPI images of the cells that successfully migrated in the trans-well assays in A. (C) Scratch-wound healing assay. MCF7, control shRNA, emerin shRNA, and scrambled shRNA MCF7 cell lines were plated, scratched with a pipette tip, and their migration into the wound area was monitored over three days. Representative phase images are shown. (D) The rate of scratch wound healing, which refers to the ability of cells to migrate into the wound area is shown with standard error of the mean. Two-way ANOVA did not identify significance.
Fig. 5
Fig. 5
Reducing emerin in MDA-231 lines fails to affect nuclear size. (A) Representative western blot of emerin and γ-tubulin (loading control) in MDA-231, control shRNA, and emerin shRNA cell lines and (B) quantitation of the western blots, N = 5. P = 0.0018. (C) Representative images of nuclei in MDA-231, control shRNA, and emerin shRNA stable cell lines that were used to measure nuclear area. (D) A violin plot of nuclear area of MDA-231, control shRNA, and emerin shRNA MDA-231 cell lines. The mean is depicted as the dark dashed line and the thin dashed lines represent the first and third quartiles *P < 0.0006, N > 50 nuclei; one-way ANOVA followed by Dunnett’s multiple comparison test.
Fig. 6
Fig. 6
Reducing emerin in MDA-231 cells fails to decrease nuclear volume but increases nuclear deformations. (A) Representative confocal images of DAPI-stained nuclei from MDA-231, control shRNA, and emerin shRNA MDA-231 cell lines. (B) Violin plots of nuclear volumes (N > 15 nuclei for each) of MDA-231, control shRNA, and emerin shRNA cell lines. The mean is depicted as the dark dashed line and the thin dashed lines represent the first and third quartiles. No significant differences were seen using one-way ANOVA. (C) Representative images of convexity and concavity of nuclei in the respective cell lines. Red–orange indicates concave surface and green indicates a convex surface. (D) Fraction of nuclei with and without deformities for MDA-231, control shRNA, and emerin shRNA cell lines.
Fig. 7
Fig. 7
Reducing emerin in MDA-231 cells increases their impeded migration. (A) A violin plot of the number of cells migrating through 8 µm trans-well pores is shown for MDA-231, control shRNA, emerin shRNA, and scrambled shRNA MDA-231 cell lines (N = 5 fields). The mean is depicted as the dark dashed line and the thin dashed lines represent the first and third quartiles. *P < 0.0037 compared to control shRNA, one-way ANOVA followed by Dunnett’s multiple comparison; 3 biological replicates were used for each cell line. (B) Representative DAPI images of the cells that successfully migrated in the trans-well assays in A. (C) Scratch-wound healing assay. MDA-231, control shRNA, emerin shRNA, and scrambled shRNA MDA-231 cell lines were plated, scratched with a pipette tip, and migration into the wound area was monitored every 2 h for 8 h. Representative phase images are shown. (D) The rate of scratch wound healing, which refers to the ability of cells to migrate into the wound area, is shown with SEM. Two-way ANOVA was used, and no significant differences were seen.
Fig. 8
Fig. 8
Reduction of emerin increases cell proliferation in MCF7 and MDA-231 cells. (A) Growth curves of MCF7, emerin shRNA MCF7, and control shRNA MCF7 cells, as shown by measuring metabolic activity with Presto Blue Cell Viability Reagent (Life Technologies, cat#: A13261) per manufacturer’s instructions. Mean data plotted with SEM; N = 3 biological replicates. * indicates a difference between MCF7 + emerin shRNA and MCF7 cells (*P < 0.05)), as determined by two-way ANOVA and Dunnett’s test. (B) Growth curves of MDA-231, emerin shRNA MDA-231, and control shRNA MDA-231 cell lines as determined using Presto Blue. Mean data plotted with SEM; N = 3 biological replicates. * indicates a significant difference between MDA-231 + emerin shRNA and MDA-231 cells (*P < 0.05), as determined by two-way ANOVA and Dunnett’s test.
Fig. 9
Fig. 9
Reduced emerin expression at the nuclear periphery correlates with breast cancer invasiveness in patients. (A) Representative tissue microarray staining of emerin in 159 patients using emerin polyclonal antibodies (Proteintech, cat# 10351-1-AP) or secondary alone (Vector Lab, cat#: MP-7451). Nuclei are blue, emerin is brown, and arrows denote emerin staining in certain images for reference. As severity of cases increases, there is a visible reduction in emerin expression at the nuclear envelope and more deformed nuclei are present. (B) Quantification of emerin staining on IHC-stained patient samples using 0–3, with 0 having no staining at the nuclear periphery and 3 having complete, dark rim staining. N = 159 total samples, *P < 0.05 compared to normal tissue, one-way ANOVA and Dunnett’s test. Error bars represent standard deviation. (C) Representative tissue microarray staining of emerin in 183 patients using emerin monoclonal antibodies (Leica, NCL-Emerin) or secondary alone (Vector Lab, cat#: MP-7452) using the same samples used in A. Nuclei are blue and emerin is brown. As aggressiveness of cases increases, there is a visible reduction in emerin expression and more deformed nuclei are present. (D) Quantification of emerin staining using the 0 to 3 grading system. N = 183 total samples #P < 0.02 compared to all non-cancerous tissue, *P < 0.0062 compared to both normal and benign tissue, one-way ANOVA and Dunnett’s test. Error bars represent standard deviation.
Fig. 10
Fig. 10
Graphical hypothesis demonstrating the effect of emerin levels on the progression of metastatic disease.

Update of

Similar articles

Cited by

References

    1. Hanahan, D. Hallmarks of cancer: New dimensions. Cancer Discov.12(1), 31–46. 10.1158/2159-8290.CD-21-1059 (2022). - PubMed
    1. Chaffer, C. L. & Weinberg, R. A. A perspective on cancer cell metastasis. Science331(6024), 1559–1564. 10.1126/science.1203543 (2011). - PubMed
    1. Wirtz, D., Konstantopoulos, K. & Searson, P. C. The physics of cancer: The role of physical interactions and mechanical forces in metastasis. Nat. Rev. Cancer.11(7), 512–22 (2011). - PMC - PubMed
    1. Bussolati, G., Marchio, C., Gaetano, L., Lupo, R. & Sapino, A. Pleomorphism of the nuclear envelope in breast cancer: a new approach to an old problem. J. Cell Mol. Med.12(1), 209–18. 10.1111/j.1582-4934.2007.00176.x (2008). - PMC - PubMed
    1. Acerbi, I. et al. Human breast cancer invasion and aggression correlates with ECM stiffening and immune cell infiltration. Integr. Biol. (Camb)7(10), 1120–34. 10.1039/c5ib00040h (2015). - PMC - PubMed