. 2024 Aug;56(8):1869-1886.
doi: 10.1038/s12276-024-01309-9. Epub 2024 Aug 29.

Altered lipid metabolism promoting cardiac fibrosis is mediated by CD34+ cell-derived FABP4+ fibroblasts

Affiliations

Altered lipid metabolism promoting cardiac fibrosis is mediated by CD34+ cell-derived FABP4+ fibroblasts

Luping Du et al. Exp Mol Med. 2024 Aug.

Abstract

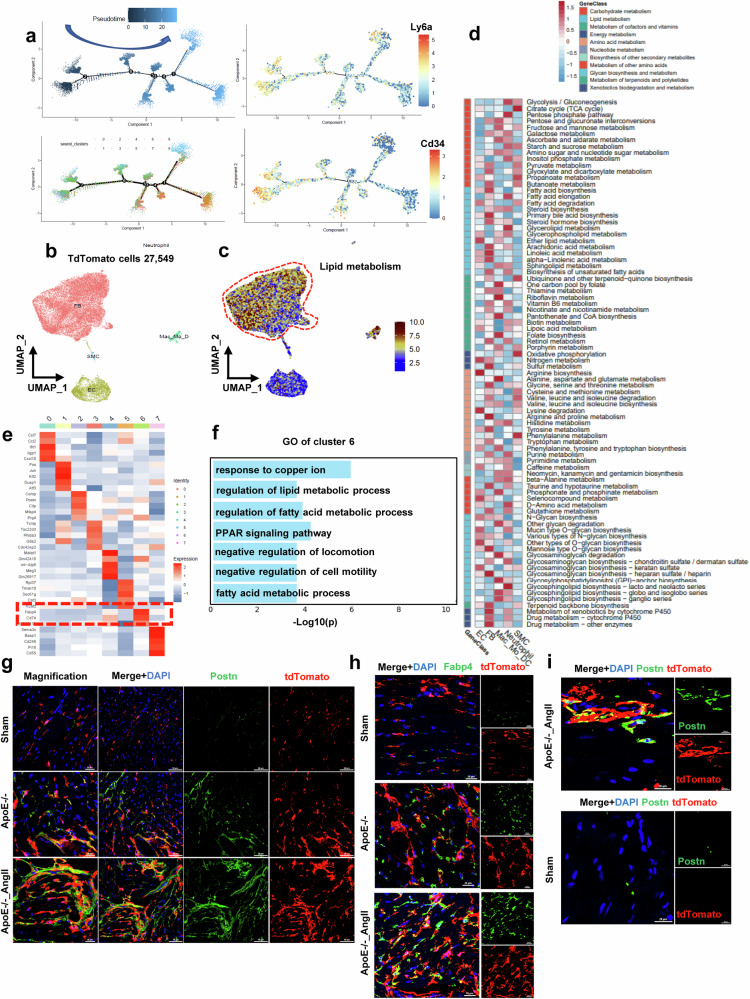
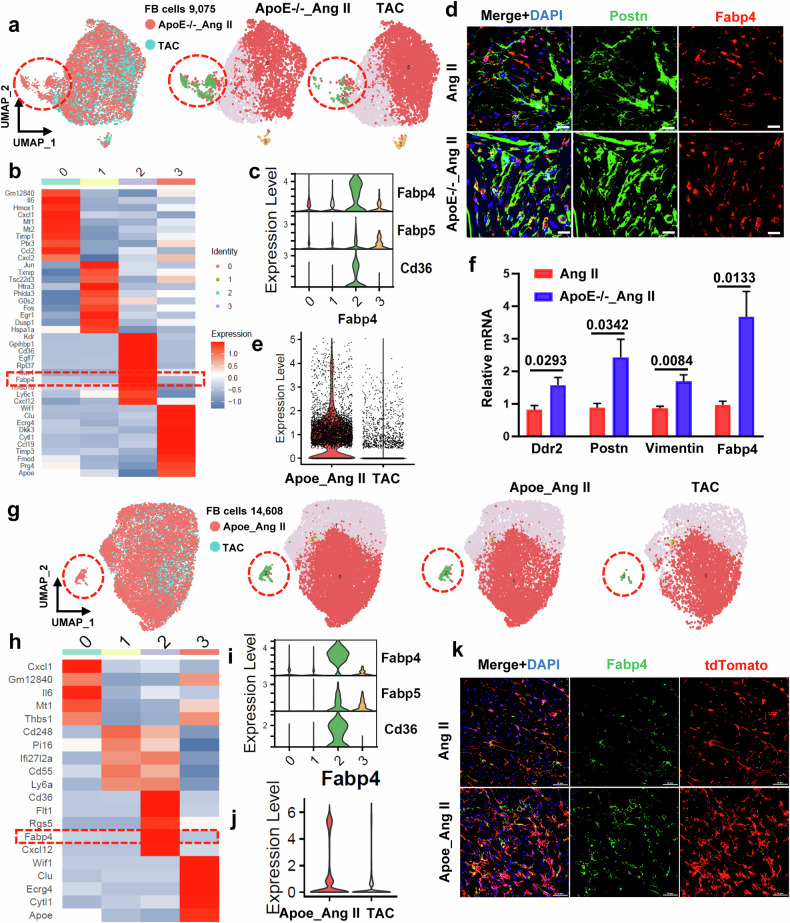
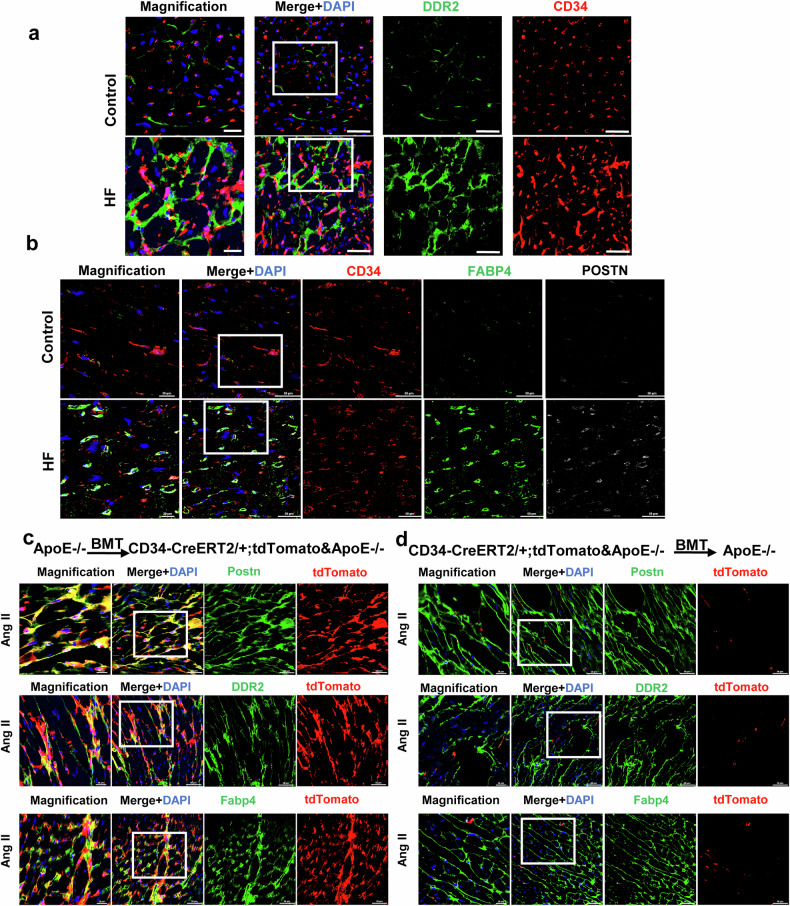
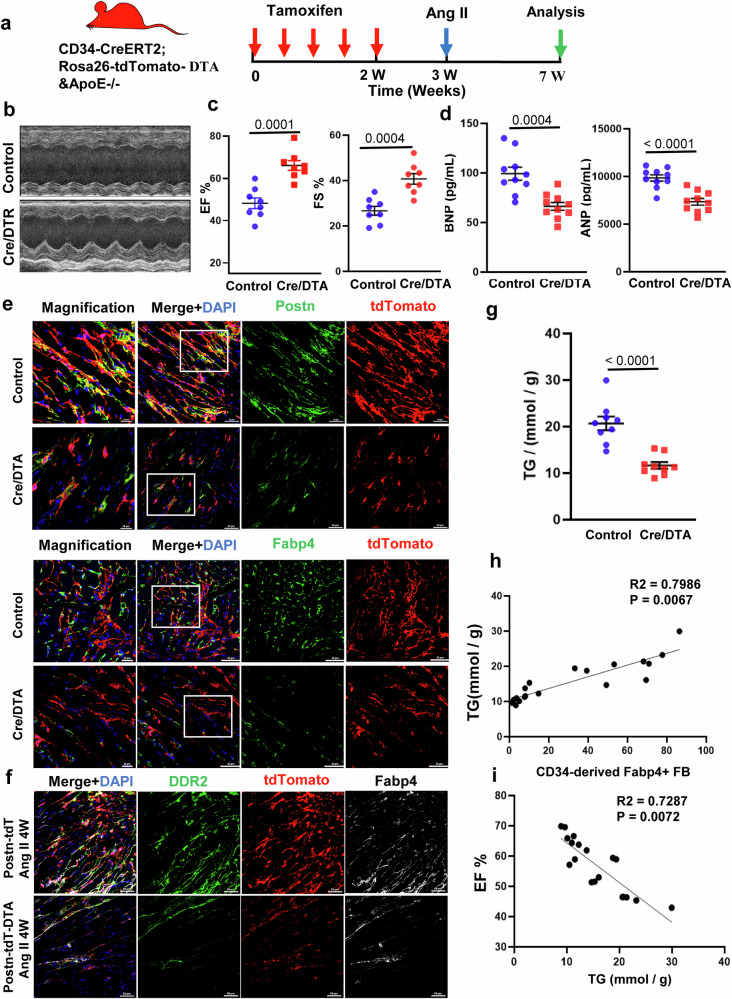
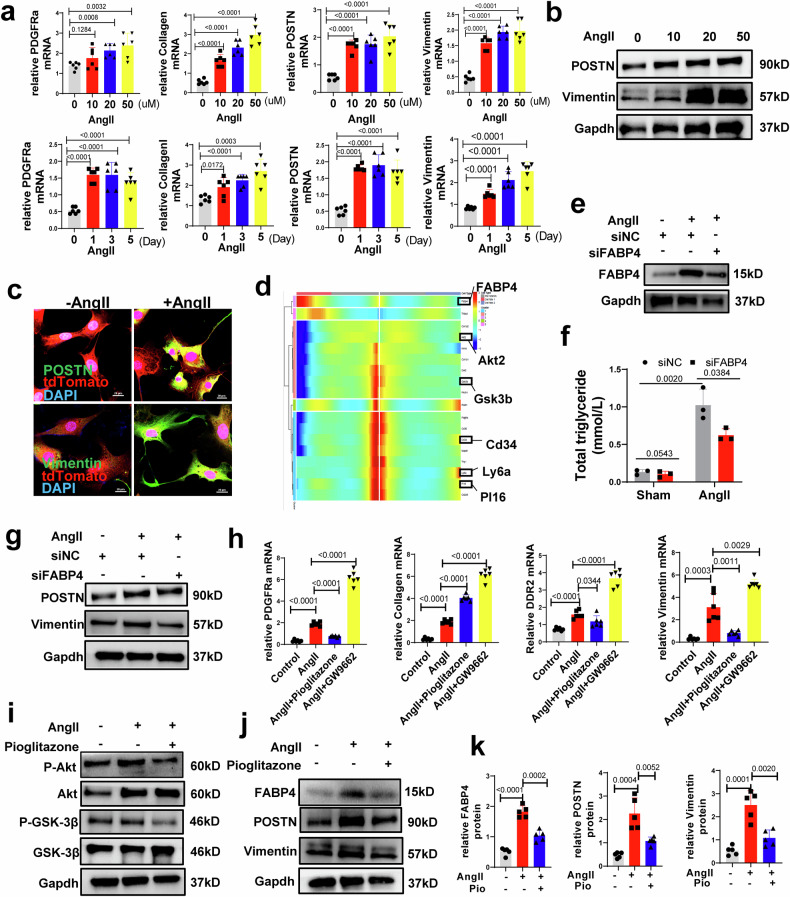
Hyperlipidemia and hypertension might play a role in cardiac fibrosis, in which a heterogeneous population of fibroblasts seems important. However, it is unknown whether CD34+ progenitor cells are involved in the pathogenesis of heart fibrosis. This study aimed to explore the mechanism of CD34+ cell differentiation in cardiac fibrosis during hyperlipidemia. Through the analysis of transcriptomes from 50,870 single cells extracted from mouse hearts and 76,851 single cells from human hearts, we have effectively demonstrated the evolving cellular landscape throughout cardiac fibrosis. Disturbances in lipid metabolism can accelerate the development of fibrosis. Through the integration of bone marrow transplantation models and lineage tracing, our study showed that hyperlipidemia can expedite the differentiation of non-bone marrow-derived CD34+ cells into fibroblasts, particularly FABP4+ fibroblasts, in response to angiotensin II. Interestingly, the partial depletion of CD34+ cells led to a notable reduction in triglycerides in the heart, mitigated fibrosis, and improved cardiac function. Furthermore, immunostaining of human heart tissue revealed colocalization of CD34+ cells and fibroblasts. Mechanistically, our investigation of single-cell RNA sequencing data through pseudotime analysis combined with in vitro cellular studies revealed the crucial role of the PPARγ/Akt/Gsk3β pathway in orchestrating the differentiation of CD34+ cells into FABP4+ fibroblasts. Through our study, we generated valuable insights into the cellular landscape of CD34+ cell-derived cells in the hypertrophic heart with hyperlipidemia, indicating that the differentiation of non-bone marrow-derived CD34+ cells into FABP4+ fibroblasts during this process accelerates lipid accumulation and promotes heart failure via the PPARγ/Akt/Gsk3β pathway.


Conflict of interest statement

The authors declare no competing interests.

Figures

Fig. 1
Fig. 1. Metabolic landscape of patients with hyperlipidemia and hypertension.
a Overview of the study design. b, c Counts and classes of metabolites detected by metabolomics in human serum. d The heatmap shows the different metabolites between the different groups. e KEGG analysis of differentially abundant metabolites. f Counts and classes of metabolites detected by metabolomics in mouse serum. g The heatmap shows the different metabolites between the different groups. h Bar chart of differential lipid classes. i Volcanic map of differential lipids.
Fig. 2
Fig. 2. ScRNA-seq analysis of noncardiomyocytes from heart failure patients with hyperlipidemia and hypertension.
a Schematic depicting the pipeline of human heart and tissue harvesting for scRNA-seq. Single cells were then isolated from the left ventricle and subjected to scRNA-seq. b UMAP plot displaying the major cell types and color-coded cell clusters of human hearts. c Bar chart showing the percentages of major cell types among different datasets. d UMAP plot displaying the distribution of lipids according to GSVA. e UMAP plot displaying the distribution of fibroblast subpopulations. Resolution = 0.5. f Violin plot showing the expression of selected marker genes in each subcluster. g GO analysis of Cluster 5 showed that FABP4+ fibroblasts were enriched in the triglyceride metabolism pathway (R-HAS-163560, circled by the red rectangle). h, i Representative images showing specific cells identified by staining for POSTN, FABP4, and PDGFRa. Scale bars, 50 μm and 20 μm in magnified images. j mRNA levels of a fibroblastic marker (Postn) and FABP4 in total fibroblasts isolated from patient hearts. GAPDH was used as an internal control, n = 4. The data are given as mean ± SEM. P < 0.05 was considered to indicate statistical significance.
Fig. 3
Fig. 3. scRNA-seq analysis of noncardiomyocytes from ApoE-/- mice with hyperlipidemia and hypertension.
a Wheat germ agglutinin (WGA) staining showing cardiomyocyte cell size. Scale bars, 50 μm and 20 μm in magnified images. b. UMAP plot displaying the major cell types and color-coded cell clusters of mouse hearts; UMAP plot displaying the distribution of lipids by GSVA. c UMAP plot displaying the distribution of fibroblast subpopulations among different datasets after Ang II surgery. Resolution = 0.5. d Heatmap showing the expression of the top ten differentially expressed genes in each cell subcluster. e Violin plot showing the expression of selected marker genes in each subcluster. f Violin plot showing the GO dataset scores among fibroblast subclusters. g Bar plot showing the GO enrichment of selected subclusters. h GSVA of fibroblasts from the three groups. i. Representative images showing specific cell identification by staining for Vimentin and Fabp4. Scale bars, 20 μm. j mRNA levels of Fabp4 in total fibroblasts isolated from mouse heart; GAPDH was used as an internal control. Data are given as the mean ± SEM, n = 5. P < 0.05 was considered to indicate statistical significance.
Fig. 4
Fig. 4. Lineage tracing study and scRNA-seq analysis of CD34+ cells in ApoE-/- mice with hyperlipidemia and hypertension.
a Pseudotime-dependent expression of Cd34 and Ly6a. b UMAP plot displaying the major cell types and color-coded cell clusters at different stages of pathological cardiac hypertrophy. c. UMAP plot displaying the distribution of lipids according to GSVA. d GSVA of all cell types. e Heatmap showing the expression of the top ten DEGs in each cell subcluster. f Bar plot showing the GO enrichment of selected subcluster 6. g Representative images showing specific cell identification by staining for Postn and tdTomato. h Representative images showing specific cell identification by staining for Fabp4 and tdTomato. i Representative images showing specific cell identification by staining for Postn and tdTomato in dual-recombinase-activated lineage tracing mice (Cd34-Dre;Postn-CreER;tdTomato&ApoE-/-).
Fig. 5
Fig. 5. scRNA-seq analysis revealed the role of lipid metabolism disturbance in myocardial fibrosis.
a UMAP plot displaying the distribution of fibroblast subpopulations among different datasets. b Heatmap showing the expression of the top ten differentially expressed genes in each cell subcluster. c Violin plot showing the expression of selected marker genes in each subcluster. d Representative images showing specific cell identification by staining for Postn and Fabp4. Scale bars = 20 μm. e Violin plot showing the expression of FABP4 in fibroblasts in the two groups. f mRNA levels of fibroblastic markers (Postn, Vimentin, DDR2 and Fabp4) in the hearts of mice. GAPDH was used as an internal control. Data are presented as the mean ± SEM, n = 4. P < 0.05 was considered to indicate statistical significance. g Heatmap showing the expression of the top ten differentially expressed genes in each cell subcluster from the tdTomato+ cell dataset of these two groups. h, i Violin plot showing the expression of selected marker genes in each subcluster. j Representative images showing specific cell identification by staining for tdTomato and Fabp4. Scale bars, 50 μm. k Representative images showing specific cell identification by staining for Fabp4 and tdTomato. Scale bars = 50 μm.
Fig. 6
Fig. 6. Non-bone marrow CD34+ cells differentiated into fibroblasts to promote fibrosis in cardiac hypertrophy.
a Immunofluorescence staining of fibroblast markers (DDR2 and CD34) in the human heart. Scale bars, 50 μm and 20 μm in magnified images. b Representative images showing specific cell identification by staining for CD34, FABP4, and POSTN in the human heart. Scale bars, 50 μm and 20 μm in magnified images. c Immunofluorescence staining of tdTomato and fibroblast markers (Postn, DDR2, and Fabp4) in the bone marrow transplant of ApoE-/- to CD34-CreERT2;Rosa26-tdTomato&ApoE-/- mice. n = 8 per group. Scale bars, 50 μm and 20 μm in magnified images. d Immunofluorescence staining of tdTomato and fibroblast markers (Postn, DDR2, and Fabp4) in bone marrow transplant of CD34-CreERT2; Rosa26-tdTomato &ApoE-/- mice to ApoE-/-. n = 8 per group. Scale bars, 50 μm and 20 μm in magnified images. BMT bone marrow transplantation. HF heart failure.
Fig. 7
Fig. 7. Inducible ablation delineates the role of cd34+ cells in cardiac fibrosis.
a Schematic showing CD34-CreERT2;Rosa26-tdTomato/DTA&ApoE-/- mice. The experimental scheme in which Cre/DTA mice were given tamoxifen for 1 week before sham or AngII surgery. Heart tissue was harvested 4 weeks after surgery. b Representative echocardiography of CD34-CreERT2;Rosa26-tdTomato (control) and CD34-CreERT2;Rosa26-tdTomato/DTA (Cre/DTA) mice at 4 weeks after surgery. c Echocardiographic measurements of the left ventricle ejection fraction (EF) and fractional shortening (FS) in the control group and Cre/DTA group 4 weeks after surgery. The data are presented as the mean ± SEM; n = 8 for the Cre/DTA group. P < 0.05 was considered to indicate statistical significance. d ELISA detection of serum ANP and BNP in the control group and Cre/DTA group at 4 weeks after surgery. Data are presented as the mean ± SEM, n = 10. P < 0.05 was considered to indicate statistical significance. e Representative immunostaining images showing tdTomato, Postn and Fabp4 staining in the control group and Cre/DTA group. Scale bars, 50 μm and 20 μm in magnified images. f Representative immunostaining images showing the tdTomato, DDR2, and Fabp4 staining in the two groups. Scale bars, 50 μm and 20 μm in magnified images. Total triglyceride (TG) levels in mouse heart tissue were measured. Data are presented as the mean ± SEM, n = 9. P < 0.05 was considered to indicate statistical significance. g Measurement of total triglycerides (TG) in mouse heart tissue, Data represent mean ± SEM, n = 9. P < 0.05 was considered to be statistically significant. h Correlation analysis of CD34-derived Fabp4+ fibroblasts and triglycerides (TG) levels. i Correlation analysis of triglycerides (TG) and the left ventricle ejection fraction (EF).
Fig. 8
Fig. 8. Heart tissue-derived CD34+ cells from ApoE-/- mice differentiated into fibroblasts.
a, b Heart-derived CD34+ cells of ApoE-/- mice treated with different concentrations of AngII (0 μM, 10 μM, 20 μM, and 50 μM) at different times (day 0, day 1, day 3, and day 5). a mRNA levels of fibroblastic markers; GAPDH was used as an internal control. Data represent mean ± SEM, n = 6. P < 0.05 was considered to be statistically significant. b Protein expression of fibroblastic markers after treatment with AngII, data represent mean ± SEM, n = 4. P < 0.05 was considered to be statistically significant. c Immunofluorescence staining of POSTN and Vimentin in tdTomato positive cells after 3 days of AngII stimulation (50 μM) (Scale bar= 50 μm). d Heatmap of the significantly changed genes (P < 0.01) discovered by the BEAM function from monocle in the branch point 3 in Fig. 4a. Cd34, ly6a, and Pi16 genes were detected in Gene Module 1, and the FABP4 gene in module 3. eg CD34+ cells were transfected with FABP4 siRNA and then treated with AngII (50 μM) for 3 days. Data represent mean ± SEM. e Protein expression of FABP4 was determined by western blotting; f Total triglyceride in the cells, n = 3. g Protein expression of fibroblastic markers was determined by western blotting; hk CD34+ cells were treated with PPARγ agonist pioglitazone (10 nM) and PPARγ antagonist GW9662 and then treated with AngII (50 μM) for 3 days: h mRNA levels of fibroblastic markers and ECM proteins; GAPDH was used as an internal control, n = 6; P < 0.05 was considered to be statistically significant. i Protein expression of Akt and GSK3beta was determined by western blotting. j Protein expression of FABP4 and fibroblastic markers were determined by western blotting. k Quantitative data of FABP4 and fibroblastic markers is shown; GAPDH was used as an internal control, n = 5. P < 0.05 was considered to be statistically significant.

References

    1. Tanai, E. & Frantz, S. Pathophysiology of heart failure. Compr Physiol. 6, 187–214 (2015). - PubMed
    1. Travers, J. G., Kamal, F. A., Robbins, J., Yutzey, K. E. & Blaxall, B. C. Cardiac fibrosis: the fibroblast awakens. Circ Res. 118, 1021–1040 (2016). - PMC - PubMed
    1. Hotamisligil, G. S. & Bernlohr, D. A. Metabolic functions of FABPs-mechanisms and therapeutic implications. Nat Rev Endocrinol. 11, 592–605 (2015). - PMC - PubMed
    1. Furuhashi, M. Fatty acid-binding Protein 4 in cardiovascular and metabolic diseases. J Atheroscler Thromb. 26, 216–232 (2019). - PMC - PubMed
    1. Feng, Y. et al. Inhibition of fatty acid-binding protein 4 attenuated kidney fibrosis by mediating macrophage-to-myofibroblast transition. Front Immunol. 11, 566535 (2020). - PMC - PubMed

MeSH terms