. 2024 Aug 28;14(1):20000.
doi: 10.1038/s41598-024-70228-6.

Comprehensive serum glycopeptide spectra analysis to identify early-stage epithelial ovarian cancer

Affiliations

Comprehensive serum glycopeptide spectra analysis to identify early-stage epithelial ovarian cancer

Mikio Mikami et al. Sci Rep. .

Abstract

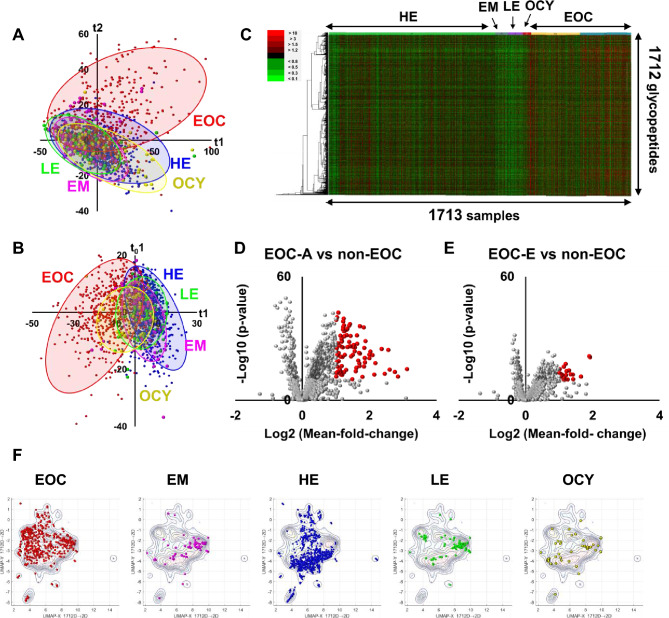
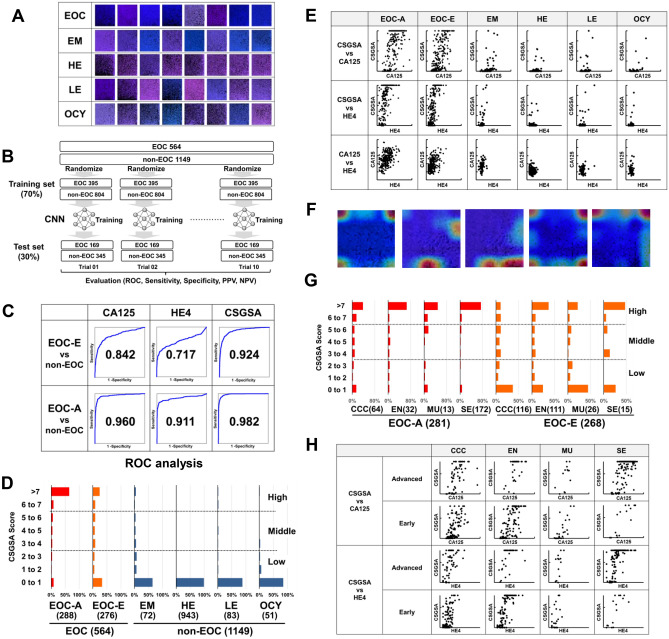
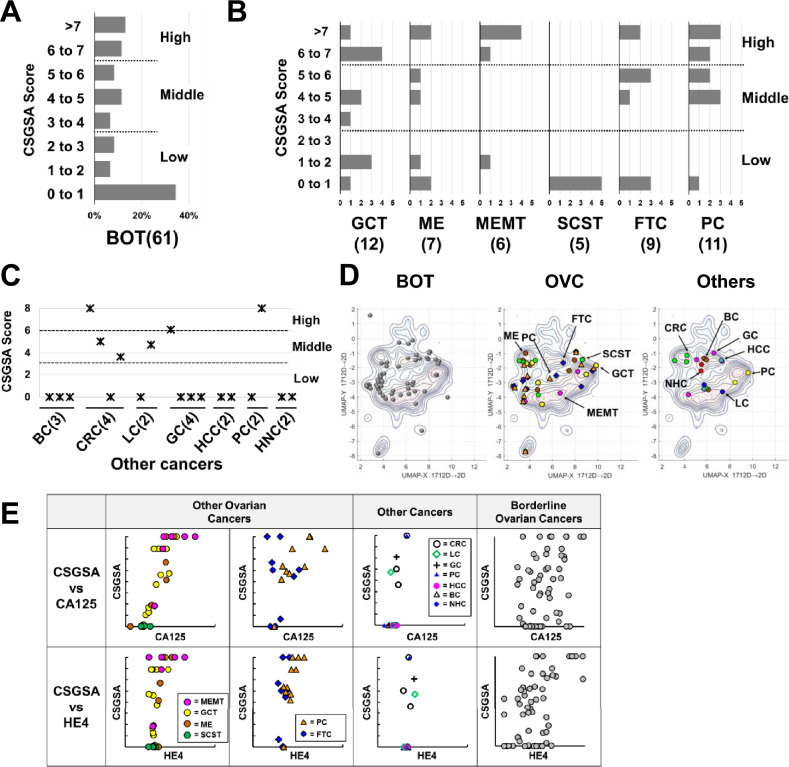
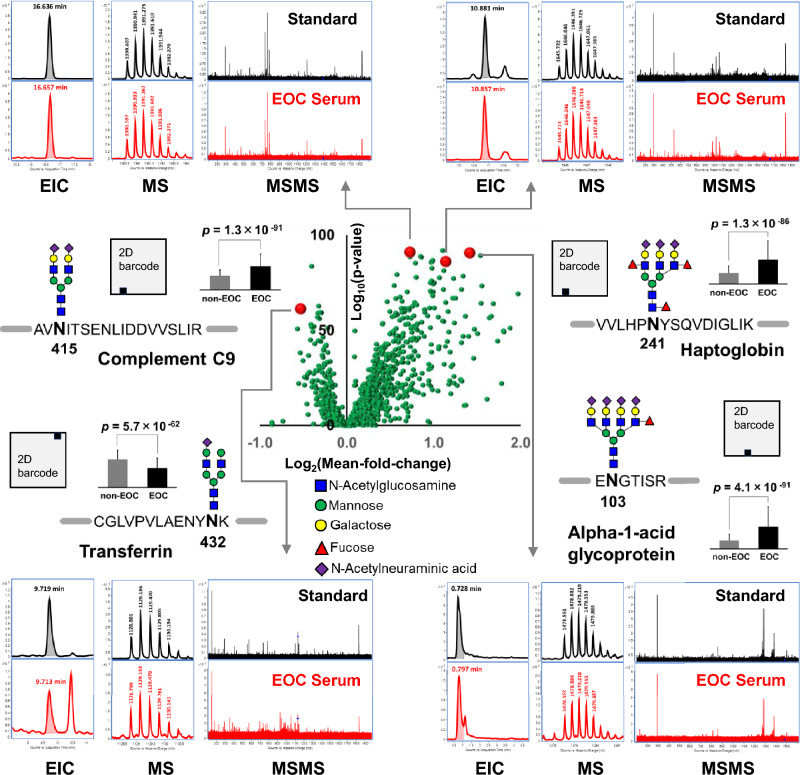
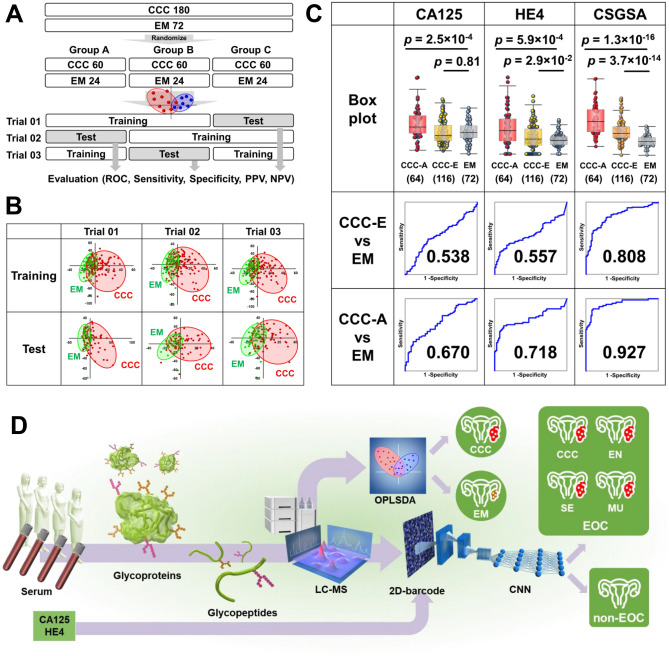
Epithelial ovarian cancer (EOC) is widely recognized as the most lethal gynecological malignancy; however, its early-stage detection remains a considerable clinical challenge. To address this, we have introduced a new method, named Comprehensive Serum Glycopeptide Spectral Analysis (CSGSA), which detects early-stage cancer by combining glycan alterations in serum glycoproteins with tumor markers. We detected 1712 glycopeptides using liquid chromatography-mass spectrometry from the sera obtained from 564 patients with EOC and 1149 controls across 13 institutions. Furthermore, we used a convolutional neural network to analyze the expression patterns of the glycopeptides and tumor markers. Using this approach, we successfully differentiated early-stage EOC (Stage I) from non-EOC, with an area under the curve (AUC) of 0.924 in receiver operating characteristic (ROC) analysis. This method markedly outperforms conventional tumor markers, including cancer antigen 125 (CA125, 0.842) and human epididymis protein 4 (HE4, 0.717). Notably, our method exhibited remarkable efficacy in differentiating early-stage ovarian clear cell carcinoma from endometrioma, achieving a ROC-AUC of 0.808, outperforming CA125 (0.538) and HE4 (0.557). Our study presents a promising breakthrough in the early detection of EOC through the innovative CSGSA method. The integration of glycan alterations with cancer-related tumor markers has demonstrated exceptional diagnostic potential.

Keywords: Clear cell carcinoma; Convolutional neural network; Glycomics; Glycopeptide; Mass spectrometry; Ovarian cancer.


Conflict of interest statement

KT(Kazuhiro Tanabe), TK(Tomoko Katahira), and CH are employed by LSI Medience Corporation, which can provide ovarian cancer screening. MM and LSI Medience Corporation applied for a patent related to this research in Japan (2019–108992). The remaining authors declare that they have no competing interests.

Figures

Figure 1
Figure 1
Comparison of EGP expressions between the EOC and non-EOC groups. The analyses included 1713 participants: 564 with EOC and 1149 without, comprising 943 healthy women (HE), 83 patients with uterine myoma (LE), 72 with endometrioma (EM), and 51 with ovarian cysts (OCY). (A) Score plot of the principal component analysis (PCA) of the EOC and non-EOC groups plotted based on the first and second components: Red: EOC, Blue: HE, Yellow: OCY, Pink: EM, and Green: LE. (B) Score plot of the OPLSDA model plotted using t1 and t01: Red: EOC, Blue: HE, Yellow: OCY, Pink: EM, and Green: LE. (C) Heatmap comprising 1712 EGPs and 1713 individuals: The EGPs were rearranged using cluster analysis. Red: relatively increased, Green: relatively decreased, and Black: not changed. (D) Volcano plot comparing the EOC-A (advanced-stage) and non-EOC groups, and (E) Volcano plot comparing the EOC-E (early-stage )and non-EOC groups: The vertical axis represents the − log10 (p-value) from the Student’s t-test, and the horizontal axis represents the log2 (mean fold change). The cut-off criteria were set at a − log10 (p-value) greater than 10 and a log2 (mean fold change) greater than 1 or less than − 1. (F) UMAP Analysis: The plots depict a UMAP analysis based on 1712 EGPs from five distinct groups. Each data point corresponds to an individual patient or healthy woman, and the contours illustrate the density of the distribution across all cases.
Figure 2
Figure 2
Establishing and evaluating CSGSA CNN model for identifying early-stage EOC. (A) Representative 2D barcode images illustrating EGP expression and tumor markers (CA125 and HE49) within each disease category. (B) CNN model establishment and assessment methodology. The model was developed using a training set (70%) and subsequently evaluated on a separate test set (30%). This process was iterated 10 times, and the ROC-AUC was calculated using the sum of 10 trials. (C) ROC-AUCs of CA125, HE4, and CSGSA between EOC-E and non-EOC , and between EOC-A and non-EOC; the values in the charts represent AUCs. (D) Histograms based on the CSGSA scores for each disease group; cutoffs were set at 3 and 6 and patients were divided into three groups; high, middle, and low-risk. Sensitivity, specificity, and PPV are shown in Table 2. (E) Correlation between CSGSA scores and tumor markers (CA125 and HE4): CA125 and HE4 values were logarithmically converted. (F) Gradient-weighted Class Activation Mapping (Grad-CAM) analysis: The portions that CNN used to discriminate EOCs are shown in red and yellow. (G) Histograms illustrating CSGSA scores for clear cell carcinoma (CCC), endometrioma (EN), mucinous (MU), and serous (SE) in the EOC-A and EOC-E groups: Scores are classified as high, middle, or low using cutoff values of 3 and 6. The number of patients is indicated in parentheses. (H) Correlations between CSGSA scores and the tumor markers CA125 and HE4 for CCC, EN, MU, and SE cases in the EOC-A and EOC-E groups. CA125 and HE4 values were logarithmically converted.
Figure 3
Figure 3
CSGSA selectivity against other cancers. (A) Histogram of the CSGSA scores for borderline ovarian tumors (BOT). (B) Histograms of the CSGSA scores for ovarian cancers, except for EOC. (C) CSGSA scores for other general cancers. (D) UMAP analysis of BOT, other ovarian cancer (OVC), and other cancers. The number of patients is indicated in parentheses. (E) Correlation between CSGSA scores and the tumor markers CA125 and HE4 for other ovarian cancers, other general cancers, and BOT.
Figure 4
Figure 4
Identification of the glycopeptides contributing to EOC discrimination. Volcano plot displaying 1712 EGPs when comparing all EOC and non-EOC samples (center); the horizontal axis represents log2 (mean fold ratio) and the vertical axis represents log10 (Student’s t-test p-value). The identified glycopeptides are marked with red circles. Extracted ion chromatogram (EIC), single mass spectrum (MS), and MS/MS spectrum (MSMS) of the glycopeptides obtained from purified standard serum proteins (in black) and EOC serum (in red) are presented. Proposed proteins, peptide sequences, and sugar chain structures are illustrated in each corner. The positions of the identified glycopeptides on the 2D barcode, along with bar graphs illustrating their relative abundance in EOC and non-EOC groups, are presented.
Figure 5
Figure 5
Evaluating the CSGSA OPLSDA model for distinguishing CCC from EM. (A) Method to establish and assess the OPLSDA model: The samples were randomly divided into three groups; the OPLSDA model was established using two groups as a training set. The remaining group was used as a test set. (B) OPLSDA score plots of the training and test sets for three trials. Red: CCC and Green: EM. (C) Box plot and ROC-AUC values between CCC-E and EM, and between CCC-A and EM for CA125, HE4, and CSGSA; CA125 and HE4 values were logarithmically converted. The p-values of Student’s t-test for between CCC-E and EM and between CCC-A and EM were calculated. (D) Proposed scheme of CSGSA: 1712 EGPs, obtained through proteolysis, were subjected to liquid chromatography–mass spectrometry analysis. The resulting data, along with CA125 and HE4 values, were used to generate 2D barcodes. A pretrained CNN model was used to interpret the 2D barcode pattern to classify whether it corresponds to EOC. The OPLSDA model was used to differentiate between CCC and EM based on the expression patterns of these 1712 EGPs.

References

    1. Siegel, R. L., Miller, K. D., Wagle, N. S. & Jemal, A. Cancer statistics, 2023. CA: Cancer J. Clin.73, 17–48 (2023). - PubMed
    1. Cronin, K. A. et al. Annual report to the nation on the status of cancer, part 1: National cancer statistics. Cancer128, 4251–4284 (2022). 10.1002/cncr.34479 - DOI - PMC - PubMed
    1. Cancer Research UK, Ovarian cancer survival statistics, https://www.cancerresearchuk.org/about-cancer/ovarian-cancer/survival, accessed on Feb. 14, 2023.
    1. Khiewvan, B. et al. An update on the role of PET/CT and PET/MRI in ovarian cancer. Eur. J. Nuclear Med. Mol. Imaging44, 1079–1091 (2017). 10.1007/s00259-017-3638-z - DOI - PubMed
    1. Sironi, S. et al. Integrated FDG PET/CT in patients with persistent ovarian cancer: Correlation with histologic findings. Radiology233, 433–440 (2004). 10.1148/radiol.2332031800 - DOI - PubMed

MeSH terms